PROBLEM 6-1A
(a) The sale will be recorded on February 26. The goods (cost, $800) should
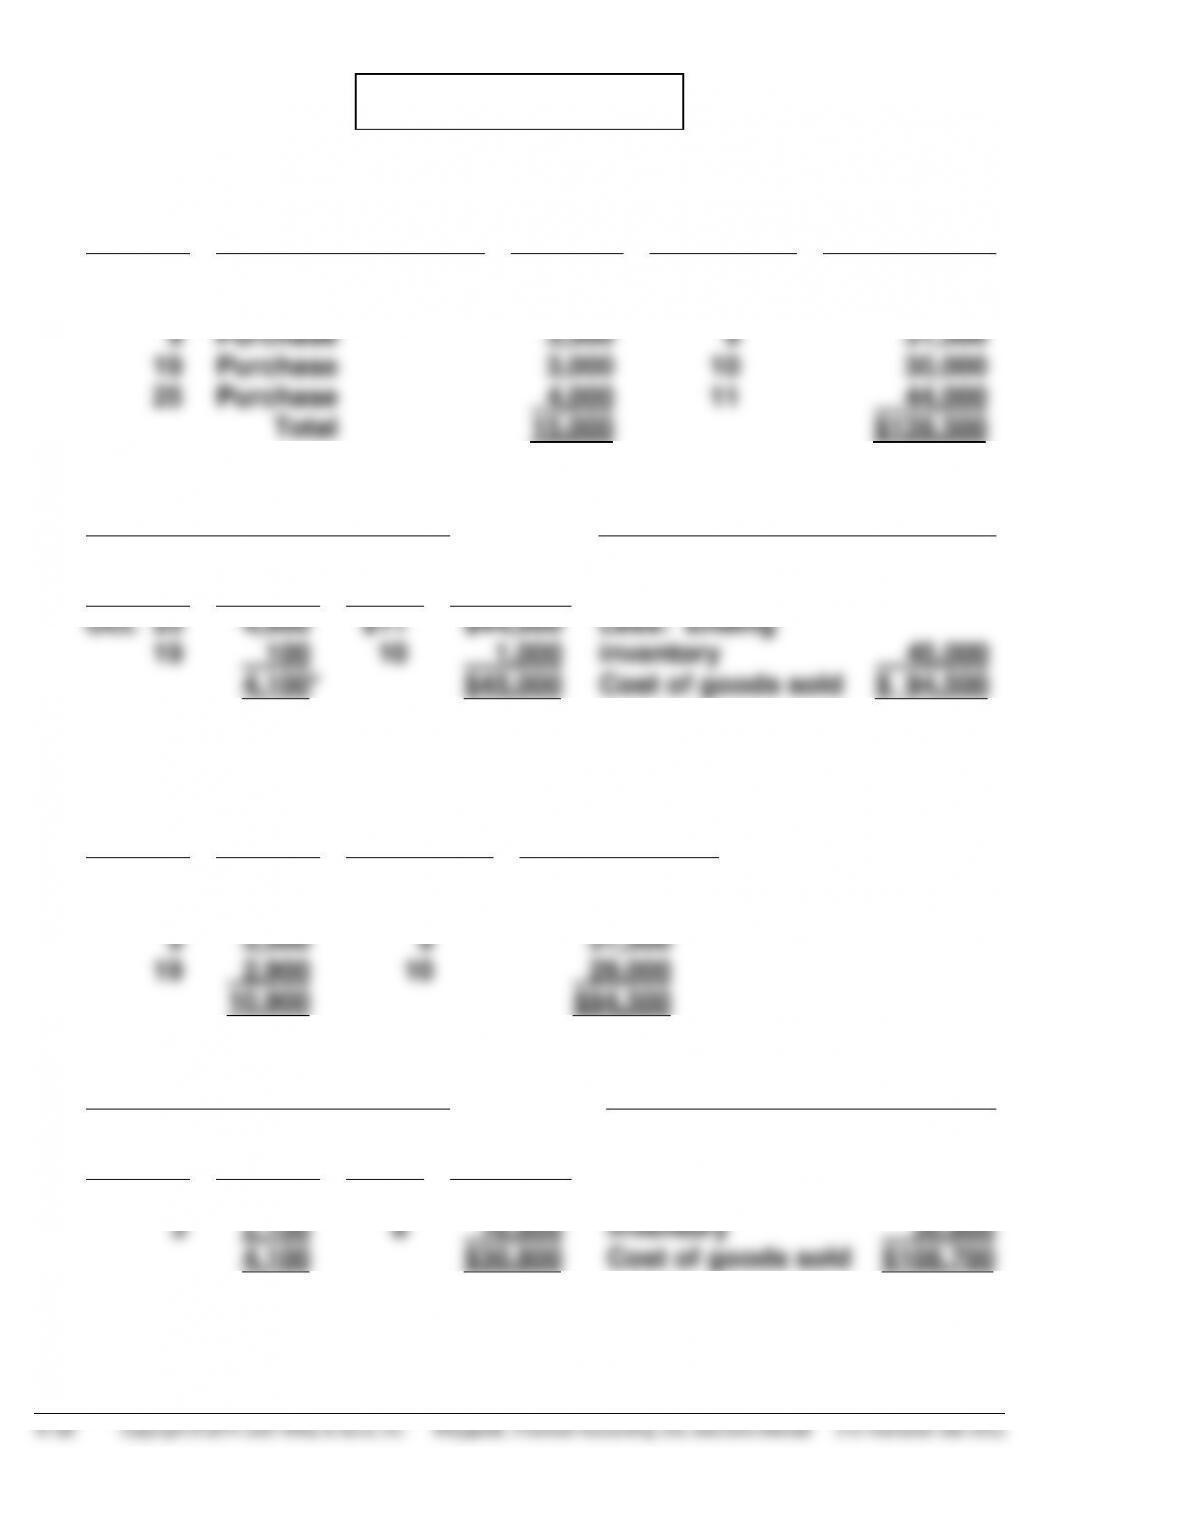
PROBLEM 6-2A
(a)
COST OF GOODS AVAILABLE FOR SALE
Date
Explanation
Units
Unit Cost
Total Cost
Oct. 1
Beginning Inventory
2,000
$7
$ 14,000
3
Purchase
2,500
8
20,000
9
Purchase
3,500
9
31,500
19
Purchase
3,000
10
30,000
25
Purchase
4,000
11
44,000
Total
15,000
$139,500
(b)
FIFO
(1)
Ending Inventory
(2)
Cost of Goods Sold
Date
Units
Unit
Cost
Total
Cost
Cost of goods
available for sale
$139,500
Oct. 25
4,000
$11
$44,000
Less: Ending
inventory
45,000
19
100
10
1,000
4,100*
$45,000
Cost of goods sold
$ 94,500
*15,000 – 10,900 = 4,100
Proof of Cost of Goods Sold
Date
Units
Unit Cost
Total Cost
Oct. 1
2,000
$7
$14,000
3
2,500
8
20,000
9
3,500
9
31,500
19
2,900
10
29,000
10,900
$94,500
LIFO
(1)
Ending Inventory
(2)
Cost of Goods Sold
Date
Units
Unit
Cost
Total
Cost
Cost of goods
available for sale
$139,500
Oct. 1
2,000
$7
$14,000
Less: Ending
inventory
30,800
3
2,100
8
16,800
4,100
$30,800
Cost of goods sold
$108,700
PROBLEM 6-2A (Continued)
Proof of Cost of Goods Sold
Date
Units
Unit
Cost
Total
Cost
Oct. 25
4,000
$11
$ 44,000
19
3,000
10
30,000
9
3,500
9
31,500
3
400
8
3,200
10,900
$108,700
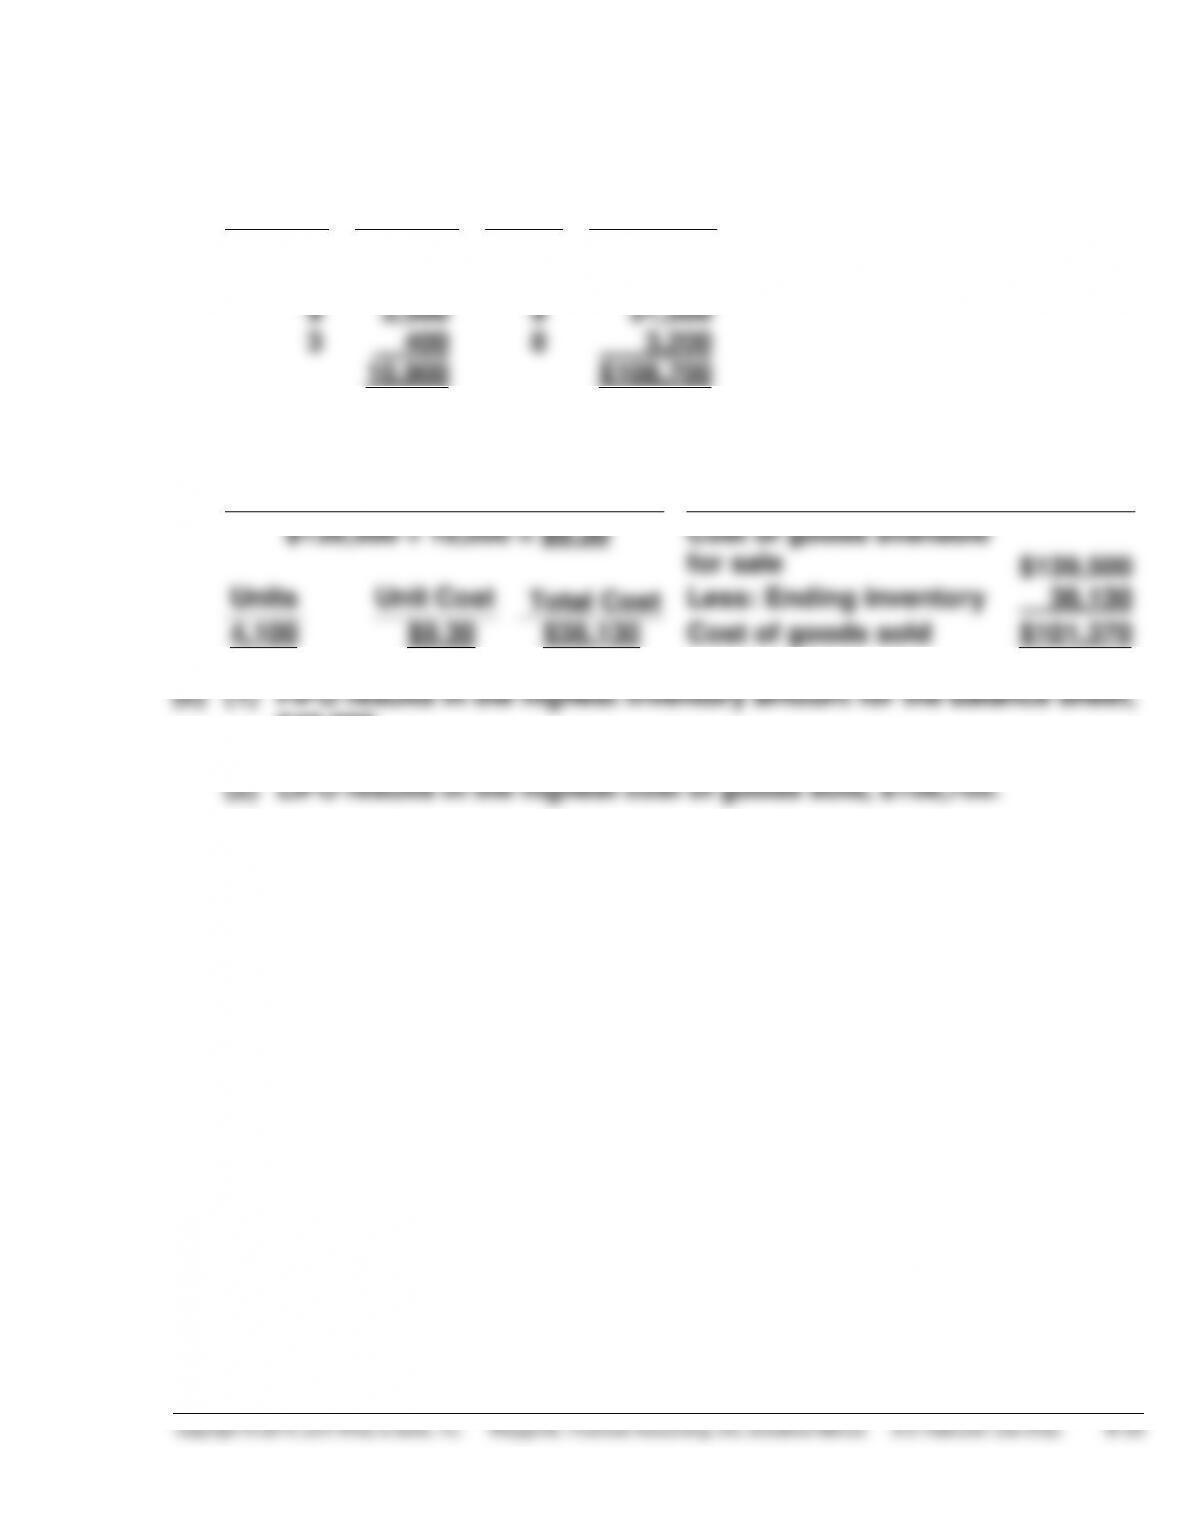
AVERAGE COST
(1)
Ending Inventory
(2)
Cost of Goods Sold
$139,500 ÷ 15,000 = $9.30
Cost of goods available
for sale
$139,500
Units
Unit Cost
Total Cost
Less: Ending inventory
38,130
4,100
$9.30
$38,130
Cost of goods sold
$101,370
$45,000.
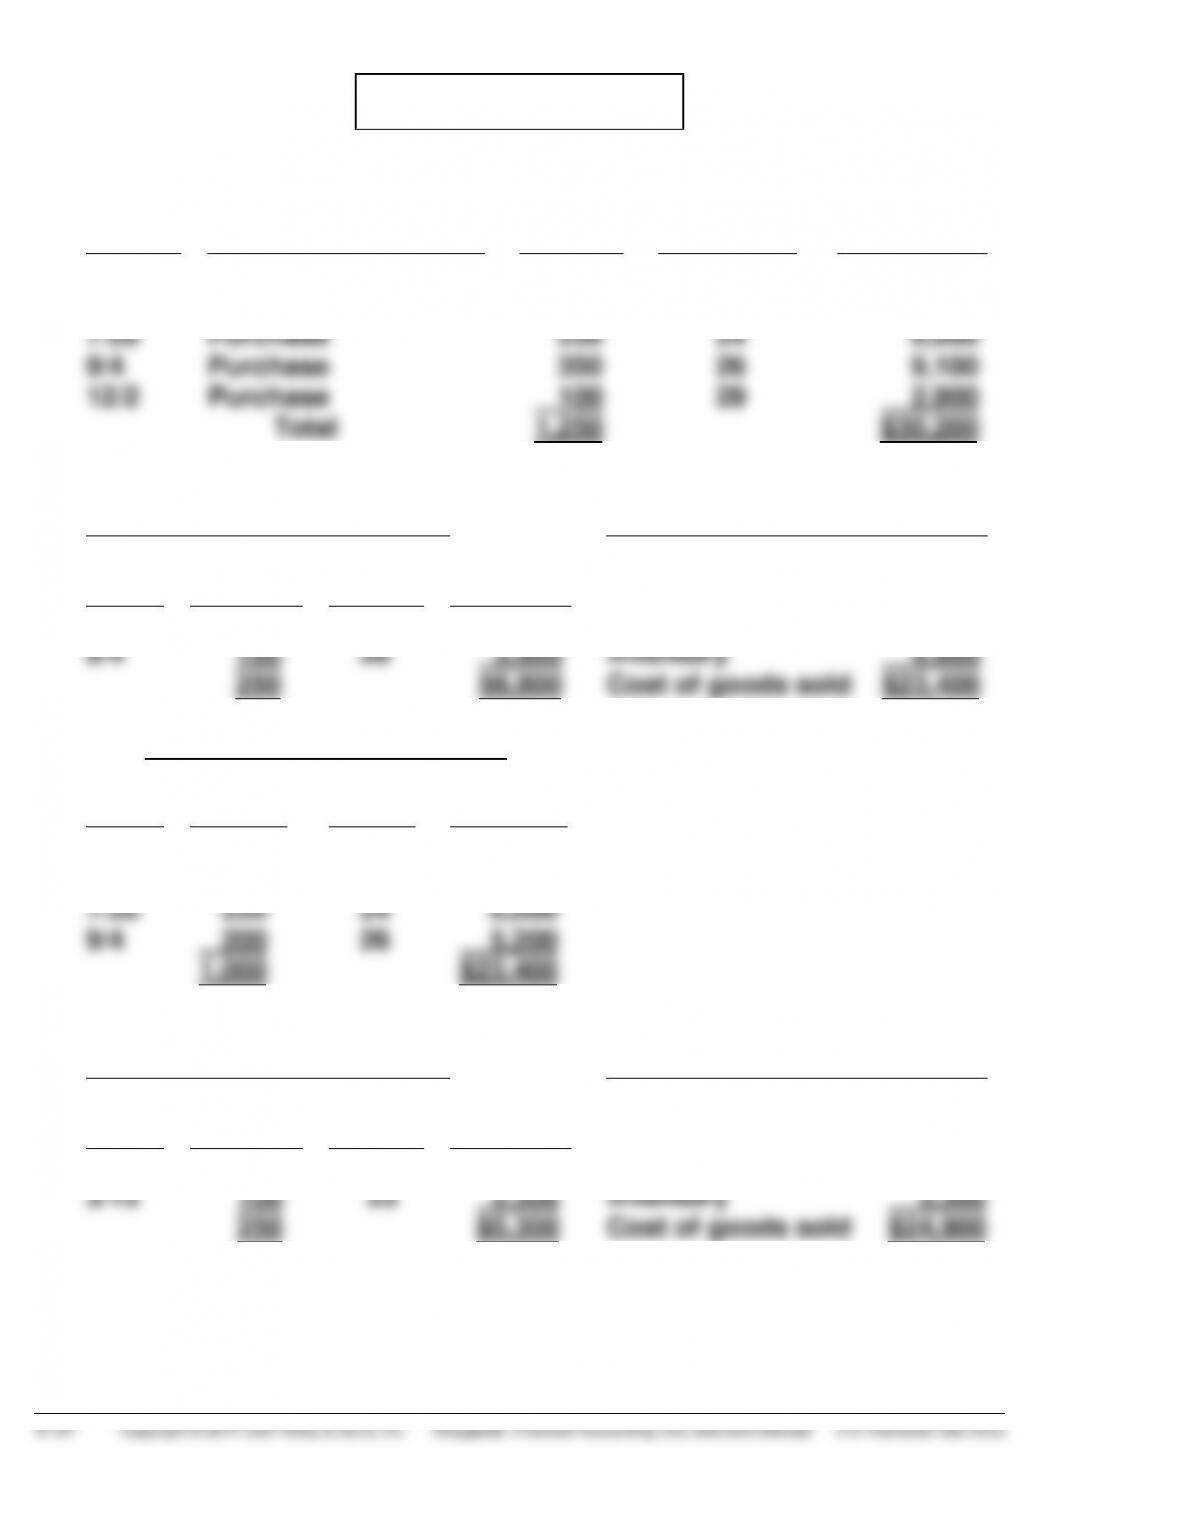
PROBLEM 6-3A
(a)
COST OF GOODS AVAILABLE FOR SALE
Date
Explanation
Units
Unit Cost
Total Cost
1/1
Beginning Inventory
150
$20
$ 3,000
3/15
Purchase
400
23
9,200
7/20
Purchase
250
24
6,000
9/4
Purchase
350
26
9,100
12/2
Purchase
100
29
2,900
Total
1,250
$30,200
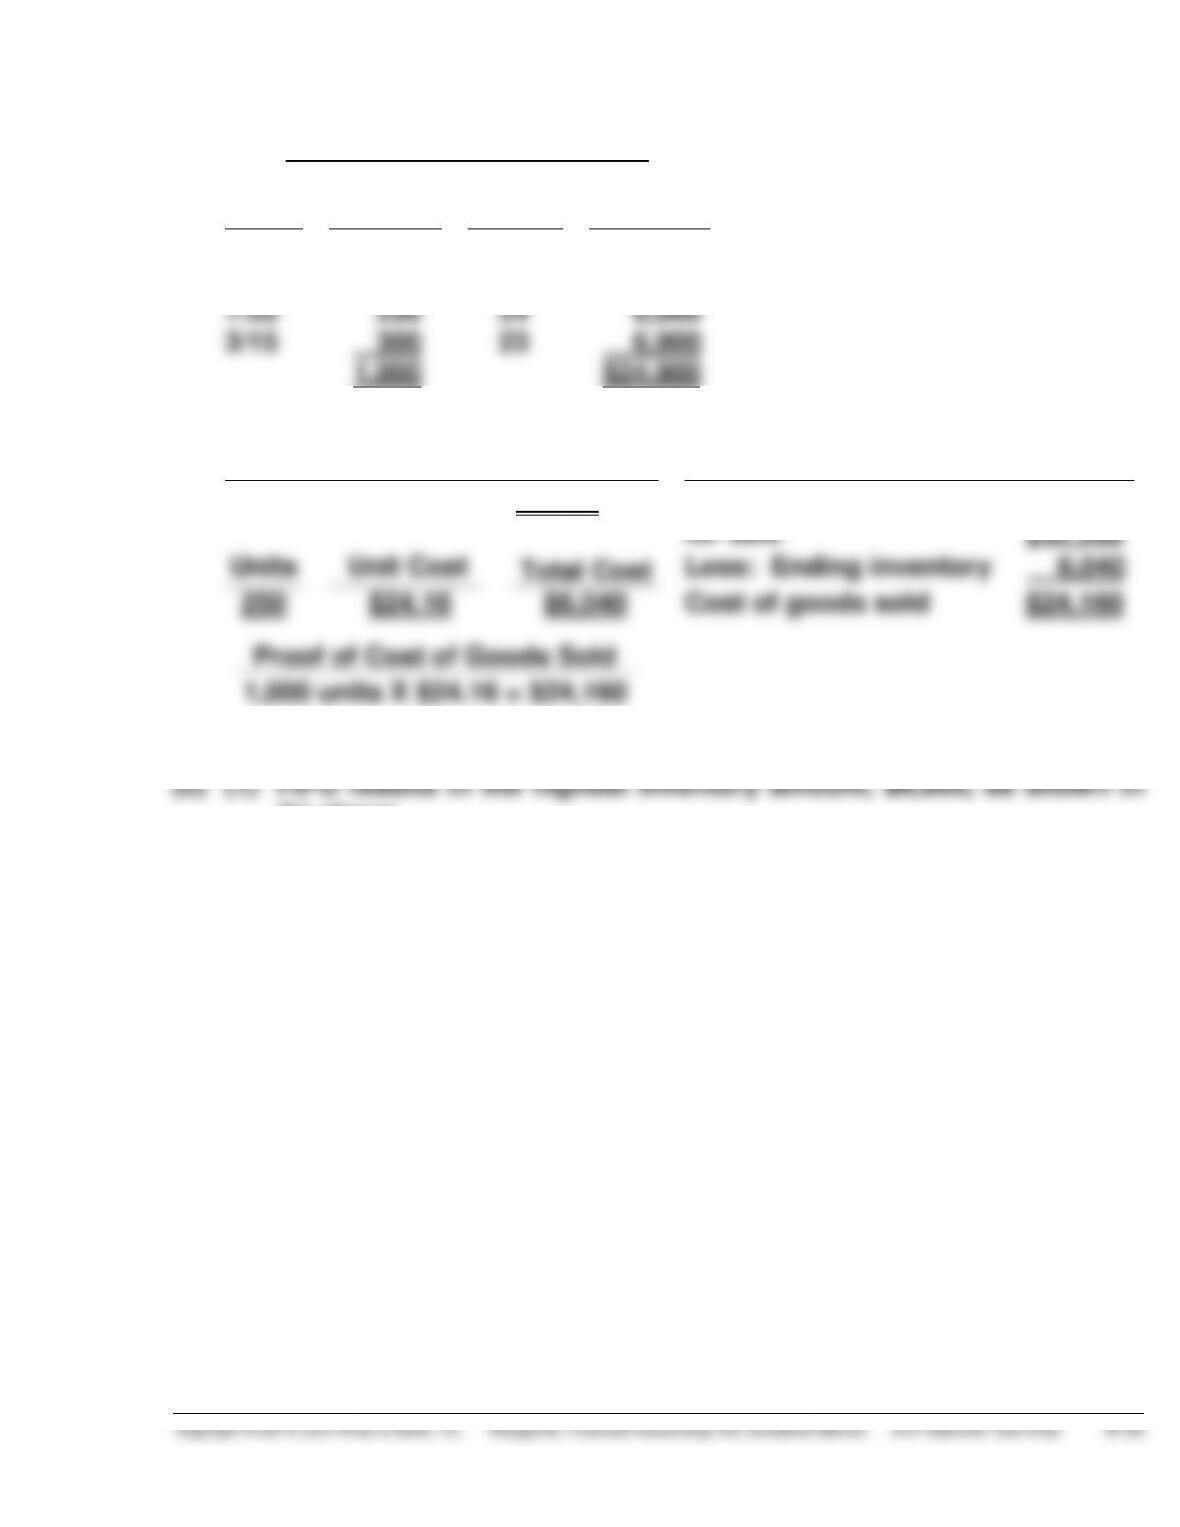
(b)
FIFO
(1)
Ending Inventory
(2)
Cost of Goods Sold
Date
Units
Unit
Cost
Total
Cost
Cost of goods
available for sale
$30,200
12/2
100
$29
$2,900
Less: Ending
inventory
6,800
9/4
150
26
3,900
250
$6,800
Cost of goods sold
$23,400
Proof of Cost of Goods Sold
Date
Units
Unit
Cost
Total
Cost
1/1
150
$20
$ 3,000
3/15
400
23
9,200
7/20
250
24
6,000
9/4
200
26
5,200
1,000
$23,400
LIFO
(1)
Ending Inventory
(2)
Cost of Goods Sold
Date
Units
Unit
Cost
Total
Cost
Cost of goods
available for sale
$30,200
1/1
150
$20
$3,000
Less: Ending
inventory
5,300
3/15
100
23
2,300
250
$5,300
Cost of goods sold
$24,900
PROBLEM 6-3A (Continued)
Proof of Cost of Goods Sold
Date
Units
Unit
Cost
Total
Cost
12/2
100
$29
$ 2,900
9/4
350
26
9,100
7/20
250
24
6,000
3/15
300
23
6,900
1,000
$24,900
AVERAGE COST
(1)
Ending Inventory
(2)
Cost of Goods Sold
$30,200 ÷ 1,250 = $24.16
Cost of goods available
for sale
$30,200
Units
Unit Cost
Total Cost
Less: Ending inventory
6,040
250
$24.16
$6,040
Cost of goods sold
$24,160
Proof of Cost of Goods Sold
1,000 units X $24.16 = $24,160
(b) above.
(2) LIFO produces the highest cost of goods sold, $24,900 as shown in
(b) above.
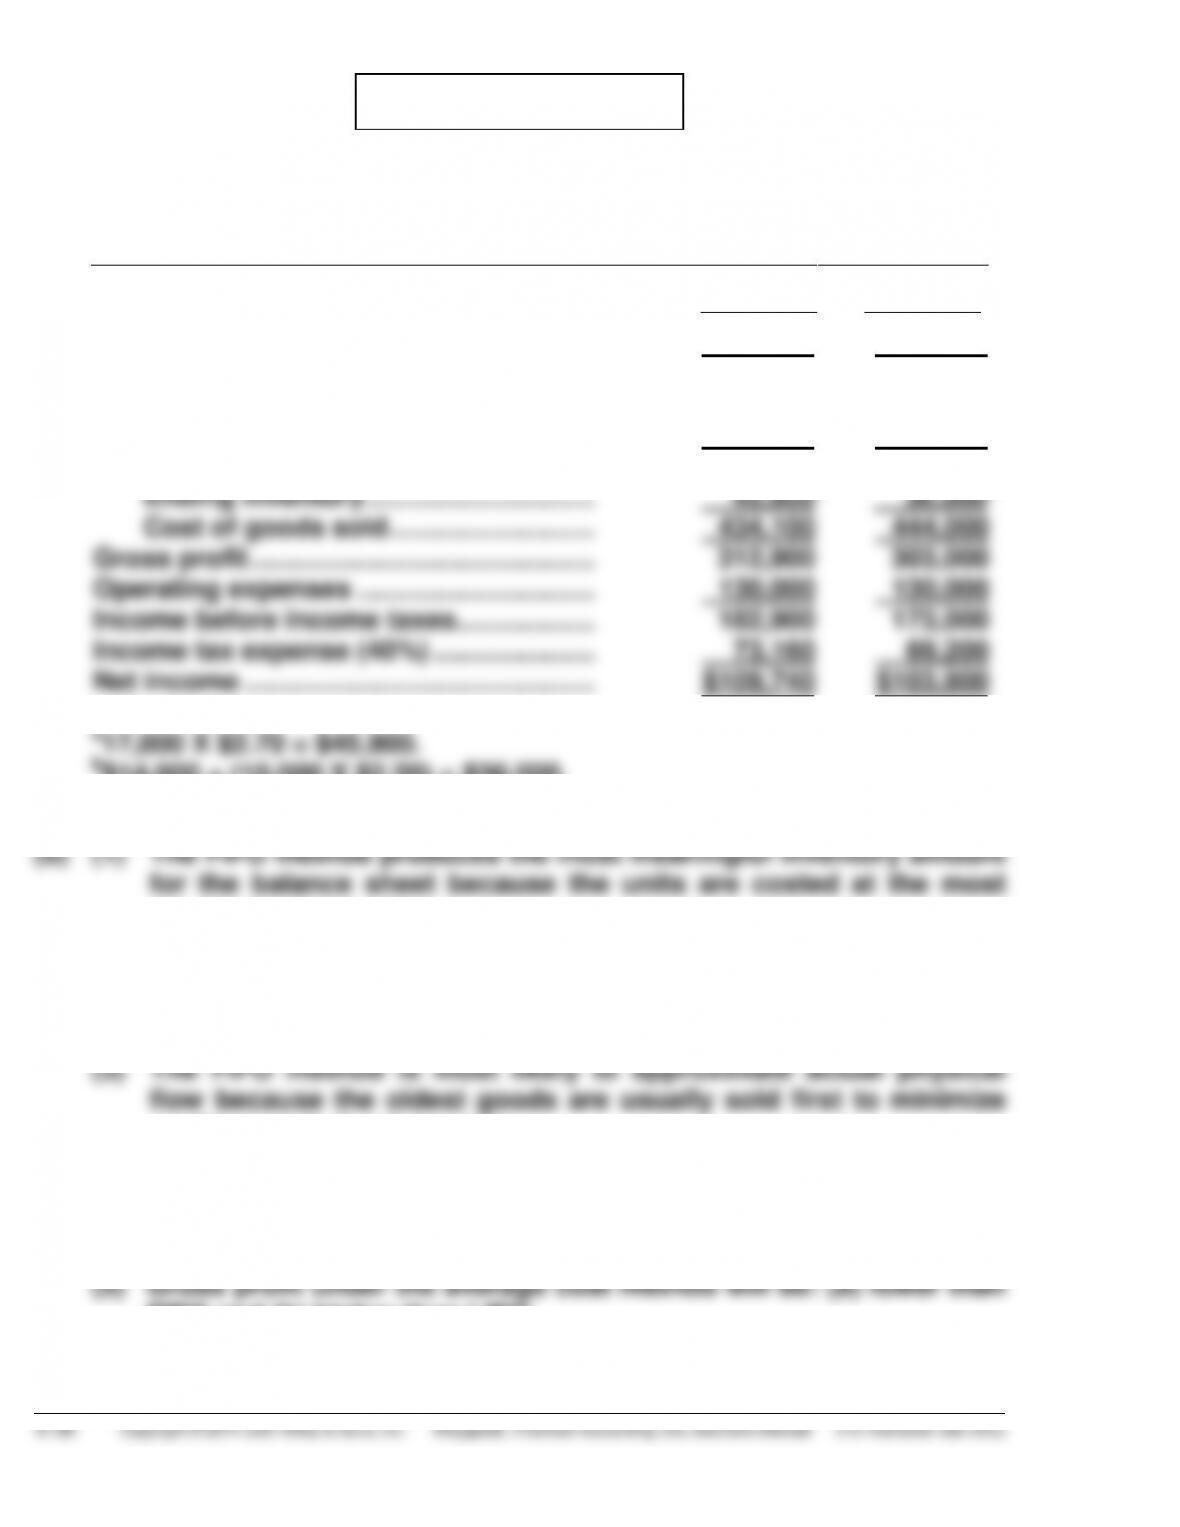
PROBLEM 6-4A
(a) Felipe INC.
Condensed Income Statements
For the Year Ended December 31, 2015
FIFO
LIFO
Sales revenue ………………………………….. $747,000 $747,000
Cost of goods sold
Beginning inventory …………………… 14,000 14,000
Cost of goods purchased ……………. 466,000 466,000
Cost of goods available for sale ….. 480,000 480,000
recent purchase prices.
(2) The LIFO method produces the most meaningful net income because
the cost of the most recent purchases are matched against sales.
spoilage and obsolescence.
(4) There will be $3,960 additional cash available under LIFO because
income taxes are $69,200 under LIFO and $73,160 under FIFO.
FIFO and (b) higher than LIFO.
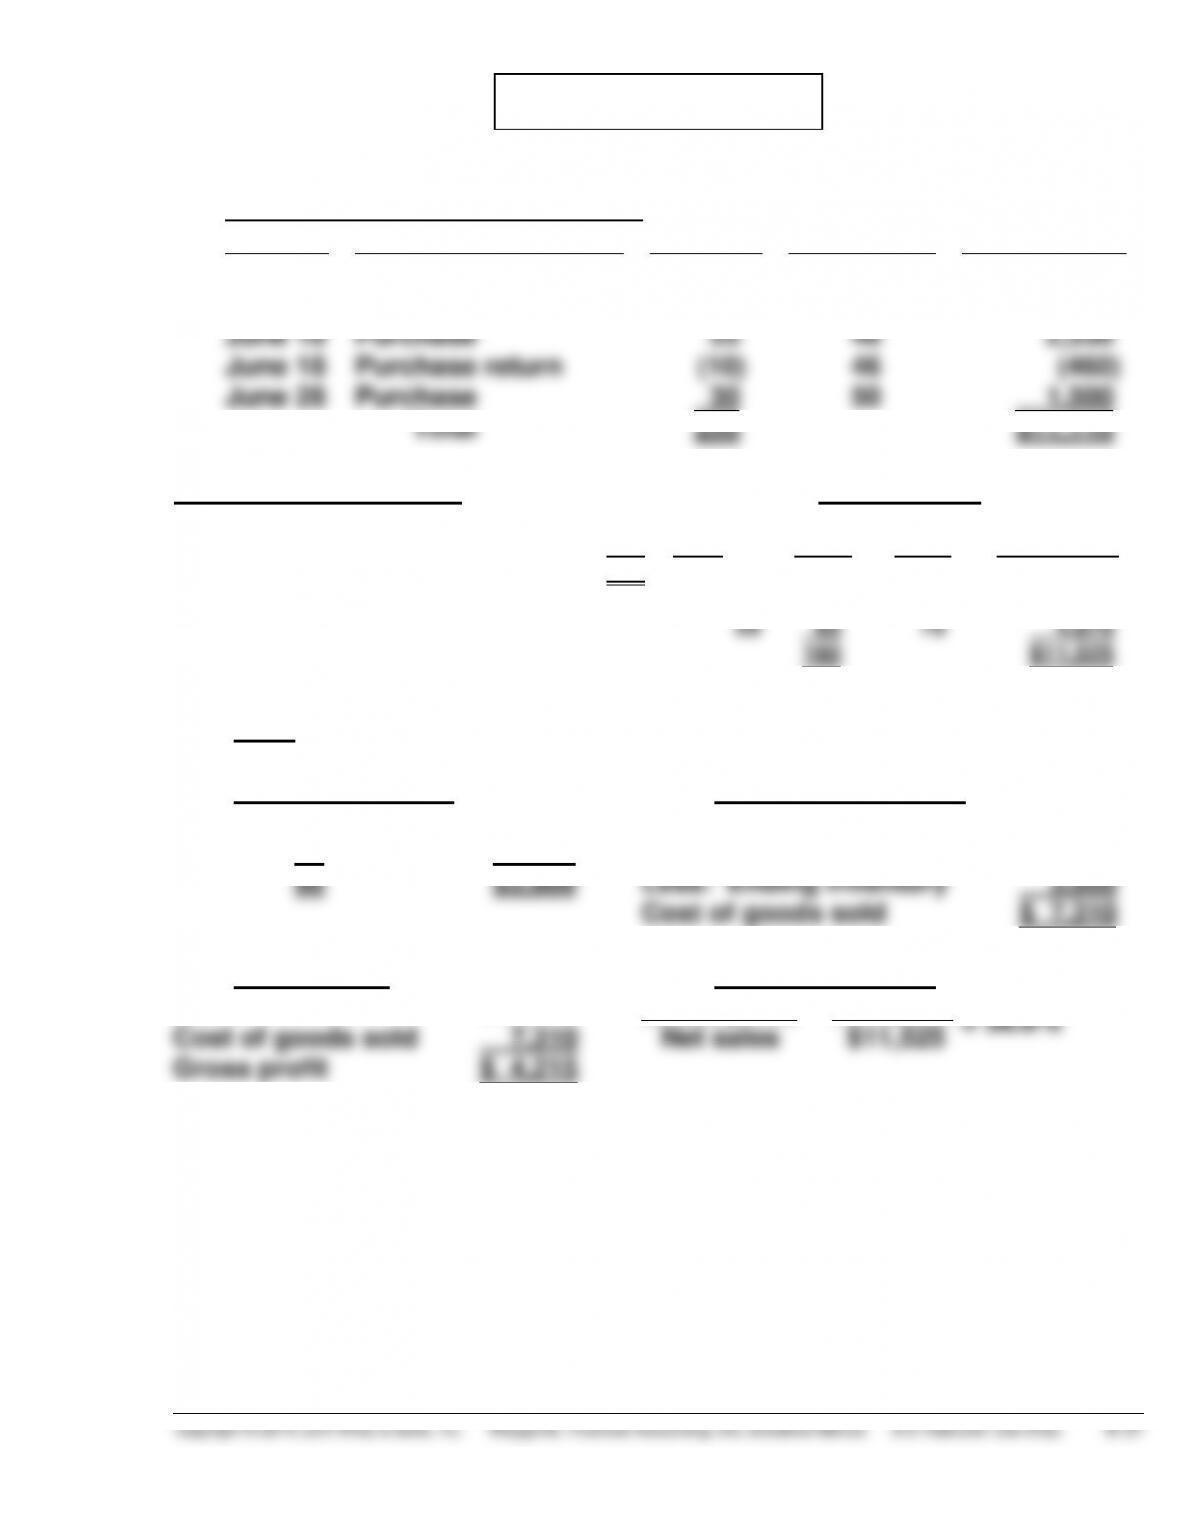
PROBLEM 6-5A
(a)
Cost of Goods Available for Sale
Date
Explanation
Units
Unit Cost
Total Cost
June 1
Beginning Inventory
40
$40
$ 1,600
June 4
Purchase
135
44
5,940
June 18
Purchase
55
46
2,530
June 18
Purchase return
(10)
46
(460)
June 28
Purchase
30
50
1,500
Total
250
$11,110
Ending Inventory in Units:
Sales Revenue
Units available for sale
250
Unit
Sales (110 – 15 + 65)
160
Date
Units
Price
Total Sales
Units remaining in ending inventory
90
June 10
110
$70
$ 7,700
11
(15)
70
(1,050)
25
65
75
4,875
160
$11,525
(1)
LIFO
(i)
Ending Inventory
(ii)
Cost of Goods Sold
June 1
4
40 @ $40
50 @ 44
$1,600
2,200
Cost of goods available
for sale
$11,110
90
$3,800
Less: Ending inventory
3,800
Cost of goods sold
$ 7,310
(iii)
Gross Profit
(iv)
Gross Profit Rate
Sales revenue
$11,525
Gross profit
$ 4,215
=
36.6%
Cost of goods sold
7,310
Net sales
$11,525
Gross profit
$ 4,215
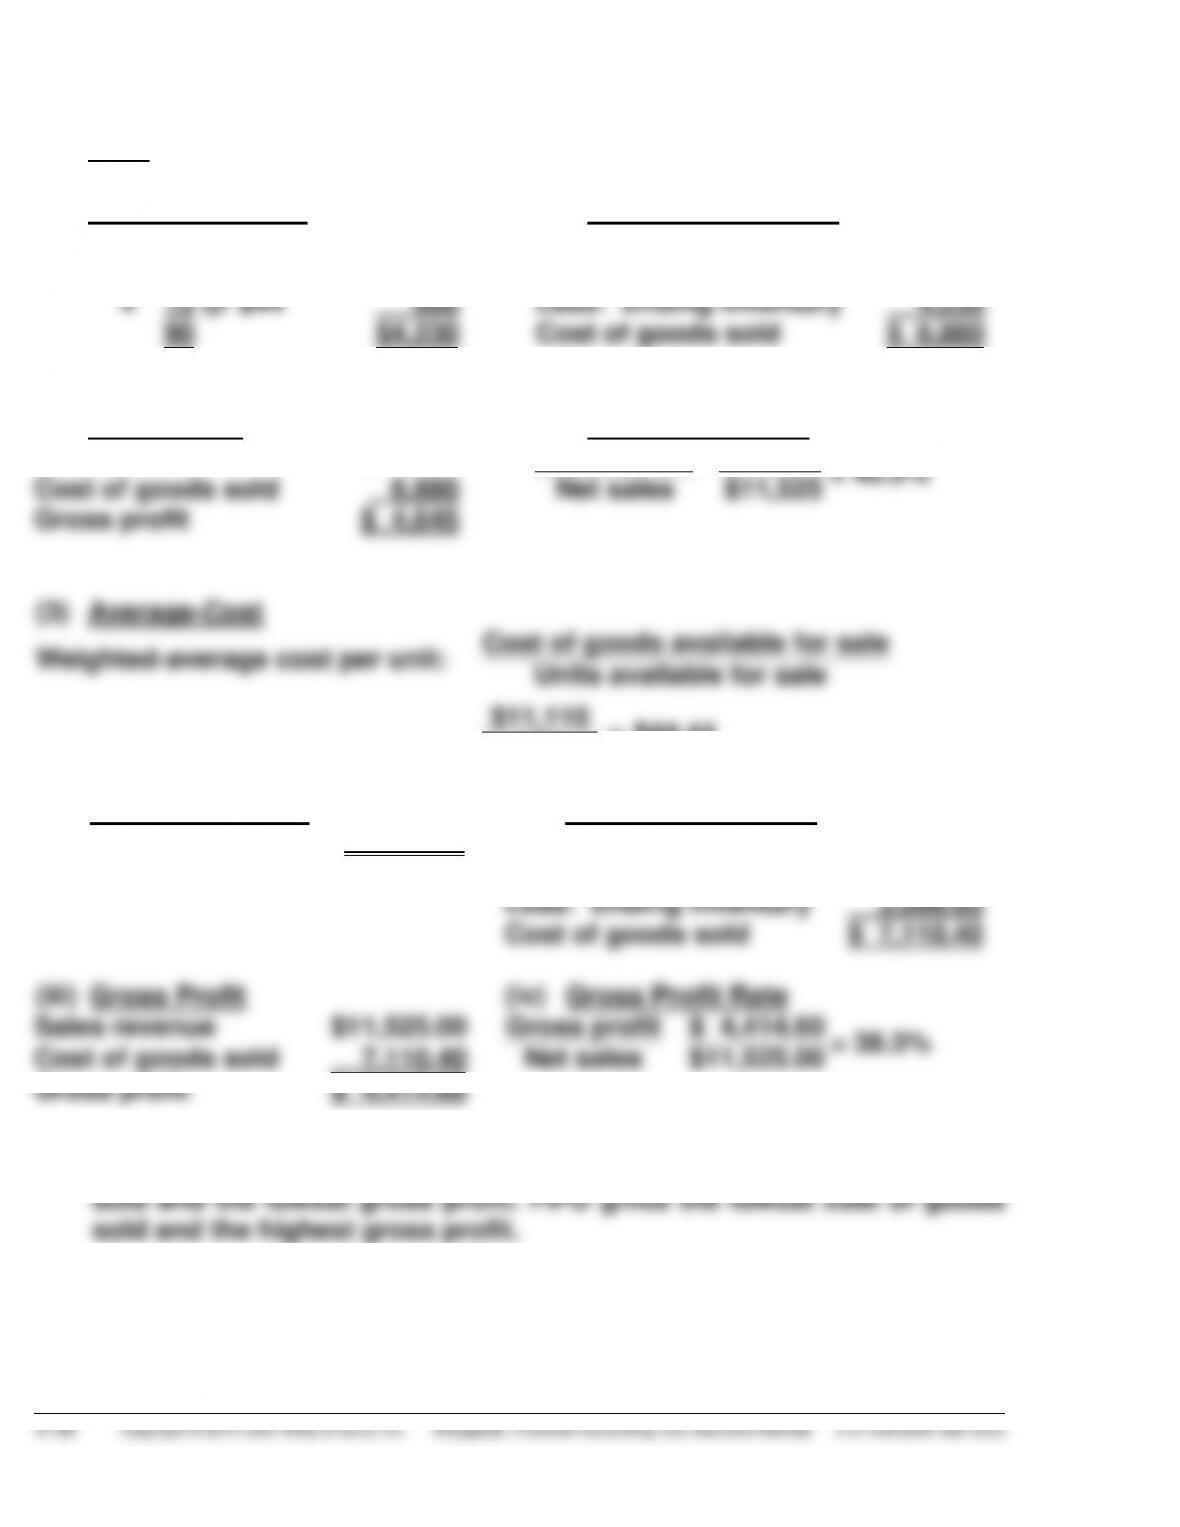
PROBLEM 6-5A (Continued)
(2)
FIFO
(i)
Ending Inventory
(ii)
Cost of Goods Sold
June 28
18
30 @ $50
45 @ $46
$1,500
2,070
Cost of goods available
for sale
$11,110
4
15 @ $44
660
Less: Ending inventory
4,230
90
$4,230
Cost of goods sold
$ 6,880
(iii)
Gross Profit
(iv)
Gross Profit Rate
Sales revenue
$11,525
Gross profit
$ 4,645
=
40.3%
Cost of goods sold
6,880
Net sales
$11,525
Gross profit
$ 4,645
(3)
Average-Cost
Weighted-average cost per unit:
Cost of goods available for sale
Units available for sale
$11,110
=
$44.44
250
(i)
Ending Inventory
(ii)
Cost of Goods Sold
90 units @$44.44
$3,999.60
Cost of goods available
for sale
$11,110.00
Less: Ending inventory
3,999.60
Cost of goods sold
$ 7,110.40
(iii)
Gross Profit
(iv)
Gross Profit Rate
Sales revenue
$11,525.00
Gross profit
$ 4,414.60
=
38.3%
Cost of goods sold
7,110.40
Net sales
$11,525.00
Gross profit
$ 4,414.60
(b) In this period of rising prices, LIFO gives the highest cost of goods
PROBLEM 6-6A
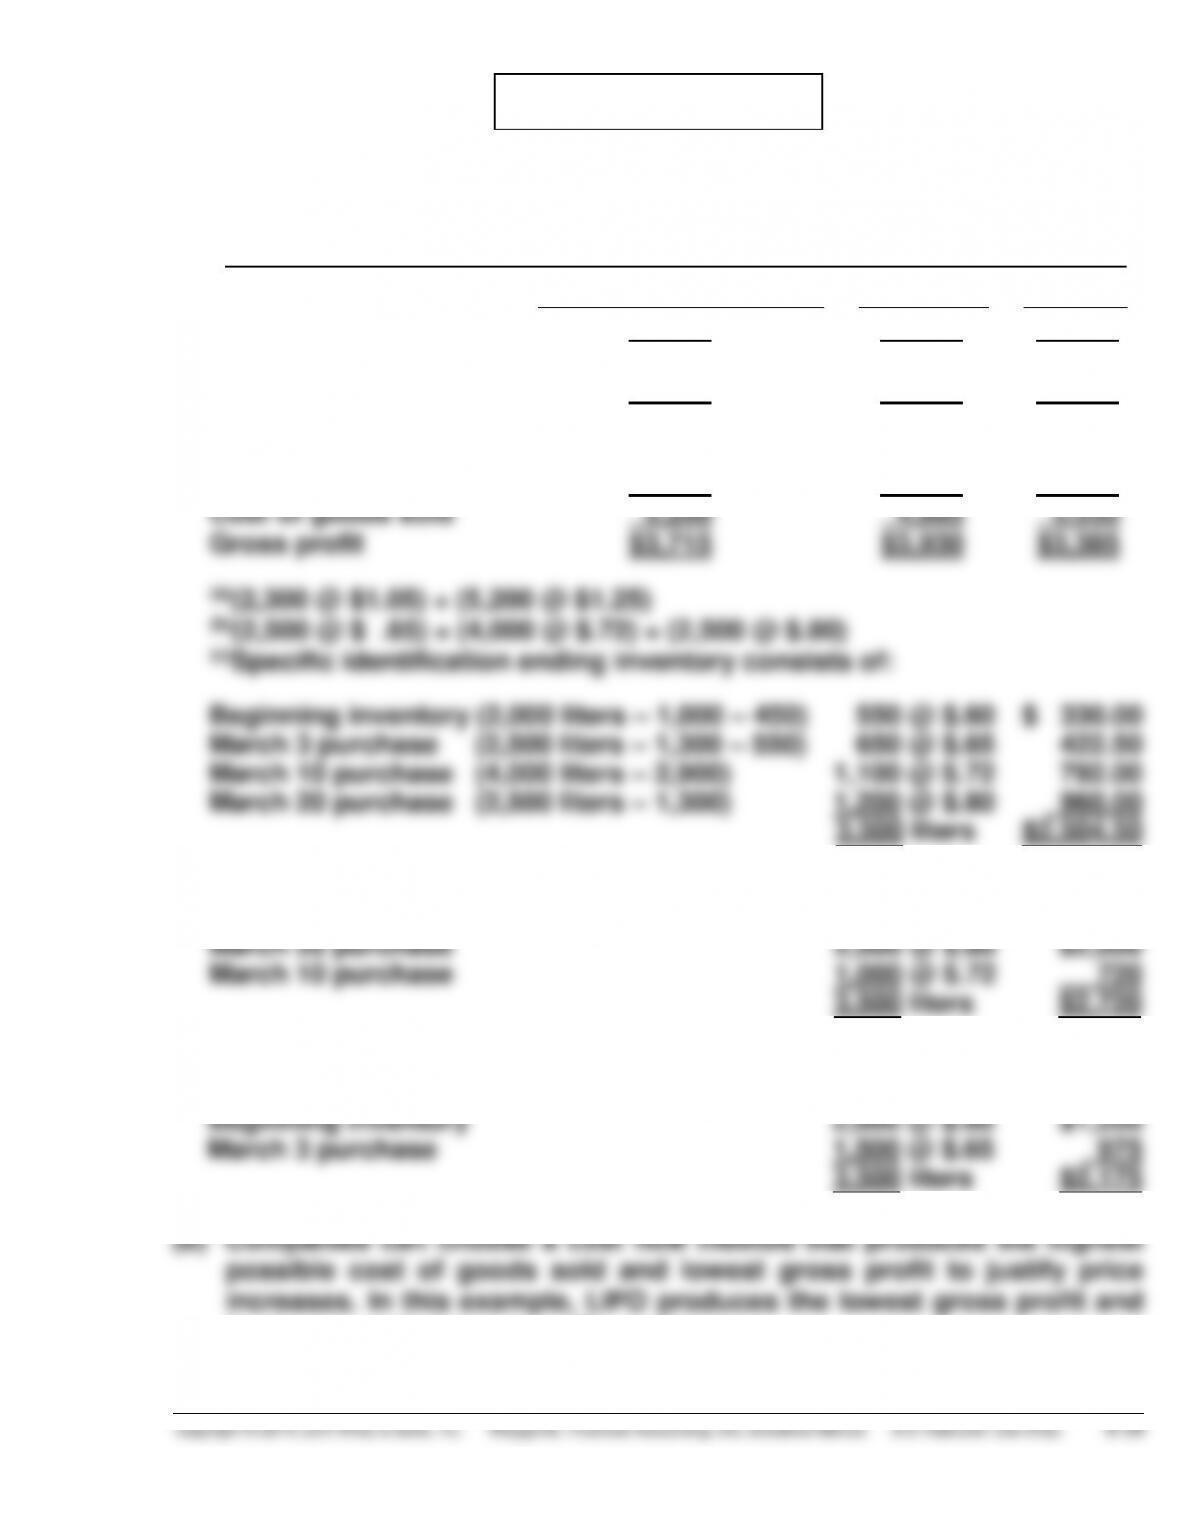
(a) BARTON INC.
Income Statement (partial)
For the Year Ended December 31, 2015
Specific Identification
FIFO
LIFO
Sales revenuea
$8,915
$8,915
$8,915
Beginning inventory
1,200
1,200
1,200
Purchasesb
6,505
6,505
6,505
Cost of goods available
for sale
7,705
7,705
7,705
Ending inventoryc
2,505
2,720
2,175
Cost of goods sold
5,200
4,985
5,530
Gross profit
$3,715
$3,930
$3,385
(a)(2,300 @ $1.05) + (5,200 @ $1.25)
(b)(2,500 @ $ .65) + (4,000 @ $.72) + (2,500 @ $.80)
(c)Specific identification ending inventory consists of:
Beginning inventory (2,000 liters – 1,000 – 450)
550 @ $.60
$ 330.00
March 3 purchase (2,500 liters – 1,300 – 550)
650 @ $.65
422.50
March 10 purchase (4,000 liters – 2,900)
1,100 @ $.72
792.00
March 20 purchase (2,500 liters – 1,300)
1,200 @ $.80
960.00
3,500 liters
$2,504.50
FIFO ending inventory consists of:
March 20 purchase
2,500 @ $.80
$2,000
March 10 purchase
1,000 @ $.72
720
3,500 liters
$2,720
LIFO ending inventory consists of:
Beginning inventory
2,000 @ $.60
$1,200
March 3 purchase
1,500 @ $.65
975
3,500 liters
$2,175
best support to increase selling prices.
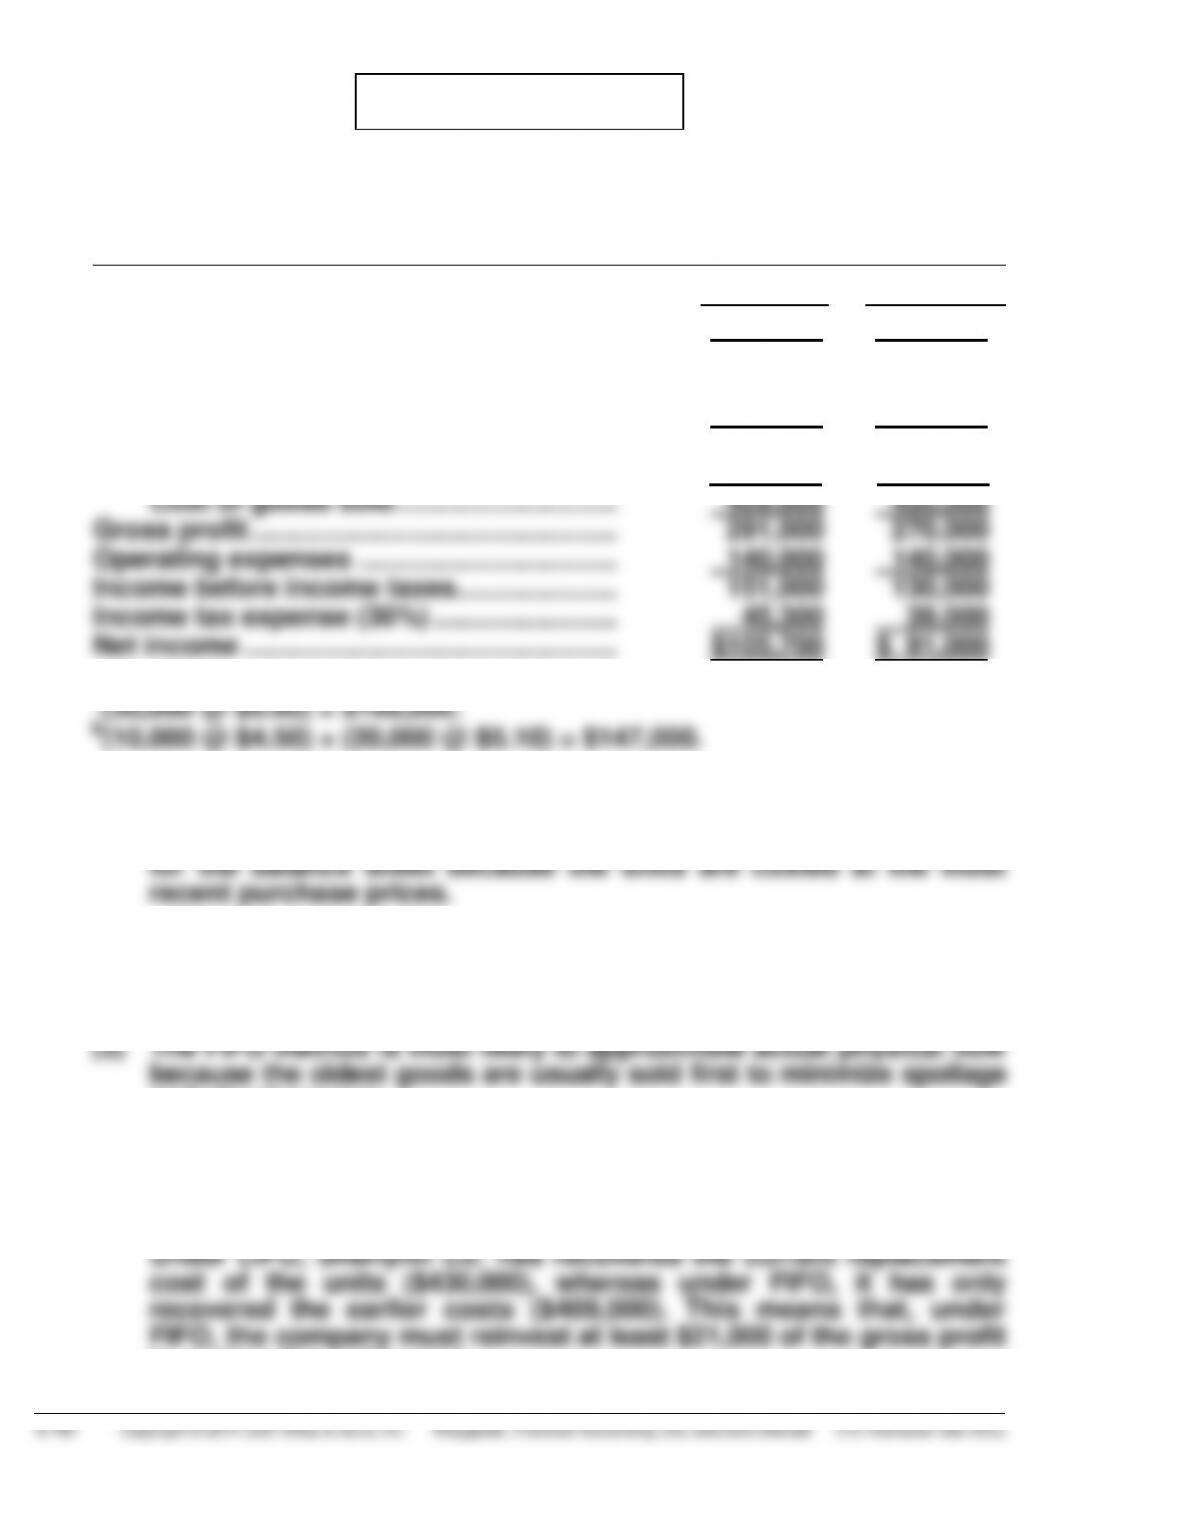
PROBLEM 6-7A
(a) Sherlynn CO.
Condensed Income Statement
For the Year Ended December 31, 2015
FIFO
LIFO
Sales revenue …………………………………….. $700,000 $700,000
Cost of goods sold
Beginning inventory ……………………… 45,000 45,000
Cost of goods purchased ……………… 532,000 532,000
Cost of goods available for sale …….. 577,000 577,000
Ending inventory ………………………….. 168,000a 147,000b
(b) Answers to questions:
(1) The FIFO method produces the most meaningful inventory amount
(2) The LIFO method produces the most meaningful net income
because the costs of the most recent purchases are matched
against sales.
and obsolescence.
(4) There will be $6,300 additional cash available under LIFO because
income taxes are $39,000 under LIFO and $45,300 under FIFO.
(5) The illusionary gross profit is $21,000 or ($291,000 – $270,000).
to replace the units used.