EXERCISE 6-8
(a)
Cost of Goods
Available for Sale
$5,500
÷
Total Units
Available for Sale
900
=
Weighted Average
Unit Cost
$6.11
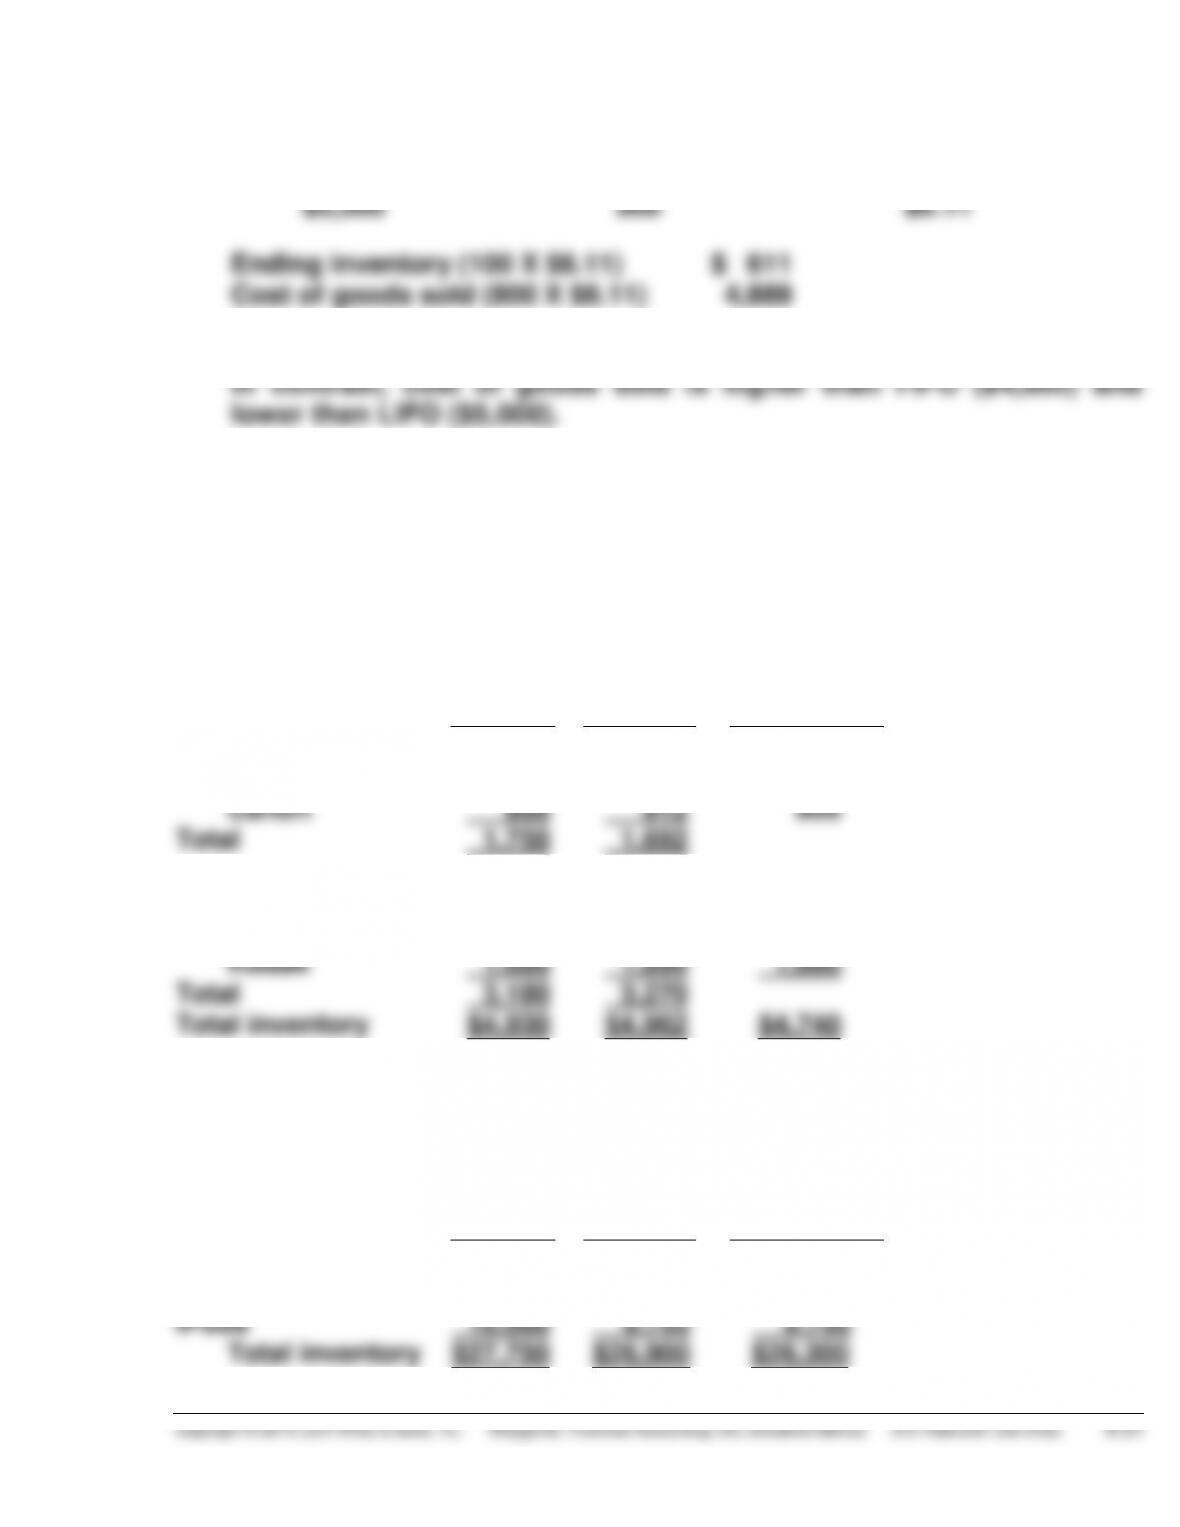
Ending inventory (100 X $6.11) $ 611
Cost of goods sold (800 X $6.11) 4,889
(b) Ending inventory is lower than FIFO ($700) and higher than LIFO ($500).
(c) The average-cost method uses a weighted-average unit cost, not a simple
average of unit costs.
EXERCISE 6-9
Cost
Market
Lower
–of-Cost
–or-Market:
Cameras
Minolta
$ 850
$ 780
$ 780
Canon
900
912
900
Total
1,750
1,692
Light meters
Vivitar
1,500
1,380
1,380
Kodak
1,680
1,890
1,680
Total
3,180
3,270
Total inventory
$4,930
$4,962
$4,740
EXERCISE 6-10
Cost
Market
Lower
–of-Cost-
or-Market:
Cameras
$ 6,500
$ 7,100
$ 6,500
DVD players
11,250
10,050
10,050
iPods
10,000
9,750
9,750
Total inventory
$27,750
$26,900
$26,300
EXERCISE 6-11
2014
2015
Beginning inventory …………………………………….. $ 20,000 $ 27,000
Cost of goods purchased …………………………….. 150,000 175,000
a$30,000 – $3,000 = $27,000. b$35,000 + $6,000 = $41,000.
EXERCISE 6-12
(a)
2014
2015
Sales revenue ………………………………………….. $220,000 $250,000
Cost of goods sold
Beginning inventory …………………………... 32,000 38,000
Cost of goods purchased …………………… 173,000 202,000
shown below:
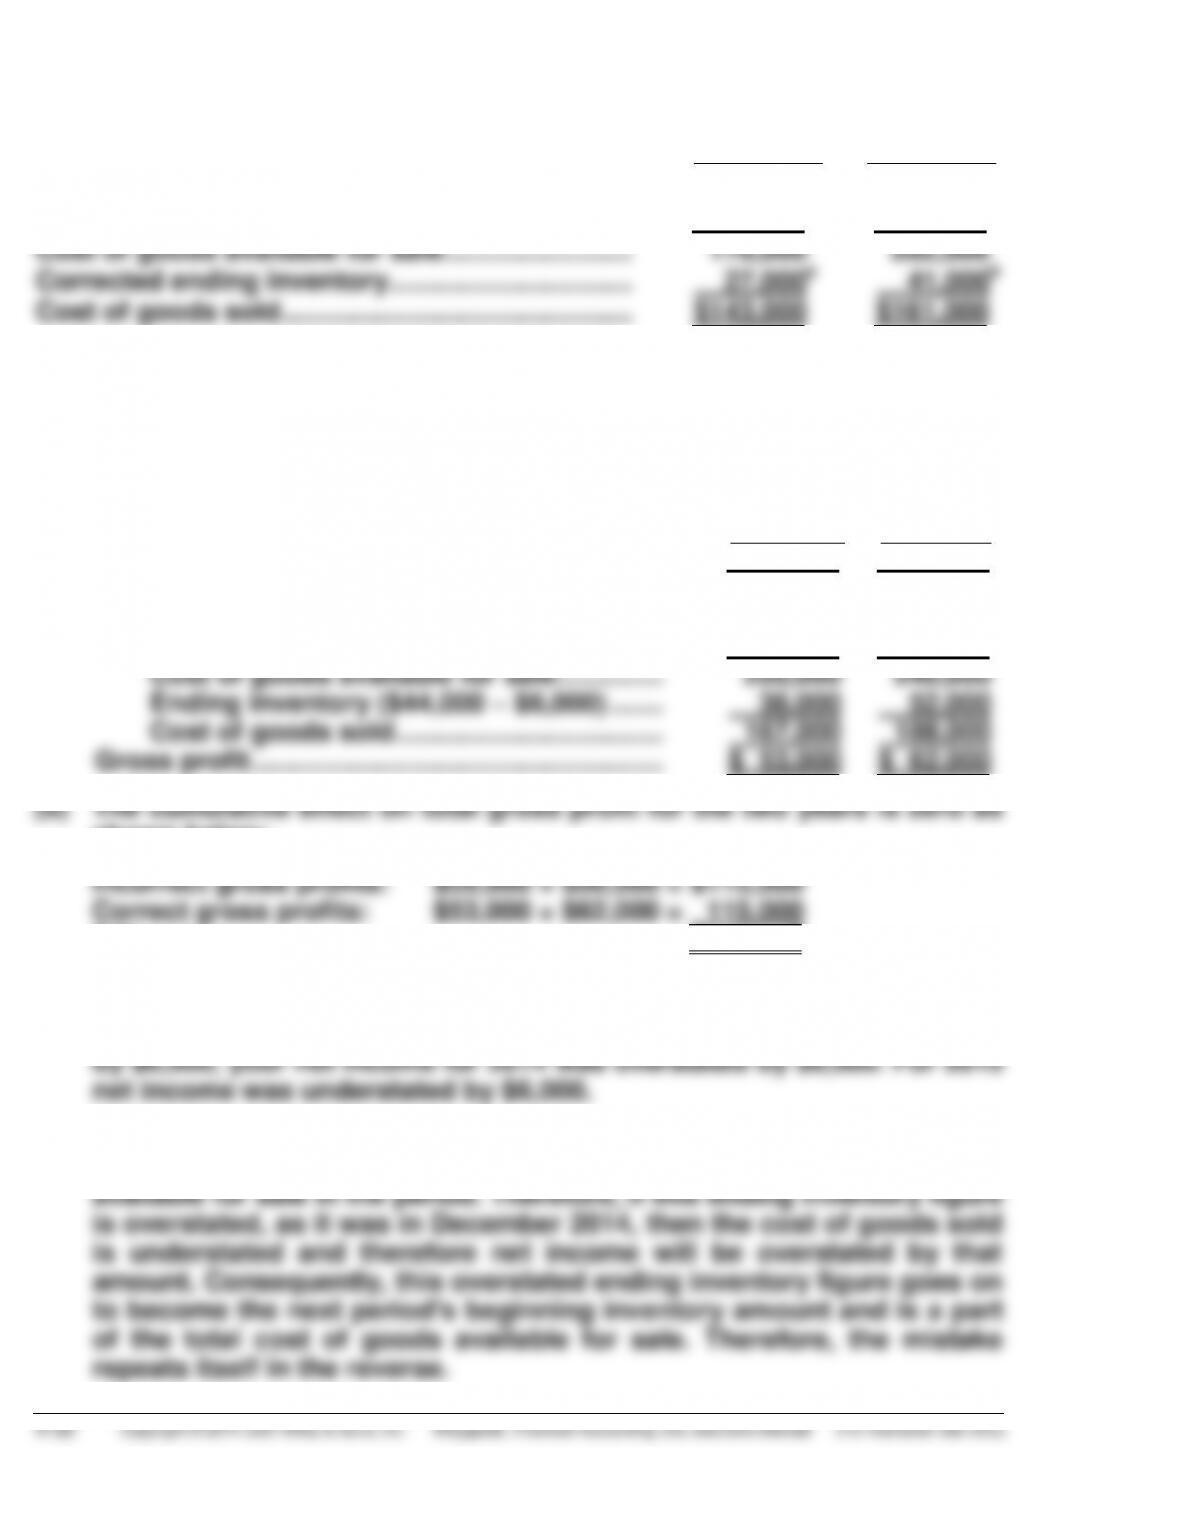
Difference $ 0
(c) Dear Mr./Ms. President:
Because your ending inventory of December 31, 2014 was overstated
In a periodic system, the cost of goods sold is calculated by deducting
the cost of ending inventory from the total cost of goods you have
EXERCISE 6-12 (Continued)
The error also affects the balance sheet at the end of 2014. The inven-
tory reported in the balance sheet is overstated; therefore, total assets
are overstated. The overstatement of the 2014 net income results in the
EXERCISE 6-13
2013
2014
2015
Inventory
turnover
$900,000
$1,120,000
$1,300,000
($100,000 + $300,000) ÷ 2
($300,000 + $400,000) ÷ 2
($400,000 + $480,000) ÷ 2
$900,000
= 4.5
$1,120,000
= 3.2
$1,300,000
= 2.95
$200,000
$350,000
$440,000
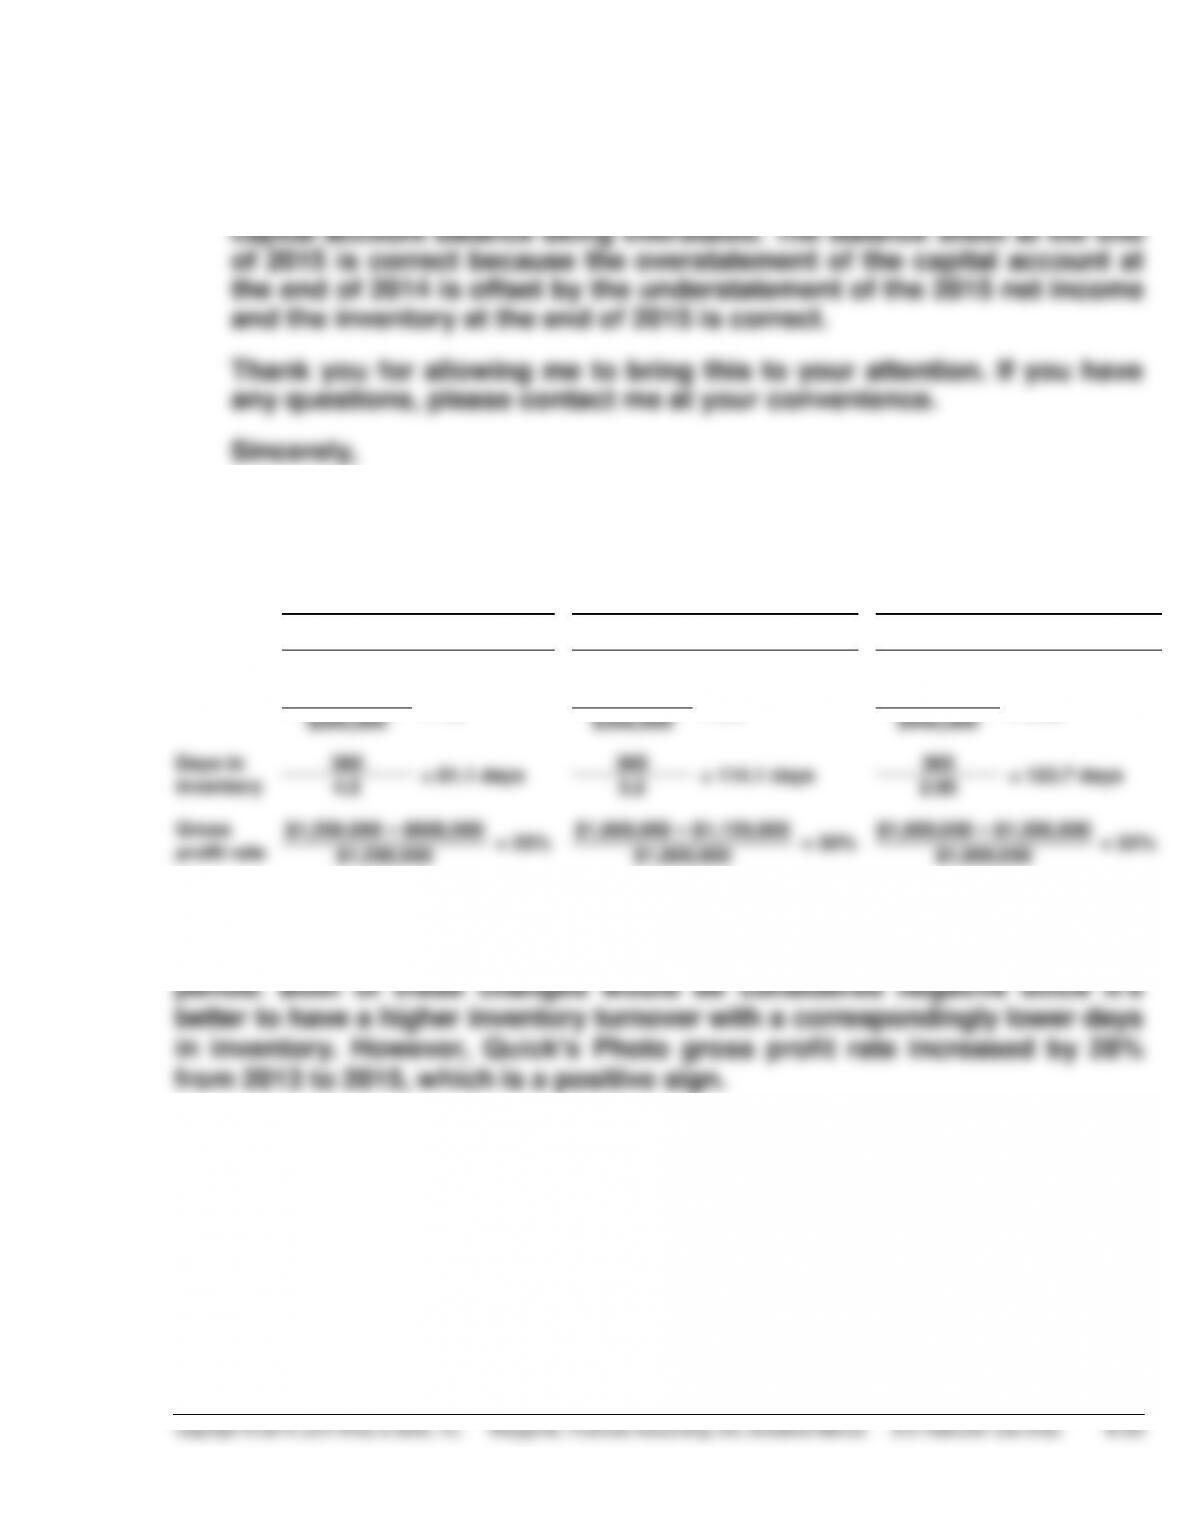
Days in
inventory
365
= 81.1 days
365
= 114.1 days
365
= 123.7 days
4.5
3.2
2.95
Gross
profit rate
$1,200,000 – $900,000
= 25%
$1,600,000 – $1,120,000
= 30%
$1,900,000 – $1,300,000
= 32%
$1,200,000
$1,600,000
$1,900,000
The inventory turnover decreased by approximately 34% from 2013 to 2015
while the days in inventory increased by almost 53% over the same time
EXERCISE 6-14
(a)
Alpha Company
Omega Company
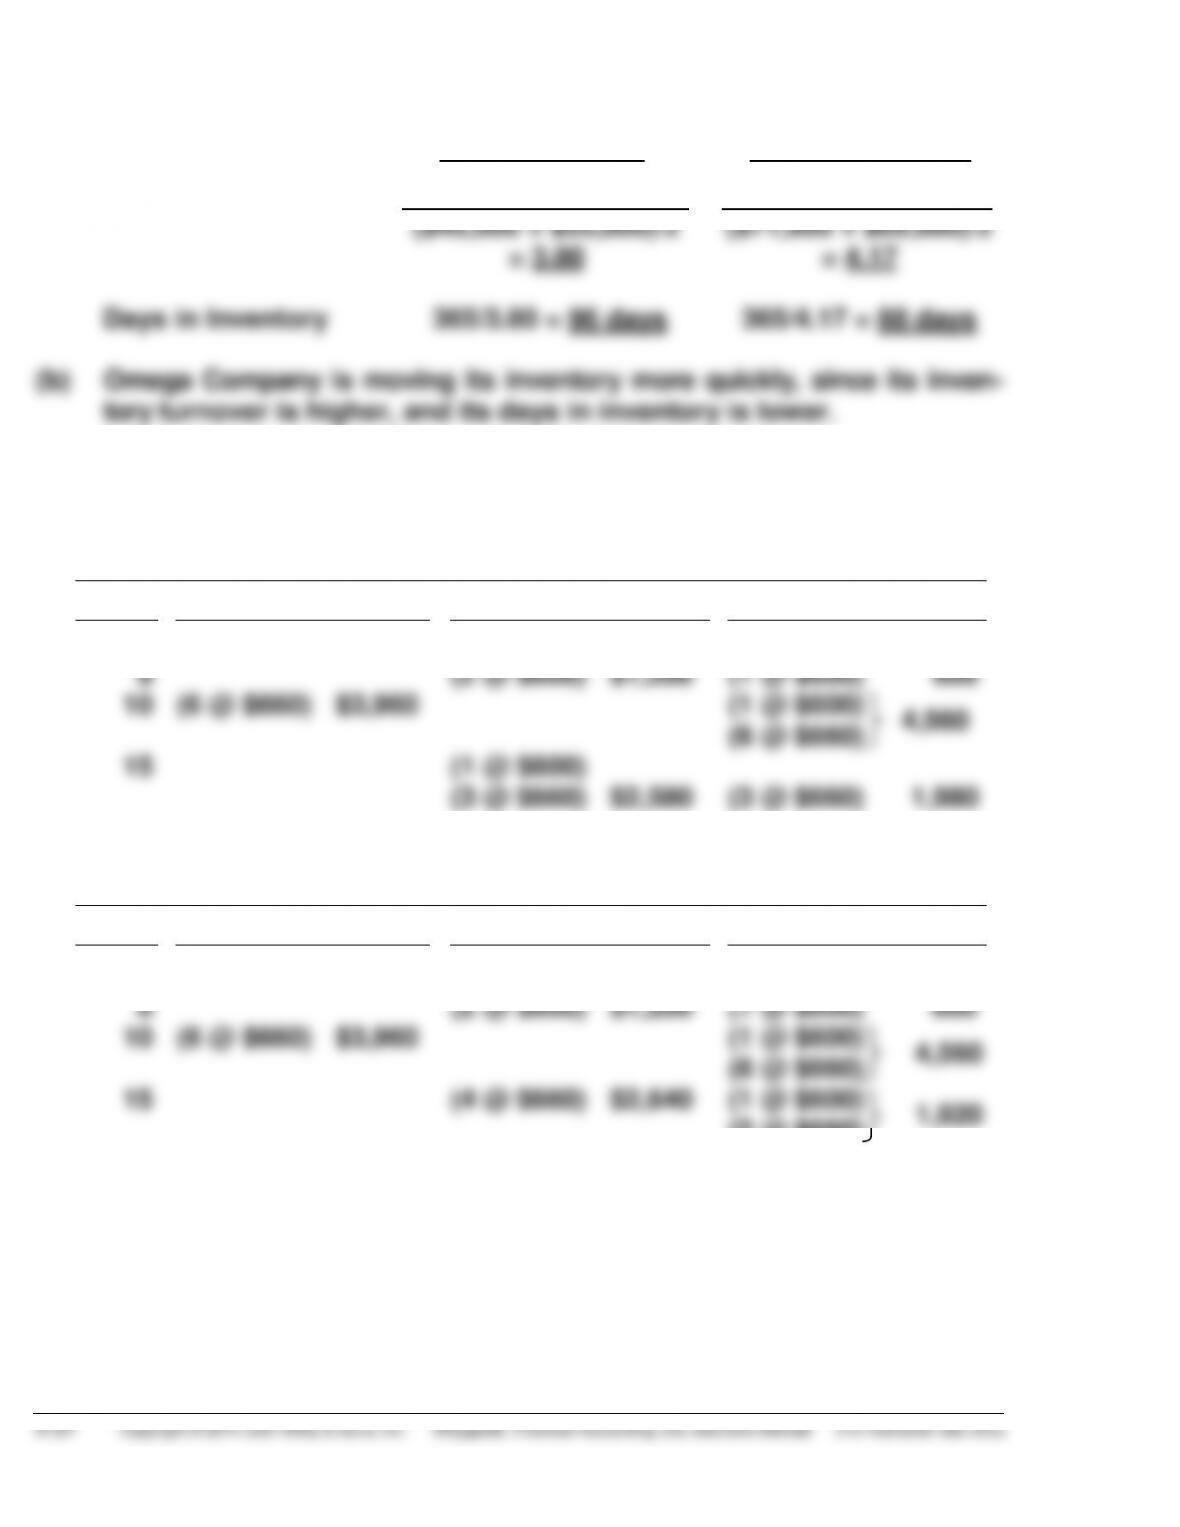
Inventory Turnover
$190,000
$292,000
($45,000 + $55,000)/2
= 3.80
($71,000 + $69,000)/2
= 4.17
Days in Inventory
365/3.80 = 96 days
365/4.17 = 88 days
(b) Omega Company is moving its inventory more quickly, since its inven-
tory turnover is higher, and its days in inventory is lower.
*EXERCISE 6-15
(1)
FIFO
Date
Purchases
Cost of Goods Sold
Balance
Jan. 1
(3 @ $600)
$1,800
8
(2 @ $600) $1,200
(1 @ $600)
600
10
(6 @ $660) $3,960
(1 @ $600)
4,560
(6 @ $660)
15
(1 @ $600)
(3 @ $660) $2,580
(3 @ $660)
1,980
(2)
LIFO
Date
Purchases
Cost of Goods Sold
Balance
Jan. 1
(3 @ $600)
$1,800
8
(2 @ $600) $1,200
(1 @ $600)
600
10
(6 @ $660) $3,960
(1 @ $600)
4,560
(6 @ $660)
15
(4 @ $660) $2,640
(1 @ $600)
1,920
(2 @ $660)
*EXERCISE 6-15 (Continued)
(3)
MOVING-AVERAGE COST
Date
Purchases
Cost of Goods Sold
Balance
Jan. 1
(3 @ $600) $1,800
8
(2 @ $600) $1,200
(1 @ $600) 600
10
(6 @ $660) $3,960
(7 @ $651.43)* 4,560
15
(4 @ $651.43) $2,606
(3 @ $651.43) 1,954
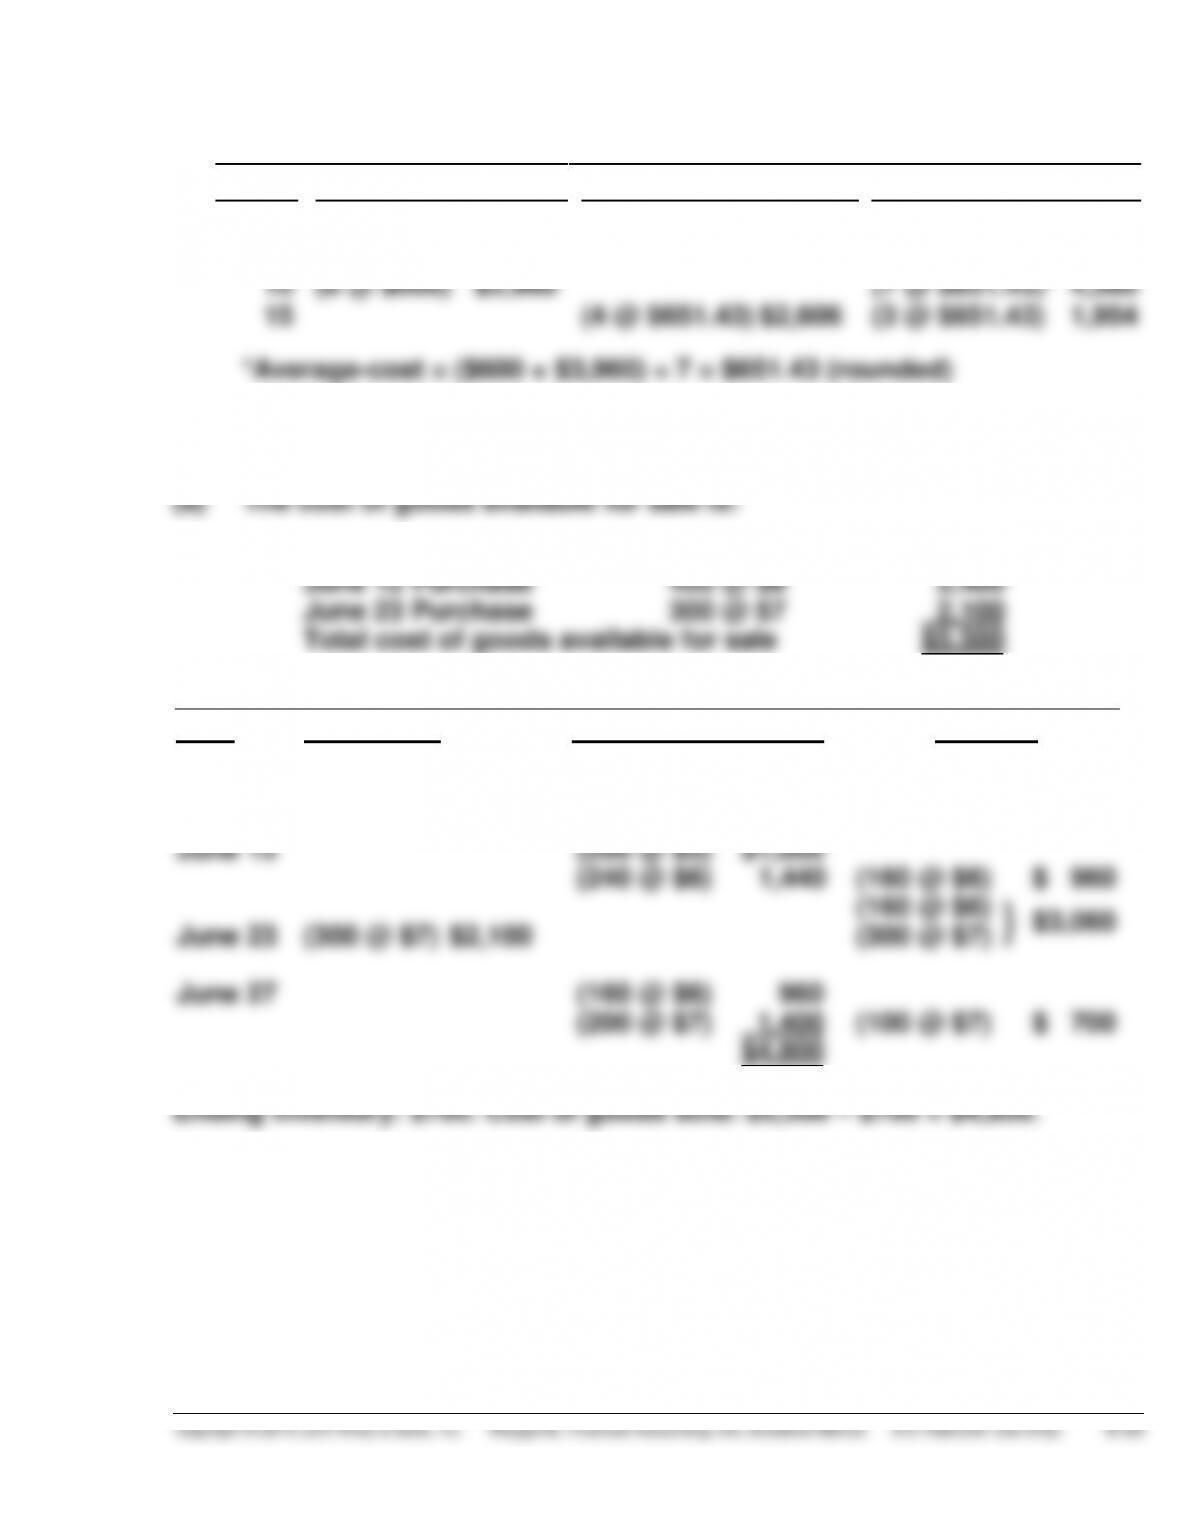
*EXERCISE 6-16
June 1 Inventory
200 @ $5
$1,000
June 12 Purchase
400 @ $6
2,400
June 23 Purchase
300 @ $7
2,100
Total cost of goods available for sale
$5,500
FIFO
Date
Purchases
Cost of Goods Sold
Balance
June 1
(200 @ $5)
$1,000
June 12
(400 @ $6) $2,400
(200 @ $5)
}
$3,400
(400 @ $6)
June 15
(200 @ $5)
$1,000
(240 @ $6)
1,440
(160 @ $6)
$ 960
(160 @ $6)
}
$3,060
June 23
(300 @ $7) $2,100
(300 @ $7)
June 27
(160 @ $6)
960
(200 @ $7)
1,400
(100 @ $7)
$ 700
$4,800
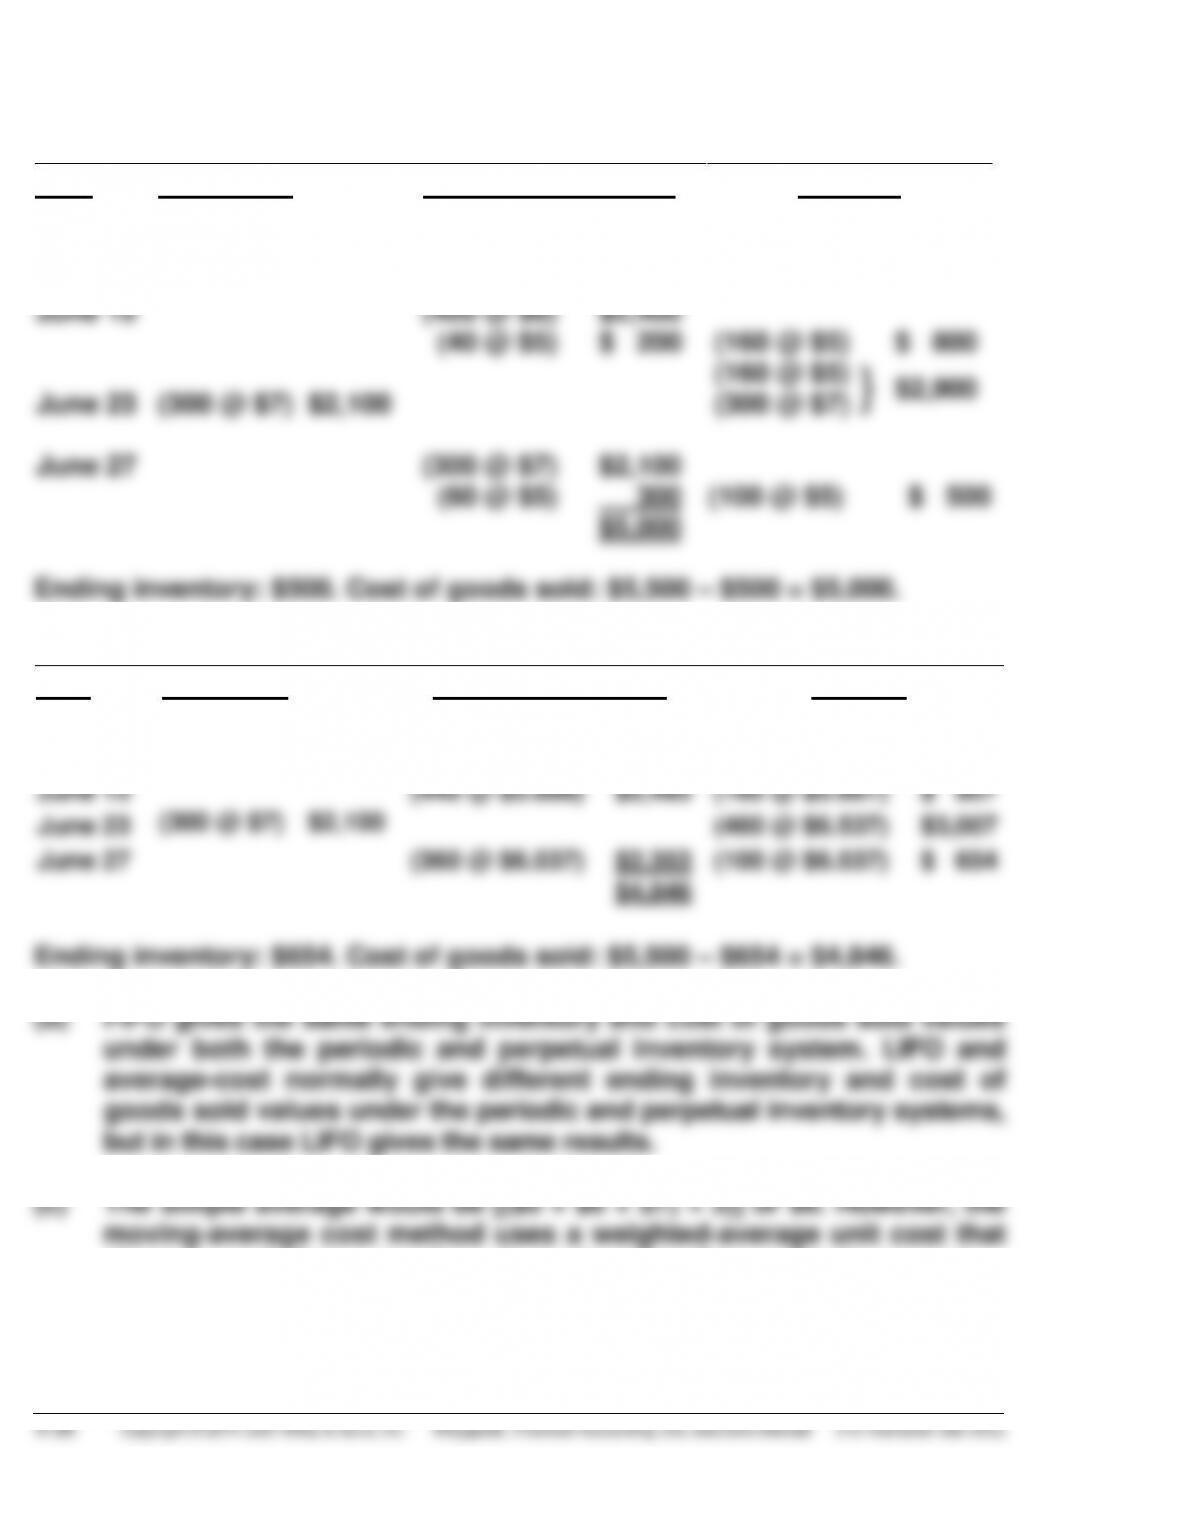
*EXERCISE 6-16 (Continued)
LIFO
Date
Purchases
Cost of Goods Sold
Balance
June 1
(200 @ $5)
$1,000
June 12
(400 @ $6) $2,400
(200 @ $5)
}
$3,400
(400 @ $6)
June 15
(400 @ $6)
$2,400
(40 @ $5)
$ 200
(160 @ $5)
$ 800
(160 @ $5)
}
$2,900
June 23
(300 @ $7) $2,100
(300 @ $7)
June 27
(300 @ $7)
$2,100
(60 @ $5)
300
$5,000
(100 @ $5)
$ 500
Ending inventory: $500. Cost of goods sold: $5,500 – $500 = $5,000.
Moving-Average Cost
Date
Purchases
Cost of Goods Sold
Balance
June 1
(200 @ $5) $1,000
June 12
(400 @ $6) $2,400
(600 @ $5.667) $3,400
June 15
(440 @ $5.666)
$2,493
(160 @ $5.667) $ 907
June 23
(300 @ $7) $2,100
(460 @ $6.537) $3,007
June 27
(360 @ $6.537)
$2,353
(100 @ $6.537) $ 654
$4,846
Ending inventory: $654. Cost of goods sold: $5,500 – $654 = $4,846.
changes each time a purchase is made rather than a simple average.
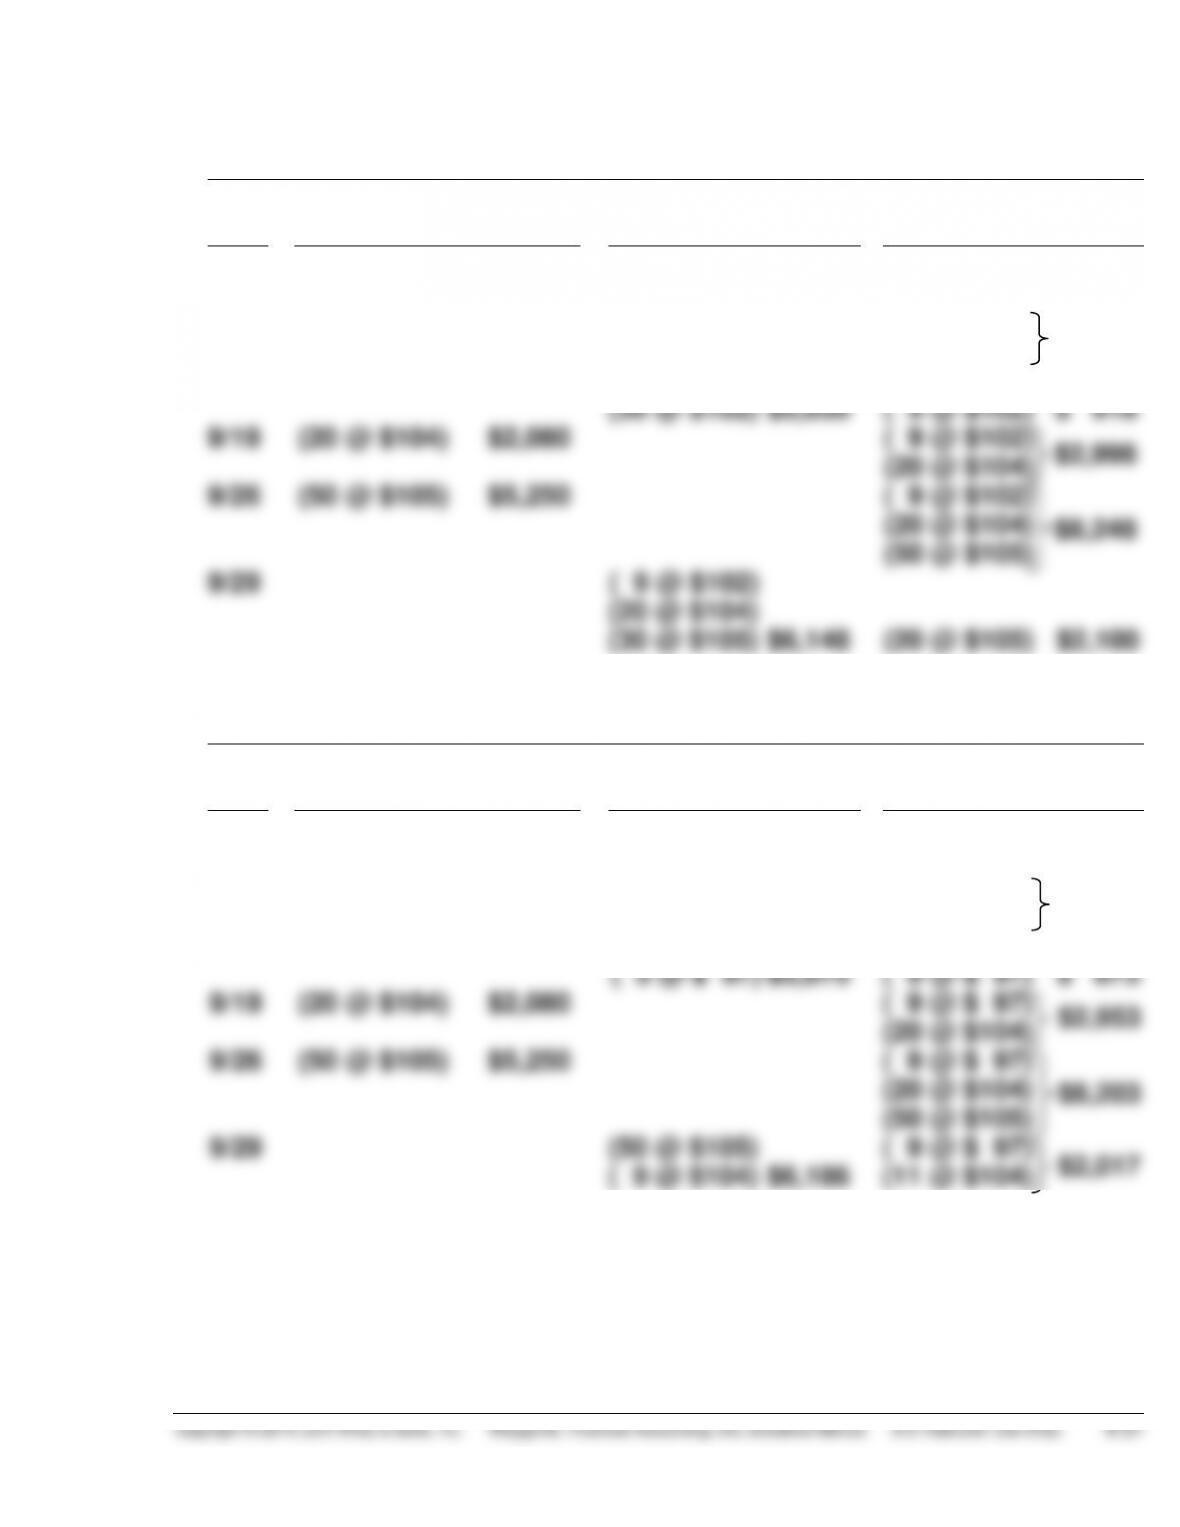
*EXERCISE 6-17
(a)
FIFO
Date
Purchases
Cost of
Goods Sold
Balance
9/1
(26 @ $ 97)
$2,522
9/5
(12 @ $ 97) $1,164
(14 @ $ 97)
$1,358
9/12
(45 @ $102) $4,590
(14 @ $ 97)
$5,948
(45 @ $102)
9/16
(14 @ $ 97)
(36 @ $102) $5,030
( 9 @ $102)
$ 918
9/19
(20 @ $104) $2,080
( 9 @ $102)
$2,998
(20 @ $104)
9/26
(50 @ $105) $5,250
( 9 @ $102)
(20 @ $104)
$8,248
(50 @ $105)
9/29
( 9 @ $102)
(20 @ $104)
(30 @ $105) $6,148
(20 @ $105) $2,100
LIFO
Date
Purchases
Cost of
Goods Sold
Balance
9/1
(26 @ $ 97)
$2,522
9/5
(12 @ $ 97) $1,164
(14 @ $ 97)
$1,358
9/12
(45 @ $102) $4,590
(14 @ $ 97)
$5,948
(45 @ $102)
9/16
(45 @ $102)
( 5 @ $ 97) $5,075
( 9 @ $ 97)
$ 873
9/19
(20 @ $104) $2,080
( 9 @ $ 97)
$2,953
(20 @ $104)
9/26
(50 @ $105) $5,250
( 9 @ $ 97)
$8,203
(20 @ $104)
(50 @ $105)
9/29
(50 @ $105)
( 9 @ $ 97)
$2,017
( 9 @ $104) $6,186
(11 @ $104)
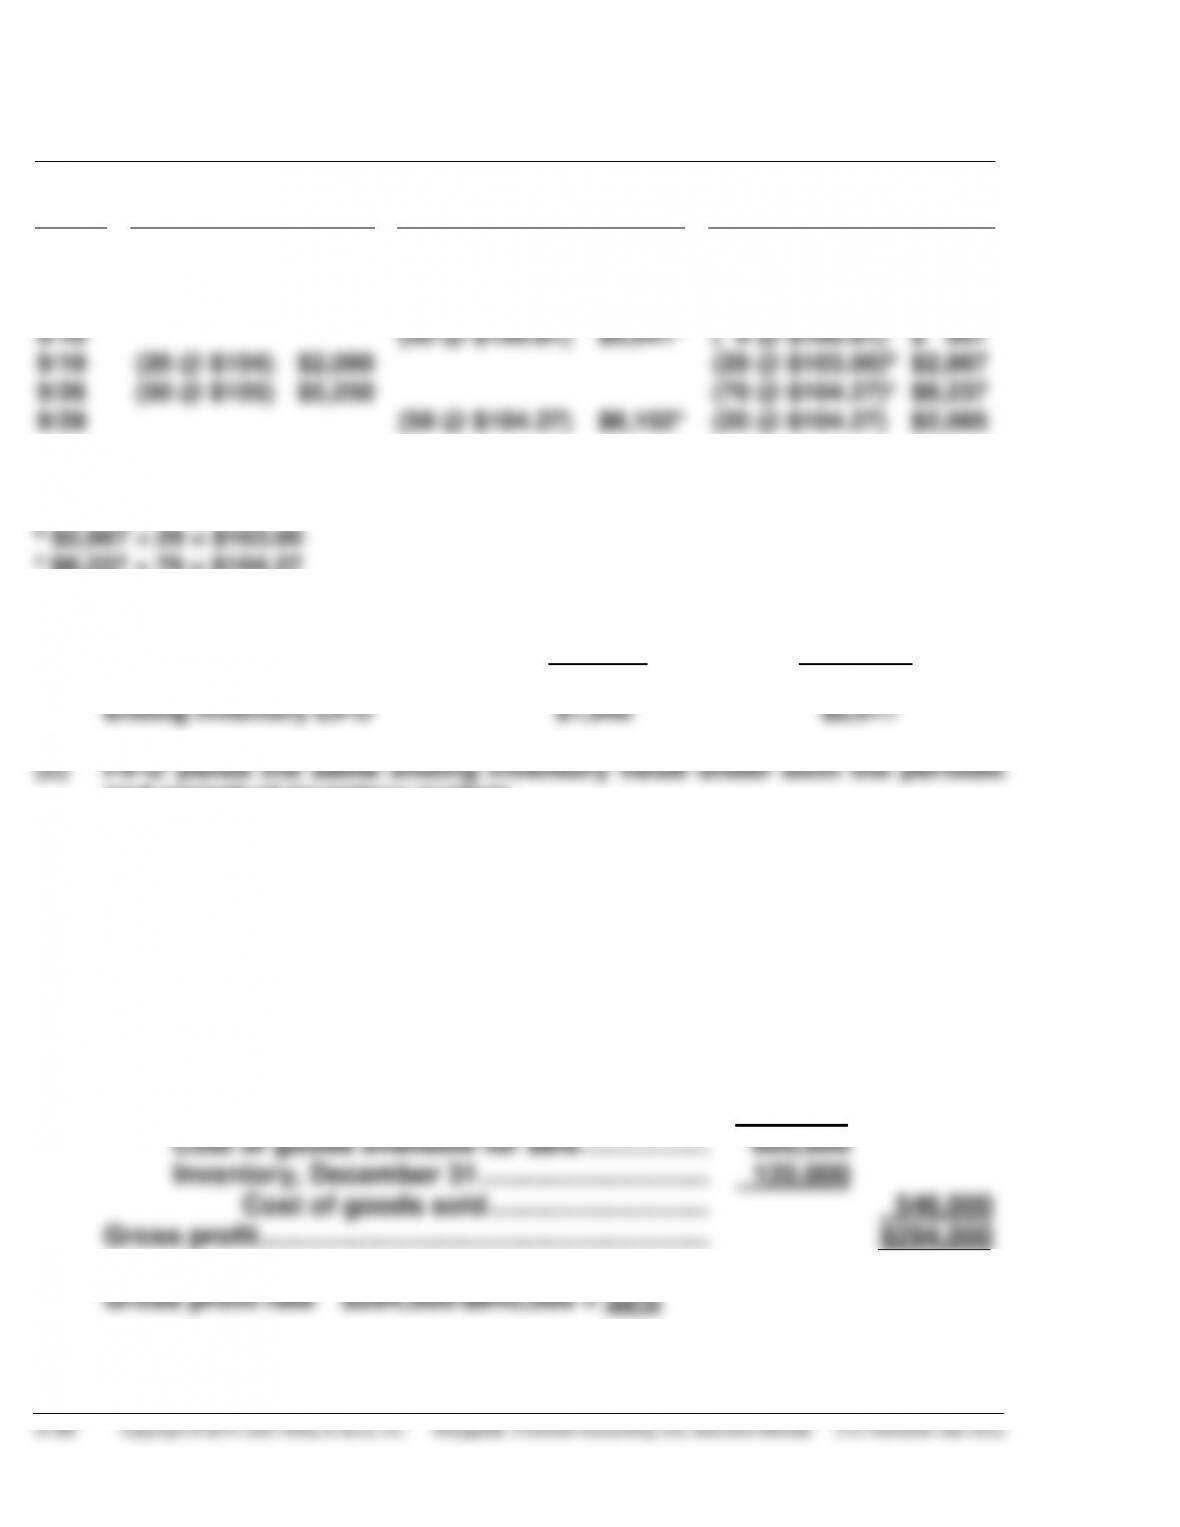
*EXERCISE 6-17 (Continued)
Moving-Average Cost
Date
Purchases
Cost of
Goods Sold
Balance
9/1
(26 @ $97) $2,522
9/5
(12 @ $97) $1,164
(14 @ $97) $1,358
9/12
(45 @ $102) $4,590
(59 @ $100.81)a $5,948
9/16
(50 @ $100.81) $5,041*
( 9 @ $100.81) $ 907
9/19
(20 @ $104) $2,080
(29 @ $103.00)b $2,987
9/26
(50 @ $105) $5,250
(79 @ $104.27)c $8,237
9/29
(59 @ $104.27) $6,152*
(20 @ $104.27) $2,085
*Rounded
a $5,948 ÷ 59 = $100.81
(b)
Periodic
Perpetual
Ending Inventory FIFO
$2,100
$2,100
Ending Inventory LIFO
$1,940
$2,017
and perpetual inventory system.
LIFO usually yields different ending inventory values when using the
periodic versus perpetual inventory system.
*EXERCISE 6-18
(a) Sales ……………………………………………………………. $840,000
Cost of goods sold
Inventory, November 1 ………………………….. $130,000
Cost of goods purchased ……………………… 536,000
*EXERCISE 6-18 (Continued)
(b) Sales revenue ……………………………………………………………… $1,000,000
Less: Estimated gross profit (35% X $1,000,000) …………… 350,000
Estimated cost of goods sold ……………………………………….. $ 650,000
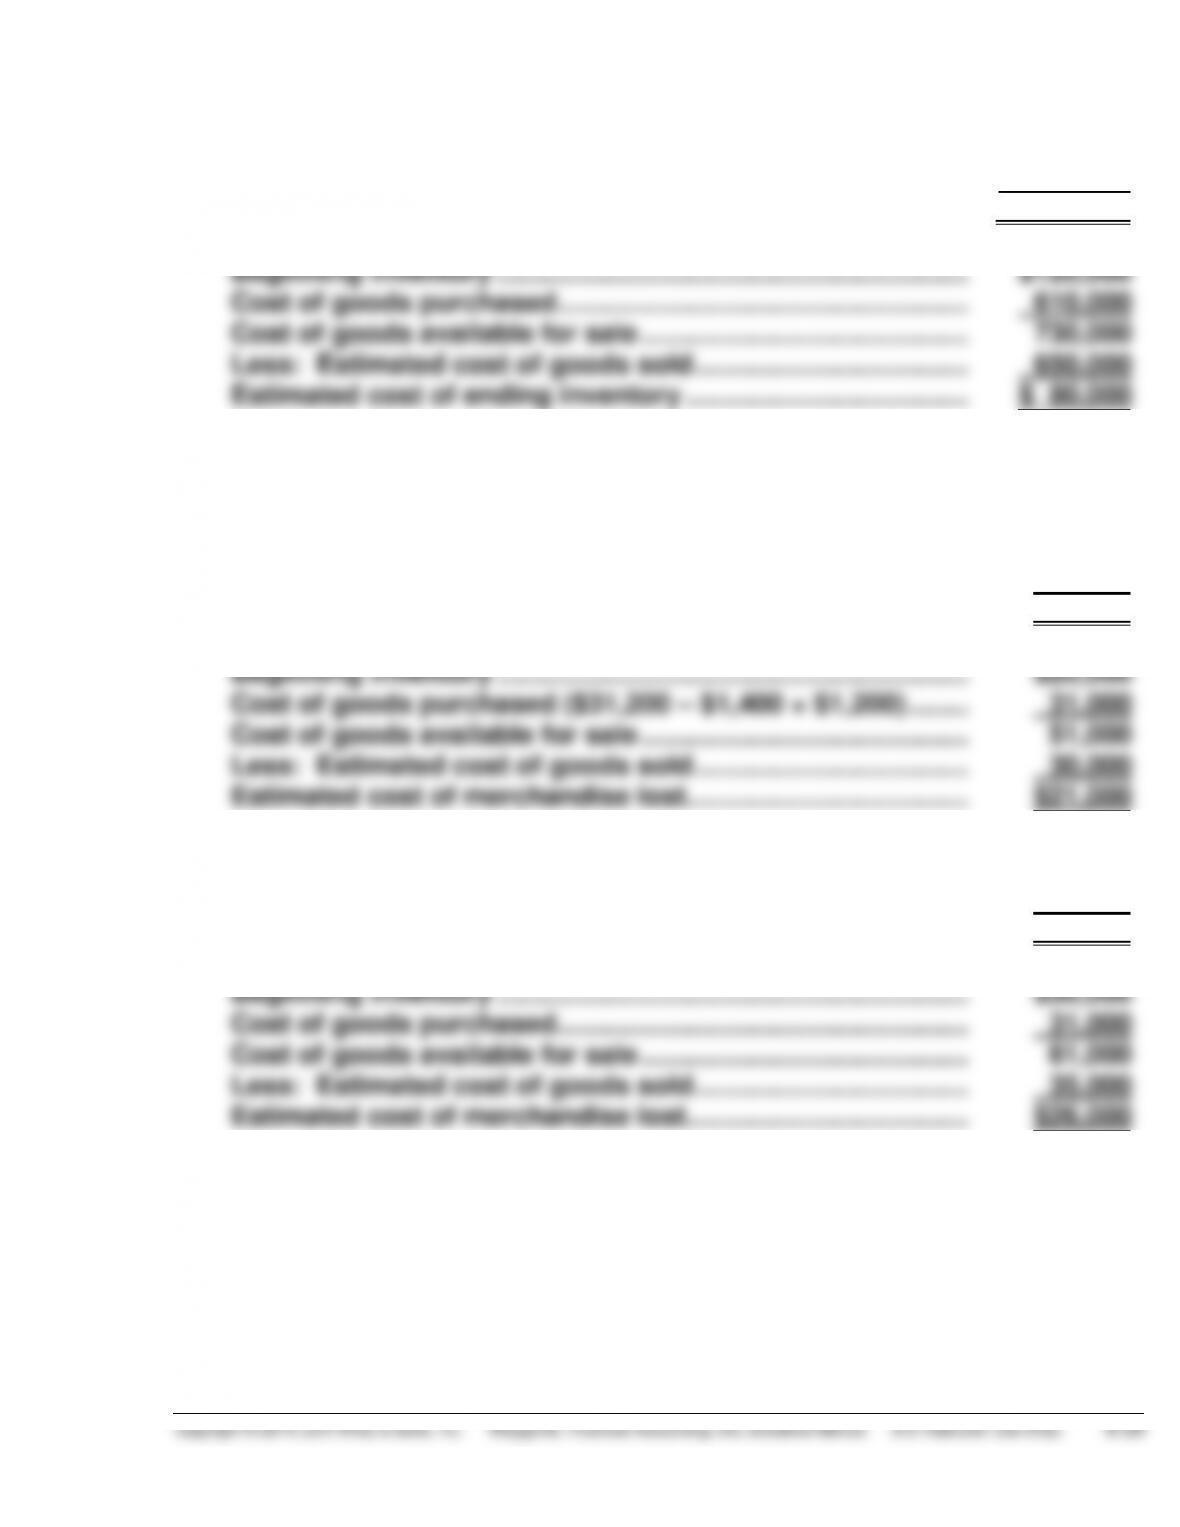
*EXERCISE 6-19
(a) Net sales ($51,000 – $1,000) ………………………………………….. $50,000
Less: Estimated gross profit (40% X $50,000) ……………….. 20,000
Estimated cost of goods sold ……………………………………….. $30,000
(b) Net sales ……………………………………………………………………… $50,000
Less: Estimated gross profit (30% X $50,000) ……………….. 15,000
Estimated cost of goods sold ……………………………………….. $35,000
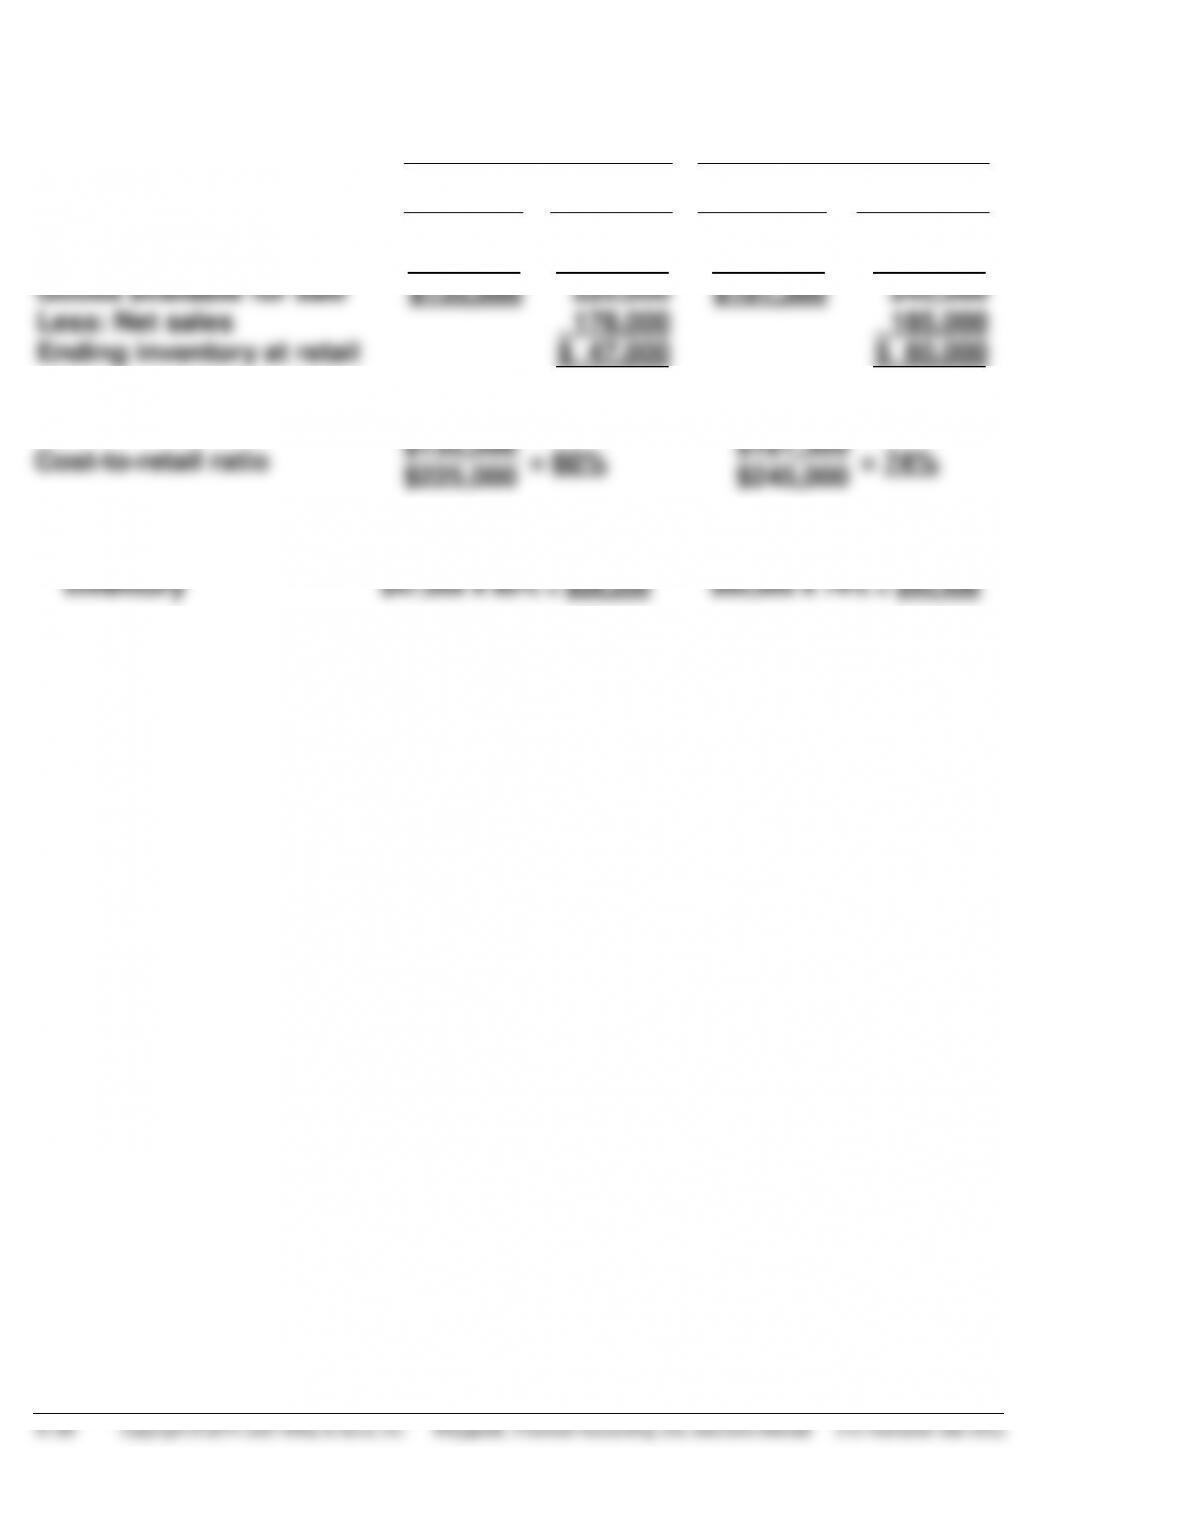
*EXERCISE 6-20
Women’s Shoes
Men’s Shoes
Cost
Retail
Cost
Retail
Beginning inventory
$ 25,000
$ 46,000
$ 45,000
$ 60,000
Goods purchased
110,000
179,000
136,300
185,000
Goods available for sale
$135,000
225,000
$181,300
245,000
Less: Net sales
178,000
185,000
Ending inventory at retail
$ 47,000
$ 60,000
Cost-to-retail ratio
$135,000
= 60%
$181,300
= 74%
$225,000
$245,000
Estimated cost of ending