Unlock document.
This document is partially blurred.
Unlock all pages and 1 million more documents.
Get Access
COMPREHENSIVE PROBLEM SOLUTION (Continued)
(c)
Dec. 31
Salaries and Wages Expense .......................
Salaries and Wages Payable ................
800
800
Depreciation Expense ................................
Accumulated Depreciation—
Equipment ...........................................
200
200
Supplies Expense .........................................
Supplies ($3,200 – $1,500) ....................
1,700
1,700
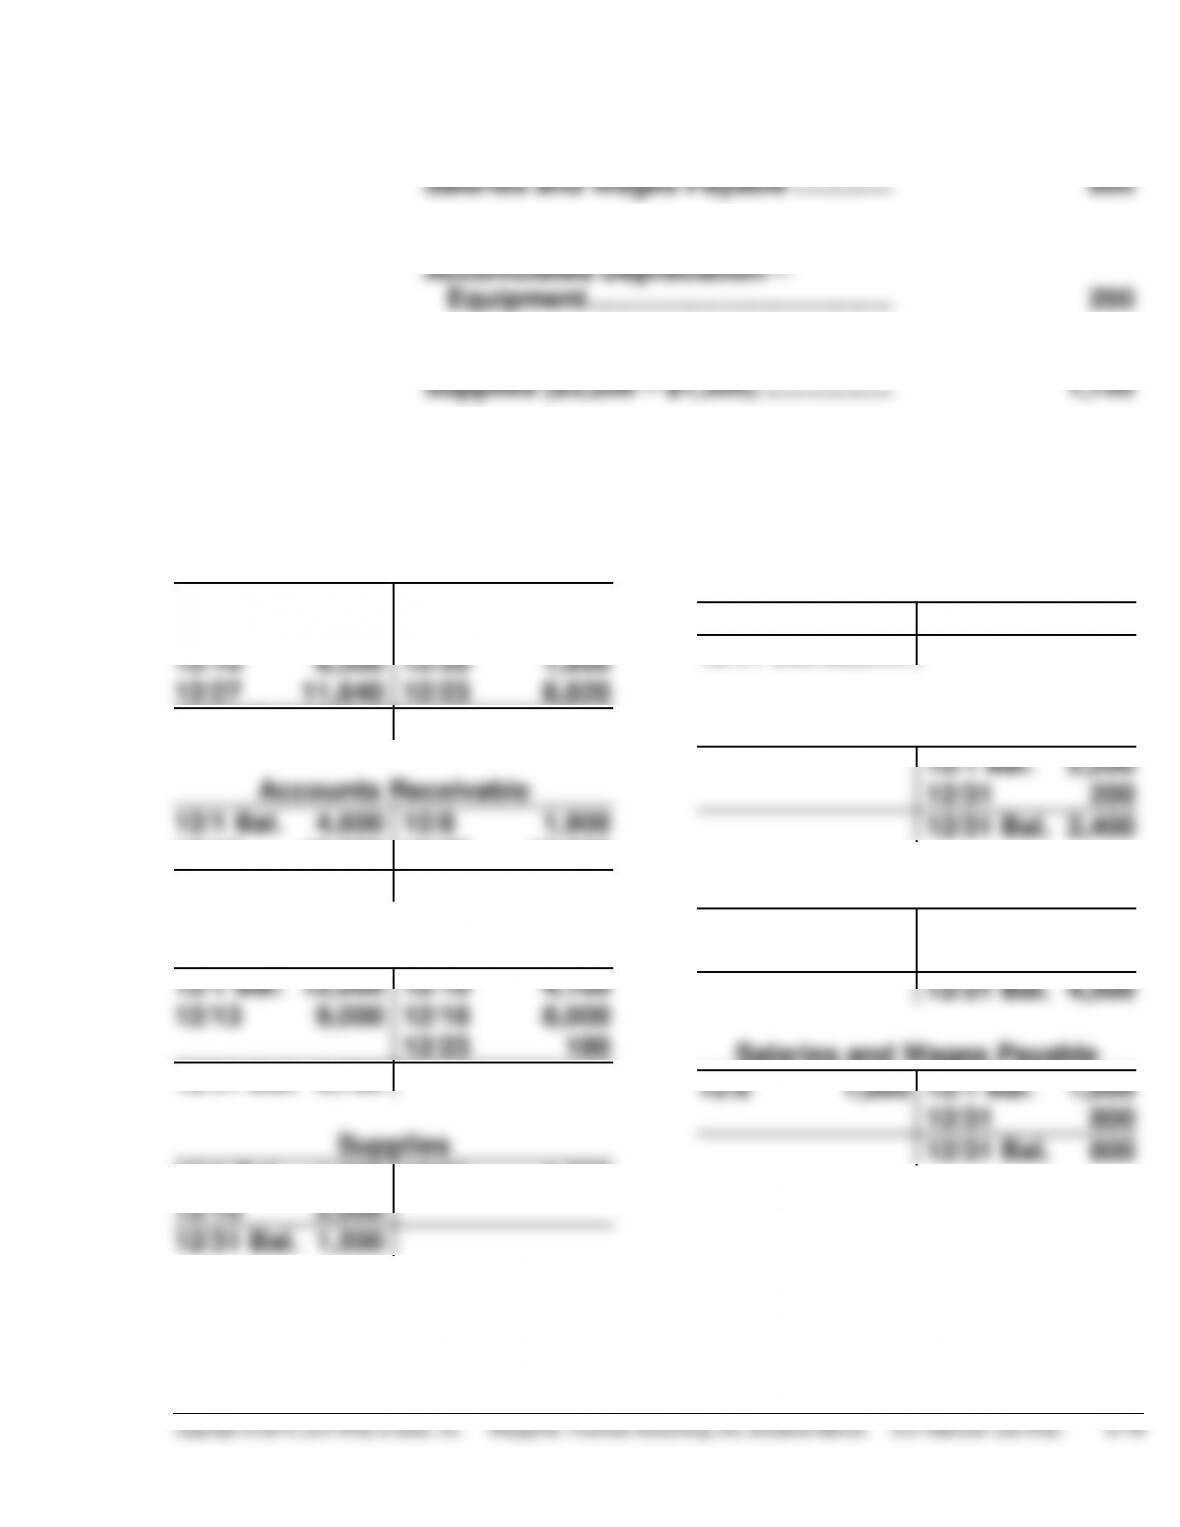
(b) & (c) General Ledger
Cash
12/1 Bal. 7,200
12/8 1,900
12/10 6,300
12/27 11,640
12/6 1,600
12/15 2,000
12/20 1,800
12/23 8,820
12/31 Bal. 12,820
Accounts Receivable
12/1 Bal. 4,600
12/18 12,000
12/8 1,900
12/27 12,000
12/31 Bal. 2,700
Inventory
12/1 Bal. 12,000
12/13 9,000
12/10 4,100
12/18 8,000
12/23 180
12/31 Bal. 8,720
Supplies
12/1 Bal. 1,200
12/15 2,000
12/31 1,700
12/31 Bal. 1,500
Equipment
12/1 Bal. 22,000
12/31 Bal. 22,000
Accumulated Depr.—Equipment
12/1 Bal. 2,200
12/31 200
12/31 Bal. 2,400
Accounts Payable
12/23 9,000
12/1 Bal. 4,500
12/13 9,000
12/31 Bal. 4,500
Salaries and Wages Payable
12/6 1,000
12/1 Bal. 1,000
12/31 800
12/31 Bal. 800
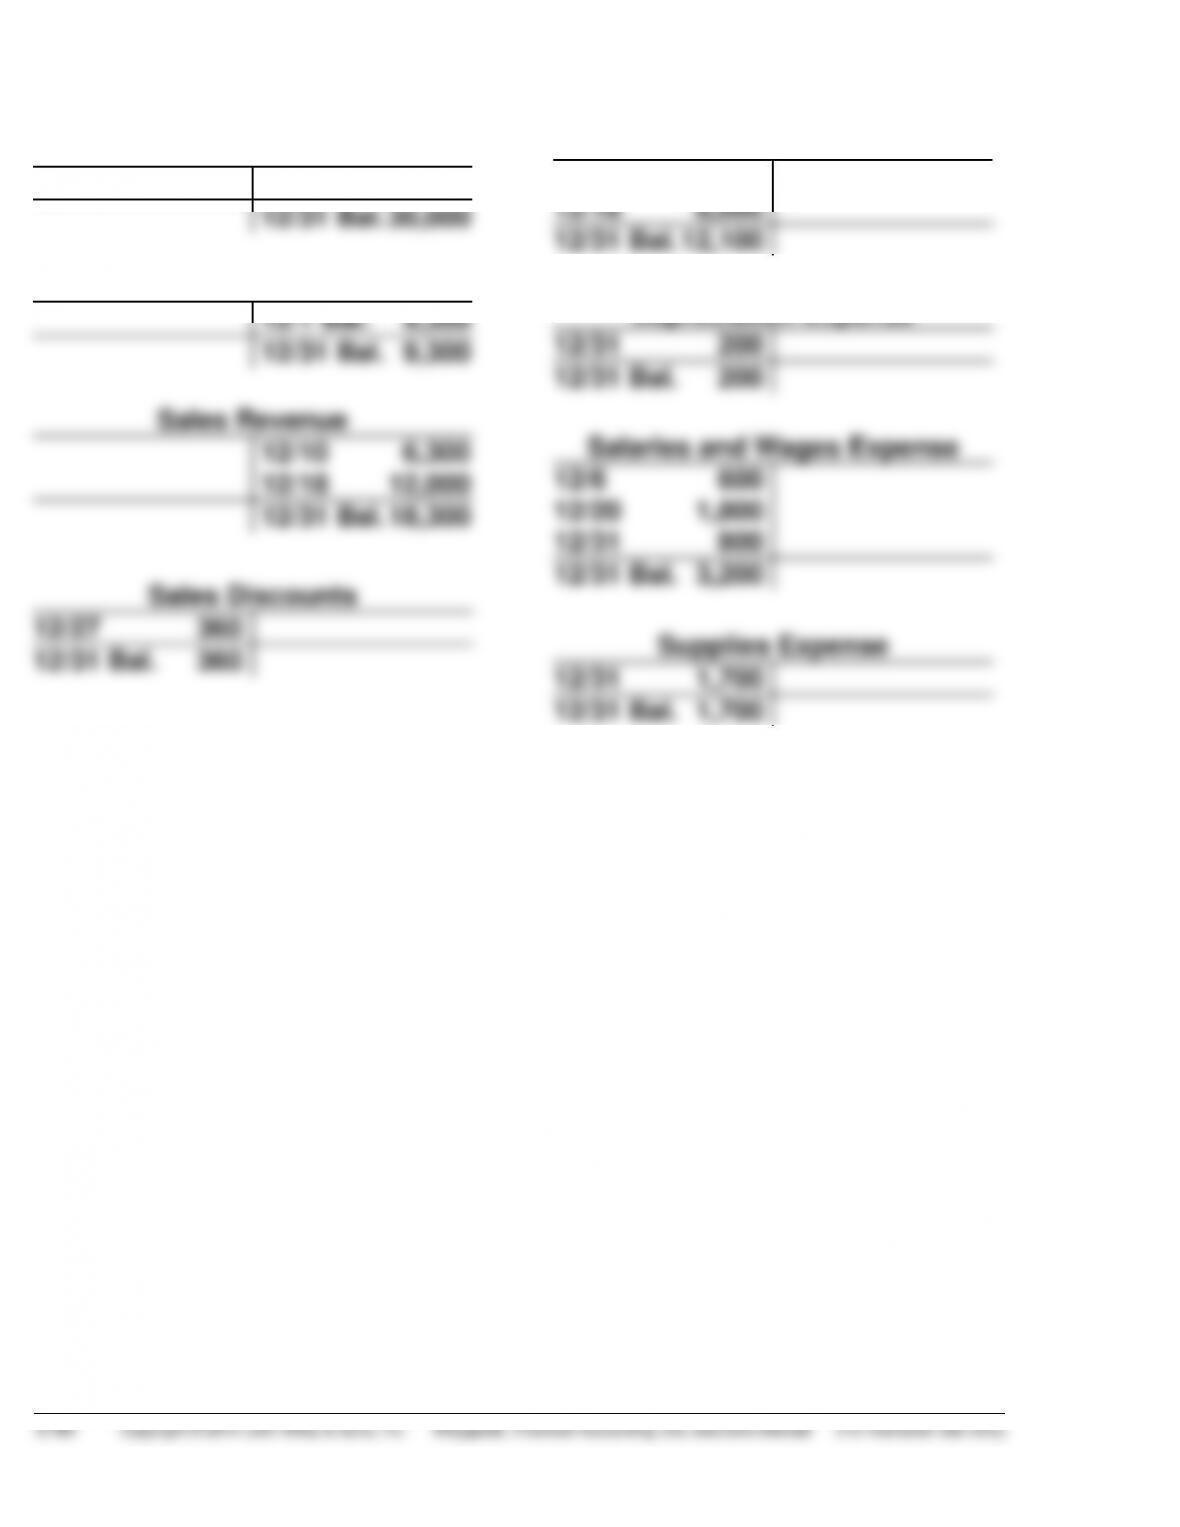
COMPREHENSIVE PROBLEM SOLUTION (Continued)
Common Stock
12/1 Bal. 30,000
12/31 Bal. 30,000
Retained Earnings
12/1 Bal. 9,300
12/31 Bal. 9,300
Cost of Goods Sold
12/10 4,100
12/18 8,000
12/31 Bal. 12,100
Depreciation Expense
12/31 200
COMPREHENSIVE PROBLEM SOLUTION (Continued)
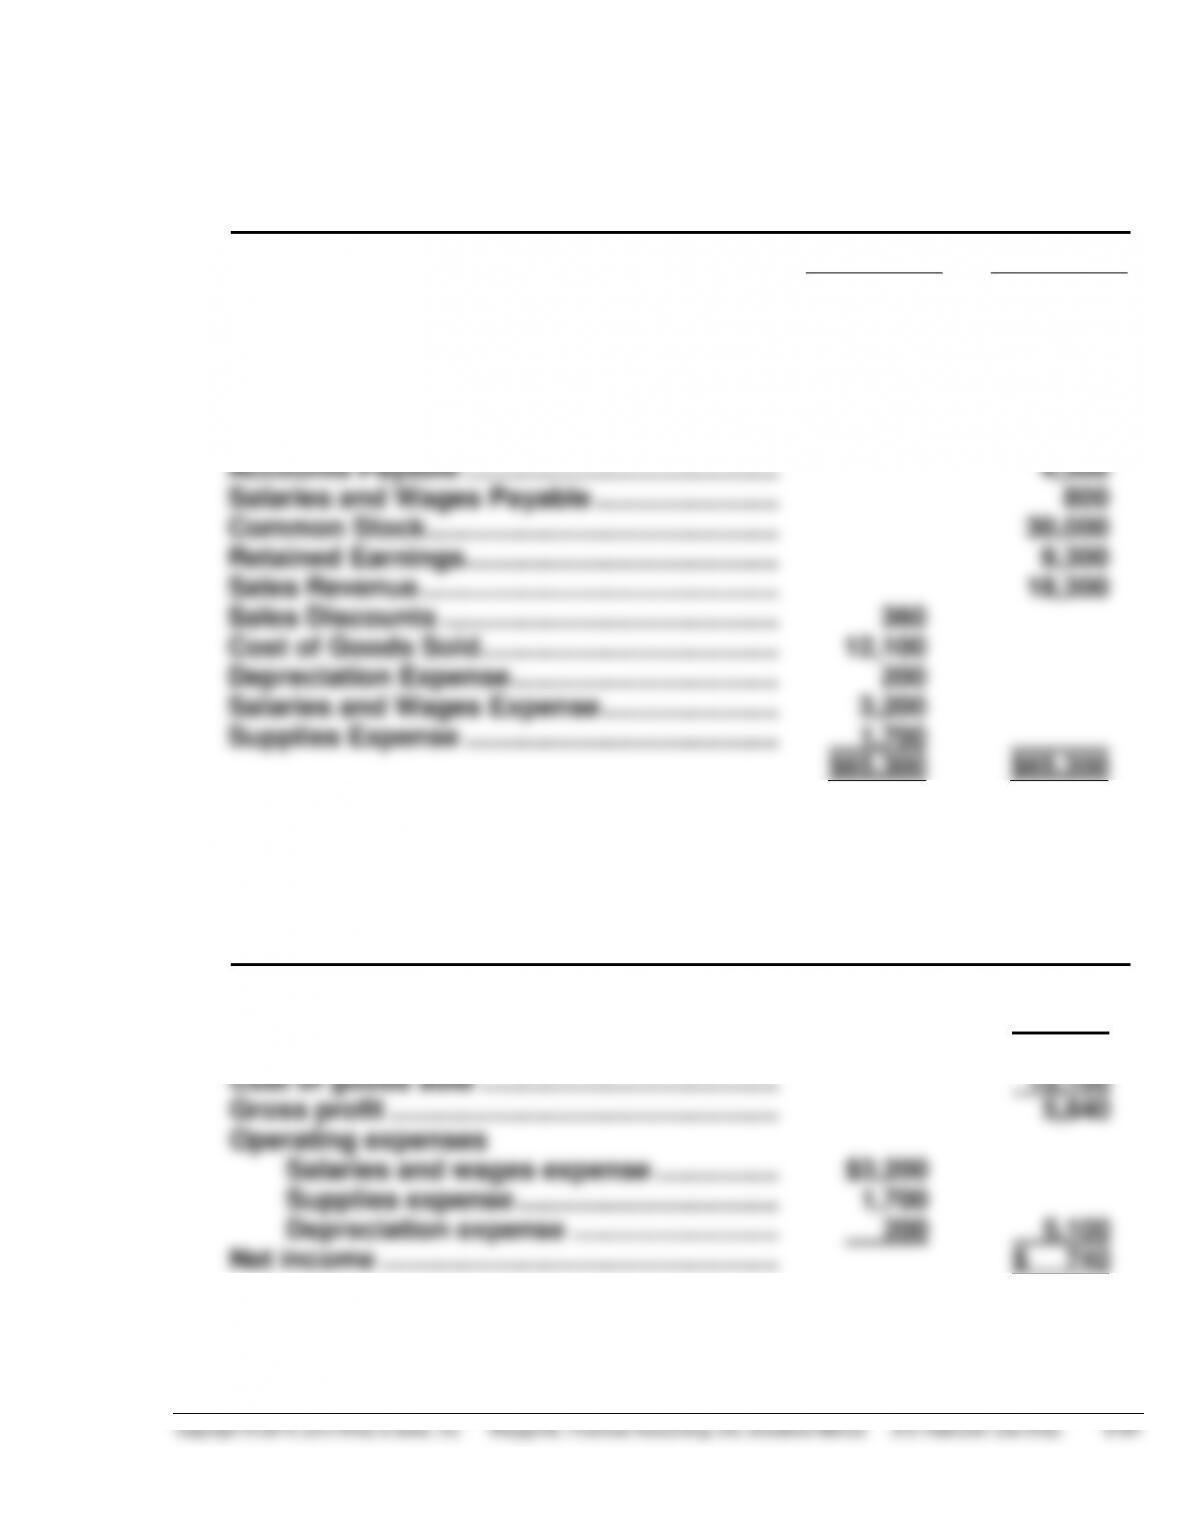
(d) PROSEN DISTRIBUTING COMPANY
Adjusted Trial Balance
December 31, 2015
DR.
CR.
Cash ................................................................
$12,820
Accounts Receivable ........................................
2,700
Inventory ............................................................
8,720
Supplies .............................................................
1,500
Equipment .........................................................
22,000
Accumulated Depreciation—Equipment .........
$ 2,400
Accounts Payable .............................................
4,500
Salaries and Wages Payable ............................
800
Common Stock ..................................................
30,000
Retained Earnings .............................................
9,300
Sales Revenue ...................................................
18,300
Sales Discounts ................................................
360
Cost of Goods Sold ...........................................
12,100
Depreciation Expense .......................................
200
Salaries and Wages Expense ...........................
3,200
Supplies Expense .............................................
1,700
$65,300
$65,300
(e) PROSEN DISTRIBUTING COMPANY
Income Statement
For the Month Ending December 31, 2015
Sales revenue ....................................................
$18,300
Less: Sales discounts .....................................
360
Net sales ............................................................
17,940
Cost of goods sold ...........................................
12,100
Gross profit .......................................................
5,840
Operating expenses
Salaries and wages expense ....................
$3,200
Supplies expense ......................................
1,700
Depreciation expense ...............................
200
5,100
Net income ........................................................
$ 740
COMPREHENSIVE PROBLEM SOLUTION (Continued)
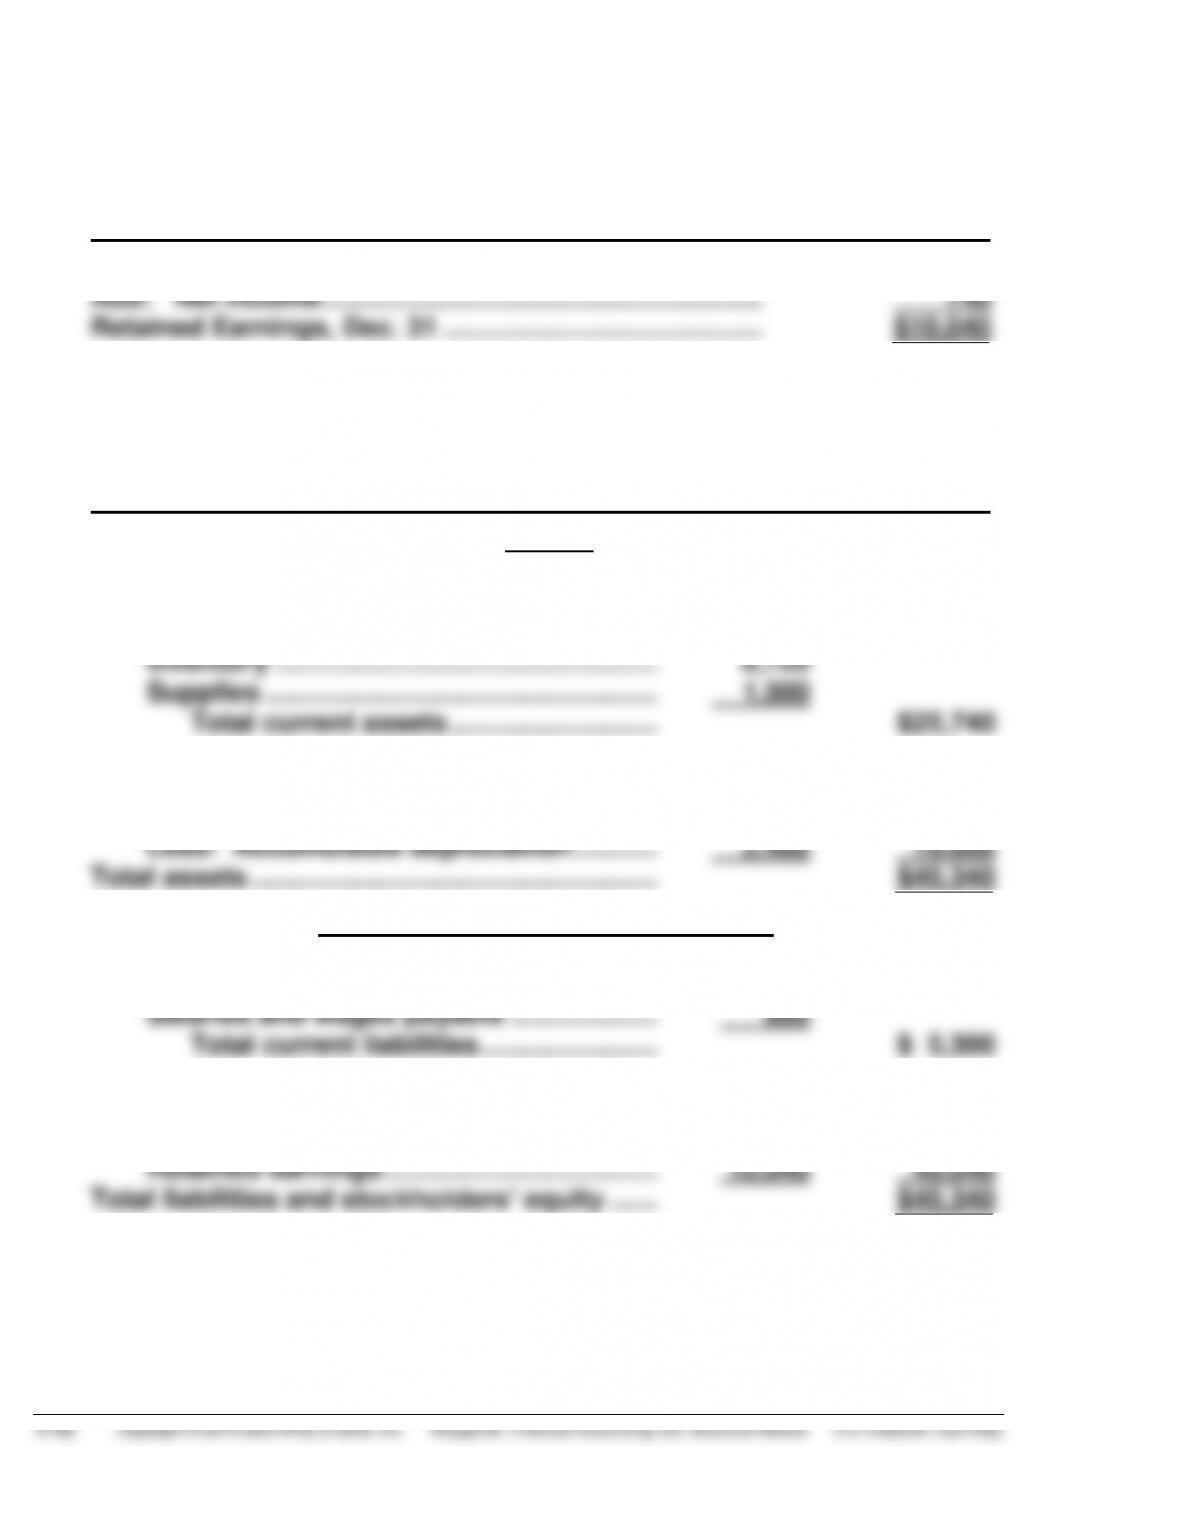
PROSEN DISTRIBUTING COMPANY
Retained Earnings Statement
For the Month Ended December 31, 2015
Retained Earnings, Dec. 1 .............................................
$ 9,300
Add: Net income...........................................................
740
Retained Earnings, Dec. 31 ...........................................
$10,040
PROSEN DISTRIBUTING COMPANY
Balance Sheet
December 31, 2015
Assets
Current assets
Cash ............................................................
$12,820
Accounts receivable ..................................
2,700
Inventory ....................................................
8,720
Supplies .....................................................
1,500
Total current assets .............................
$25,740
Property, plant, and equipment
Equipment ..................................................
22,000
Less: Accumulated depreciation .............
2,400
19,600
Total assets .......................................................
$45,340
Liabilities and Stockholders’ Equity
Current liabilities
Accounts payable ......................................
$4,500
Salaries and wages payable .....................
800
Total current liabilities .........................
$ 5,300
Stockholders’ equity
Common stock ...........................................
Retained earnings ......................................
30,000
10,040
40,040
Total liabilities and stockholders’ equity ........
$45,340
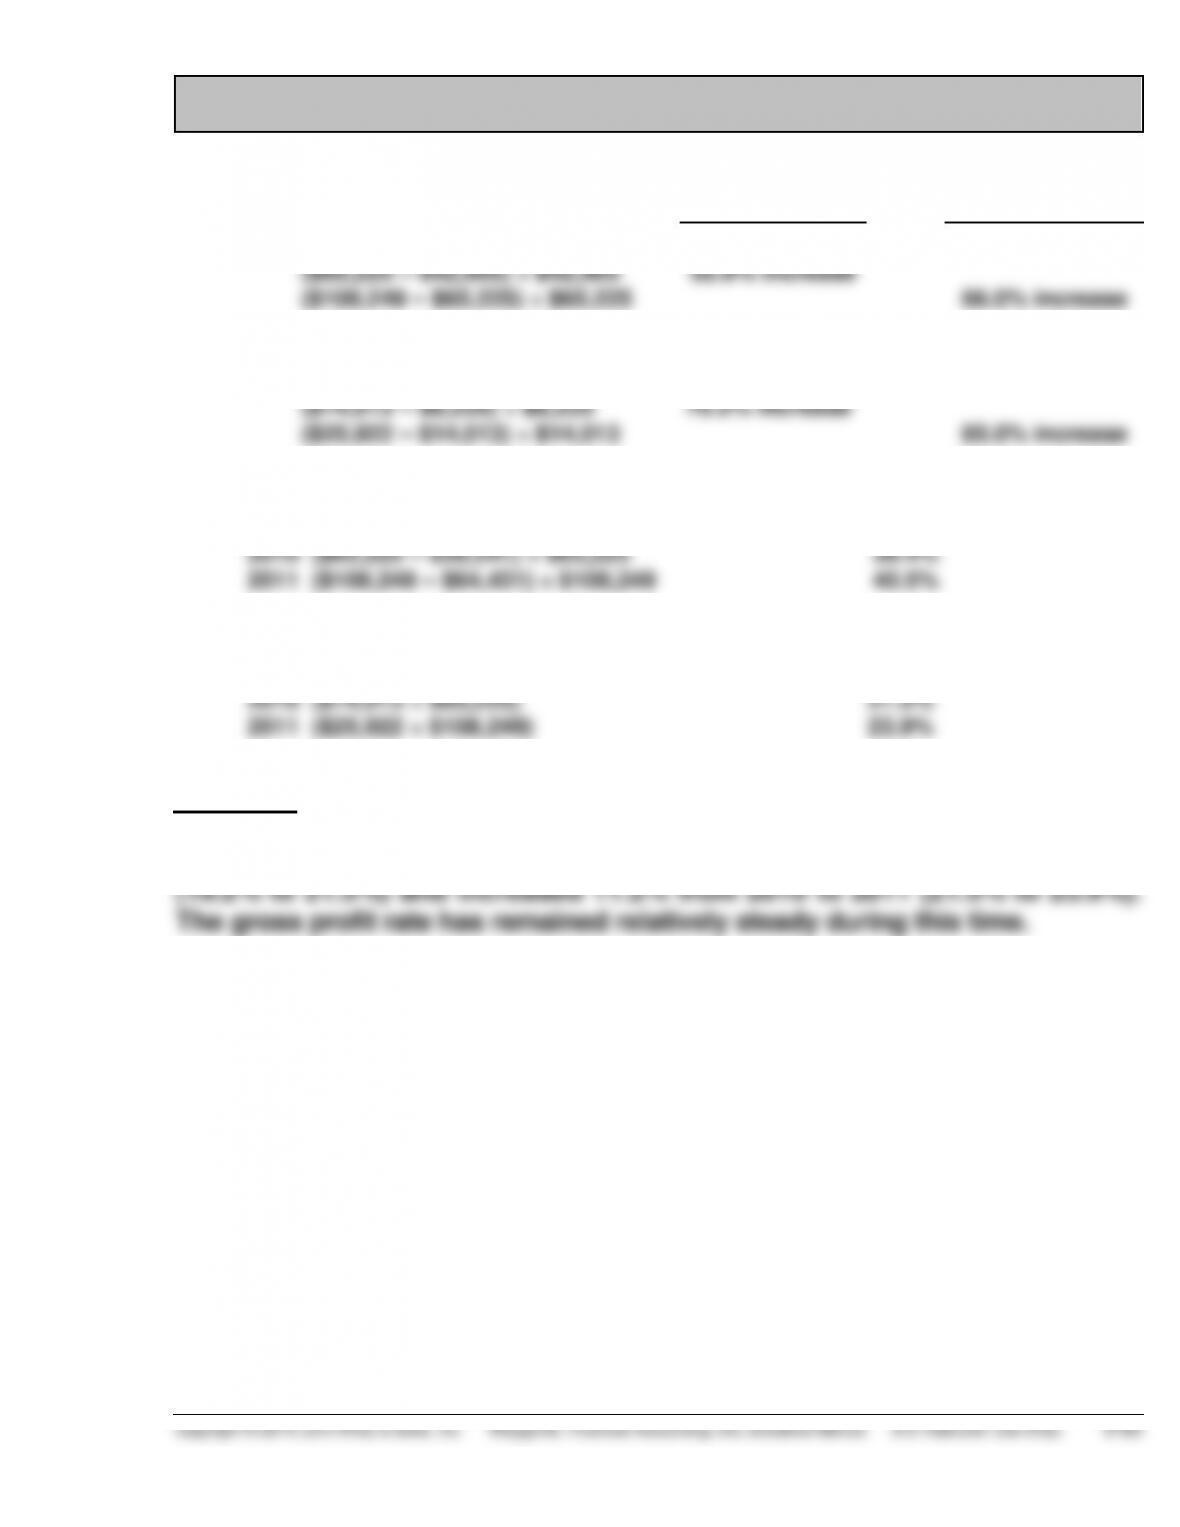
BYP 5-1 FINANCIAL REPORTING PROBLEM
2010
2011
(a)
(1)
Percentage change in sales:
($65,225 – $42,905) ÷ $42,905
($108,249 – $65,225) ÷ $65,225
52.0% increase
66.0% increase
(2)
Percentage change in net income:
($14,013 – $8,235) ÷ $8,235
($25,922 – $14,013) ÷ $14,013
70.2% increase
85.0% increase
(b)
Gross profit rate:
2009 ($42,905 – $25,683) ÷ $42,905
2010 ($65,225 – $39,541) ÷ $65,225
2011 ($108,249 – $64,431) ÷ $108,249
40.1%
39.4%
40.5%
(c)
Percentage of net income to sales:
2009 ($8,235 ÷ $42,905)
2010 ($14,013 ÷ $65,225)
2011 ($25,922 ÷ $108,249)
19.2%
21.5%
23.9%
Comment
The percentage of net income to sales increased 12% from 2009 to 2010
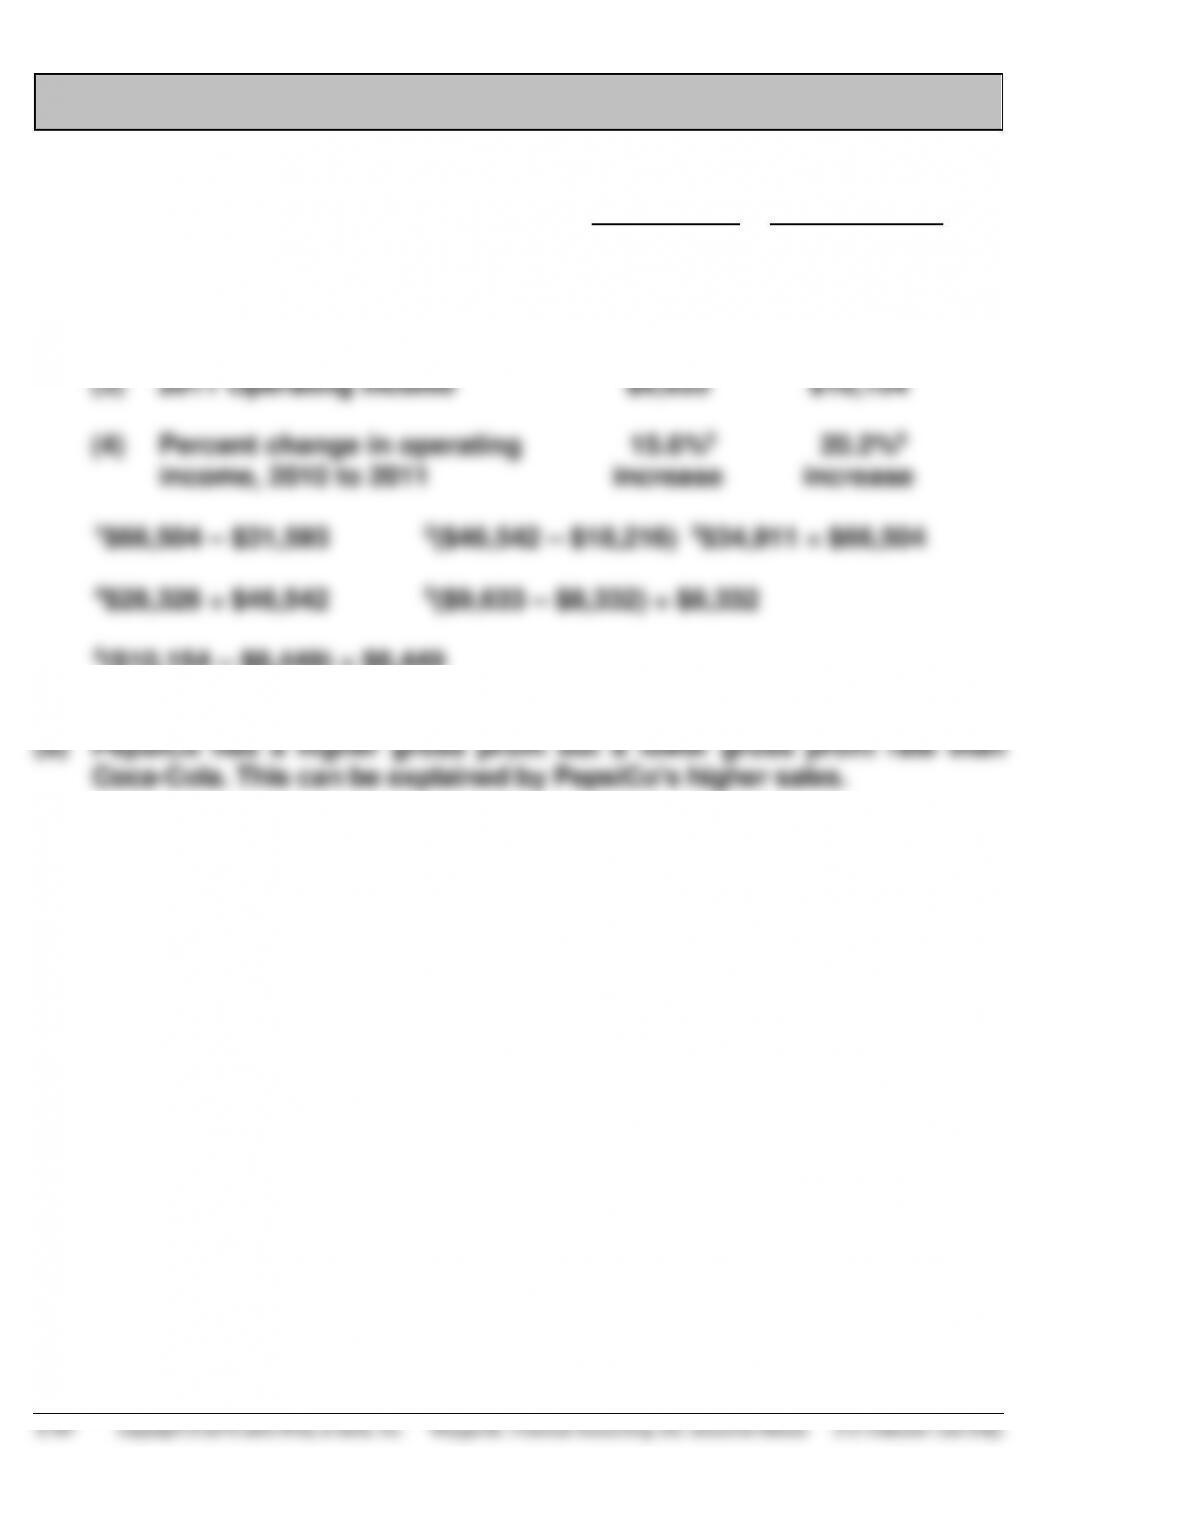
BYP 5-2 COMPARATIVE ANALYSIS PROBLEM
PepsiCo
Coca-Cola
(a)
(1)
2011 Gross profit
$34,9111
$28,3262
(2)
2011 Gross profit rate
52.5%3
60.9%4
(3)
2011 Operating income
$9,633
$10,154
(4)
Percent change in operating
income, 2010 to 2011
15.6%5
increase
20.2%6
increase
1$66,504 – $31,593
2($46,542 – $18,216)
3$34,911 ÷ $66,504
4$28,326 ÷ $46,542
5($9,633 – $8,332) ÷ $8,332
6($10,154 – $8,449) ÷ $8,449
Coca-Cola had a larger operating income because its selling, general,
and administrative expenses were much smaller than PepsiCo’s.
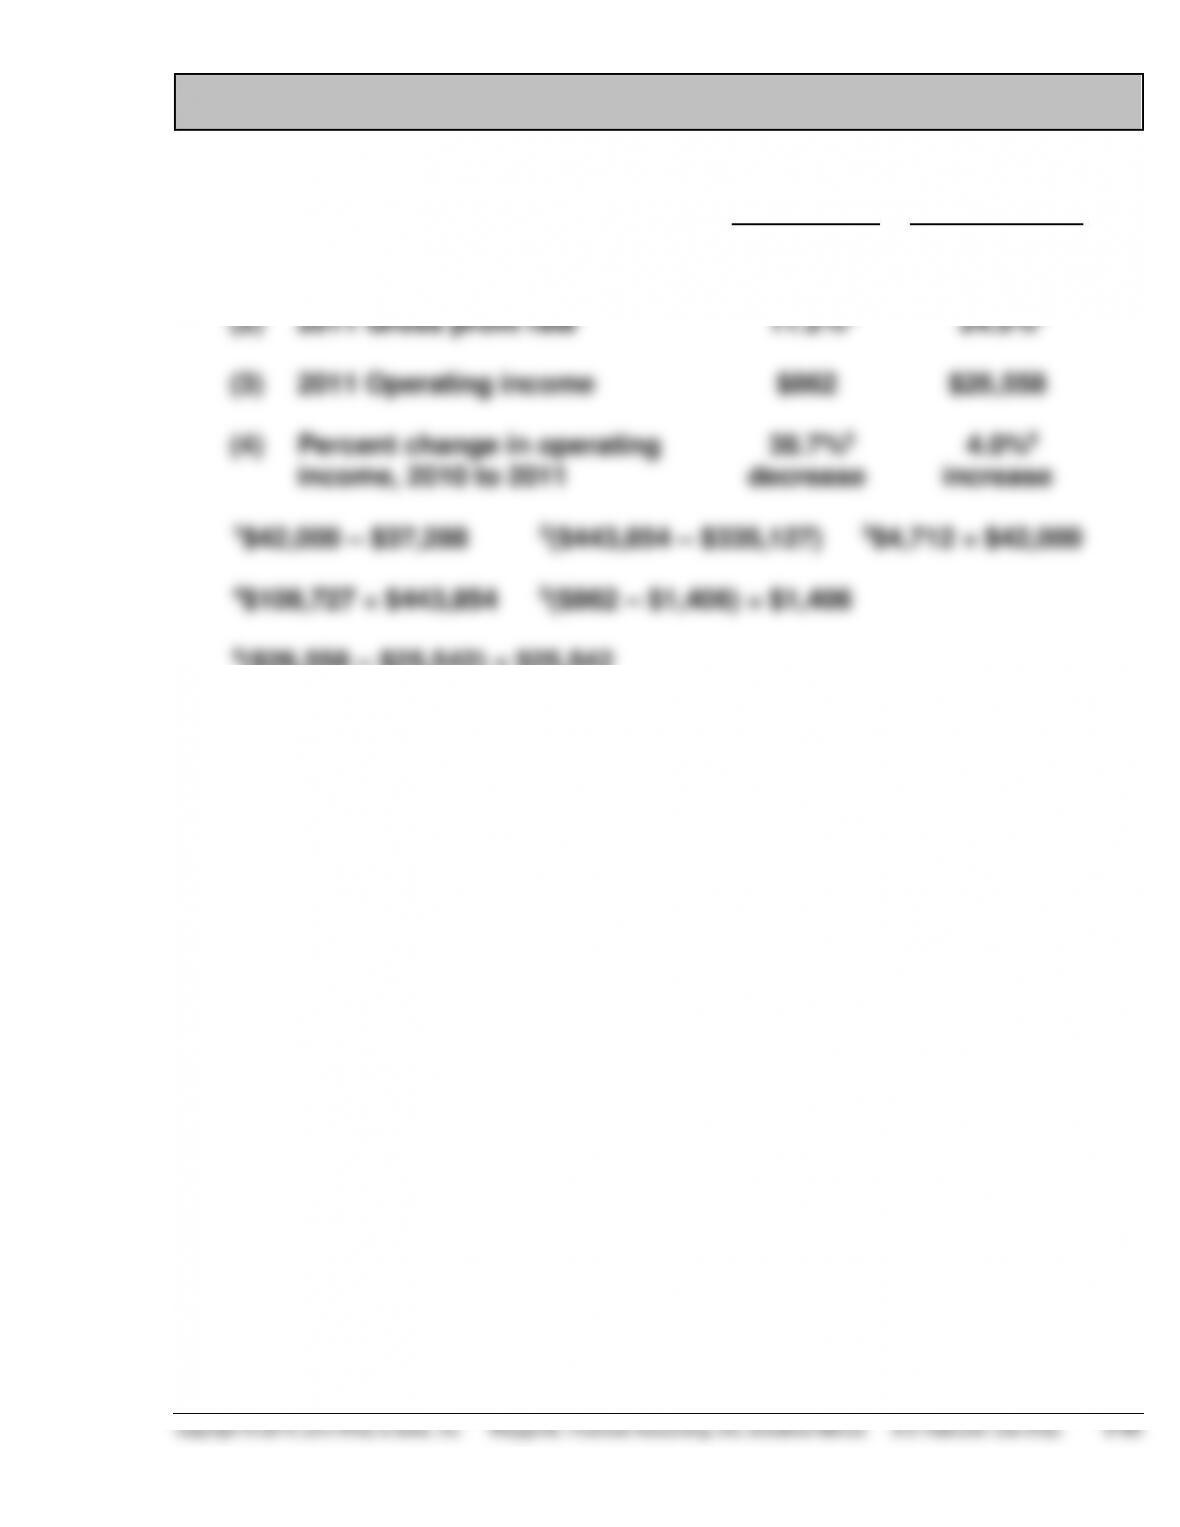
BYP 5-3 COMPARATIVE ANALYSIS PROBLEM
Amazon
Wal-Mart
(a)
(1)
2011 Gross profit
$4,7121
$108,7272
(2)
2011 Gross profit rate
11.2%3
24.5%4
(3)
2011 Operating income
$862
$26,558
(4)
Percent change in operating
income, 2010 to 2011
38.7%5
decrease
4.0%6
increase
(b) Wal-Mart has a much higher gross profit and gross profit rate than
Amazon. This can be explained by Wal-Mart’s higher markup.
Wal-Mart’s operating income increased 4.0% while Amazon’s
decreased by almost 39%. Amazon’s operating expenses increased
44% during 2011 causing its operating income to decline significantly.
1$42,000 – $37,288
2($443,854 – $335,127)
3$4,712 ÷ $42,000
4$108,727 ÷ $443,854
5($862 – $1,406) ÷ $1,406
6($26,558 – $25,542) ÷ $25,542

BYP 5-4 REAL-WORLD FOCUS
The answers to this assignment will be dependent upon the articles
selected from the Internet by the student.
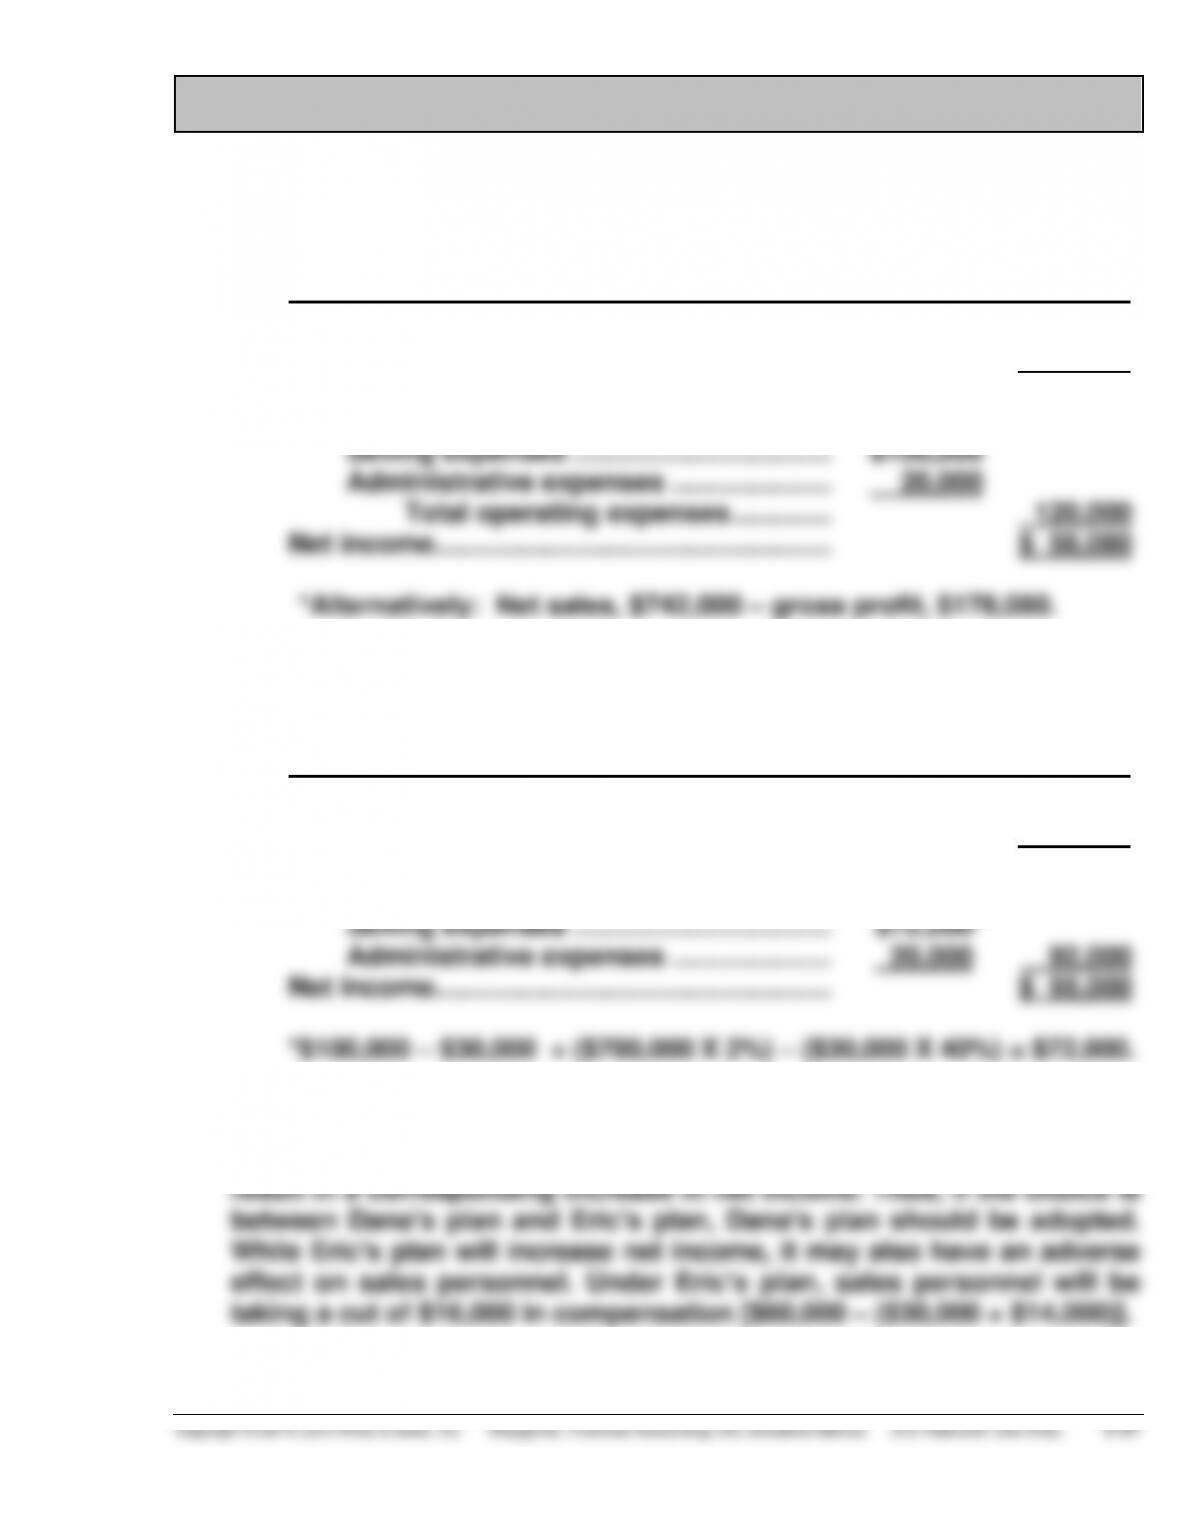
BYP 5-5 DECISION MAKING ACROSS THE ORGANIZATION
(a) (1) FAMILY DEPARTMENT STORE
Income Statement
For the Year Ended December 31, 2015
Net sales [$700,000 + ($700,000 X 6%)] ...... $742,000
Cost of goods sold ($742,000 X 76%)* ........ 563,920
Gross profit ($742,000 X 24%) ..................... 178,080
Operating expenses
(2) FAMILY DEPARTMENT STORE
Income Statement
For the Year Ended December 31, 2015
Net sales ....................................................... $700,000
Cost of goods sold ....................................... 553,000
Gross profit .................................................. 147,000
Operating expenses
(b) Dana’s proposed changes will increase net income by $31,080. Eric’s
proposed changes will reduce operating expenses by $28,000 and


