PROBLEM 14-7 (Continued)
Current ratio = 3.0 =
$2,880,000
Current liabilities
Cost of goods sold
PROBLEM 14-8
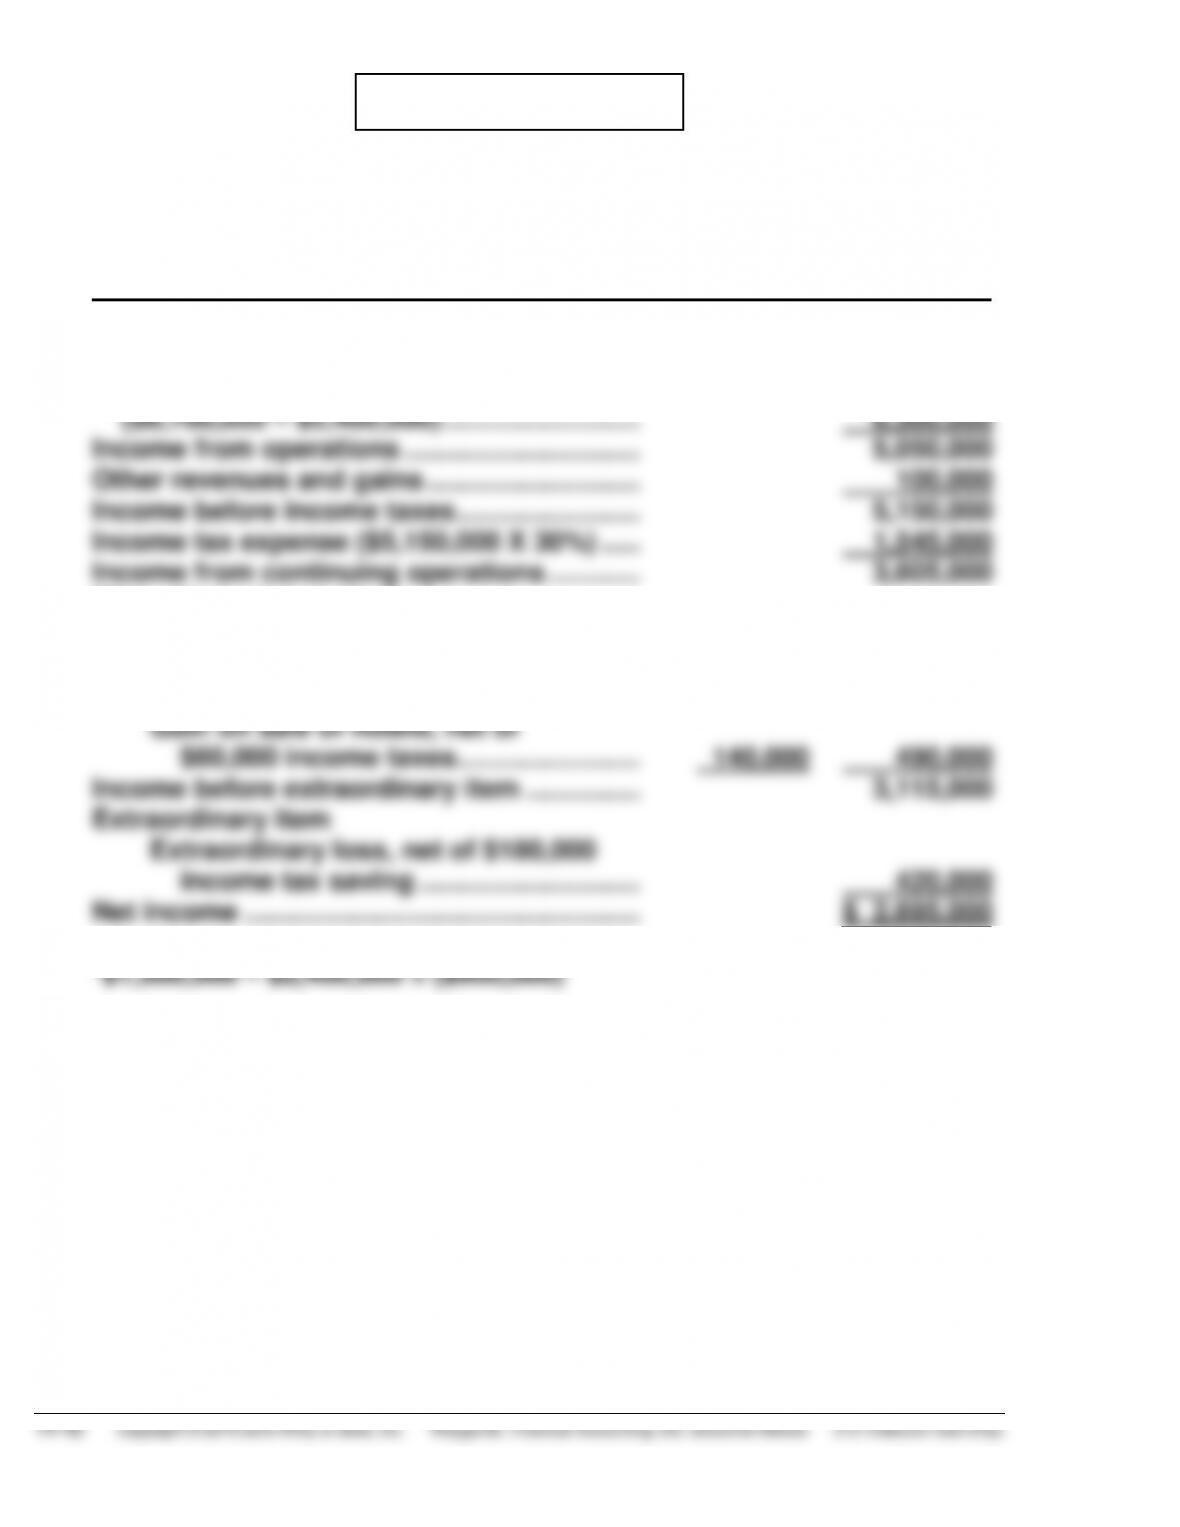
TERWILLIGER CORPORATION
Condensed Income Statement
For the Year Ended December 31, 2015
Operating revenues
($12,850,000 – $1,500,000) …………………… $11,350,000
Operating expenses
Discontinued operations
Loss from operations of hotel
chain*, net of $270,000 income
tax saving ……………………………………. $630,000
PROBLEM 14-9
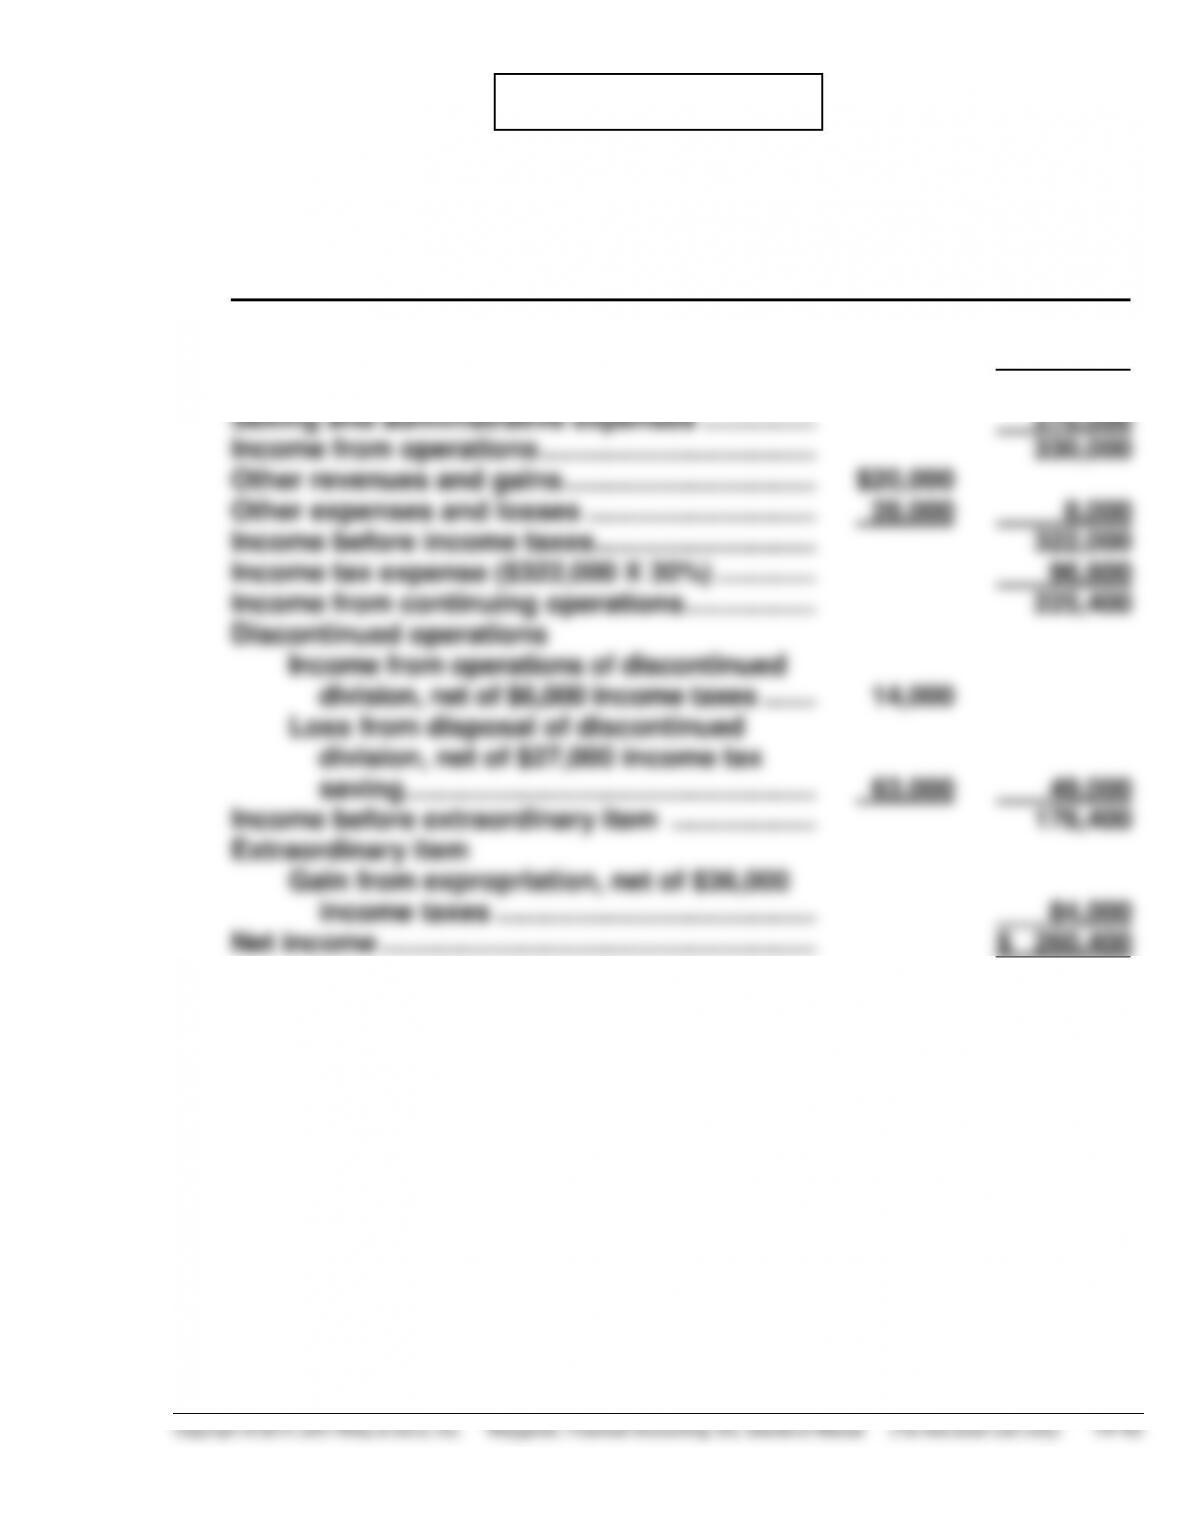
JAIME CORPORATION
Income Statement
For the Year Ended December 31, 2015
Net sales ……………………………………………………. $1,700,000
Cost of goods sold …………………………………….. 1,100,000
Gross profit ……………………………………………….. 600,000
BYP 14-1 FINANCIAL REPORTING PROBLEM
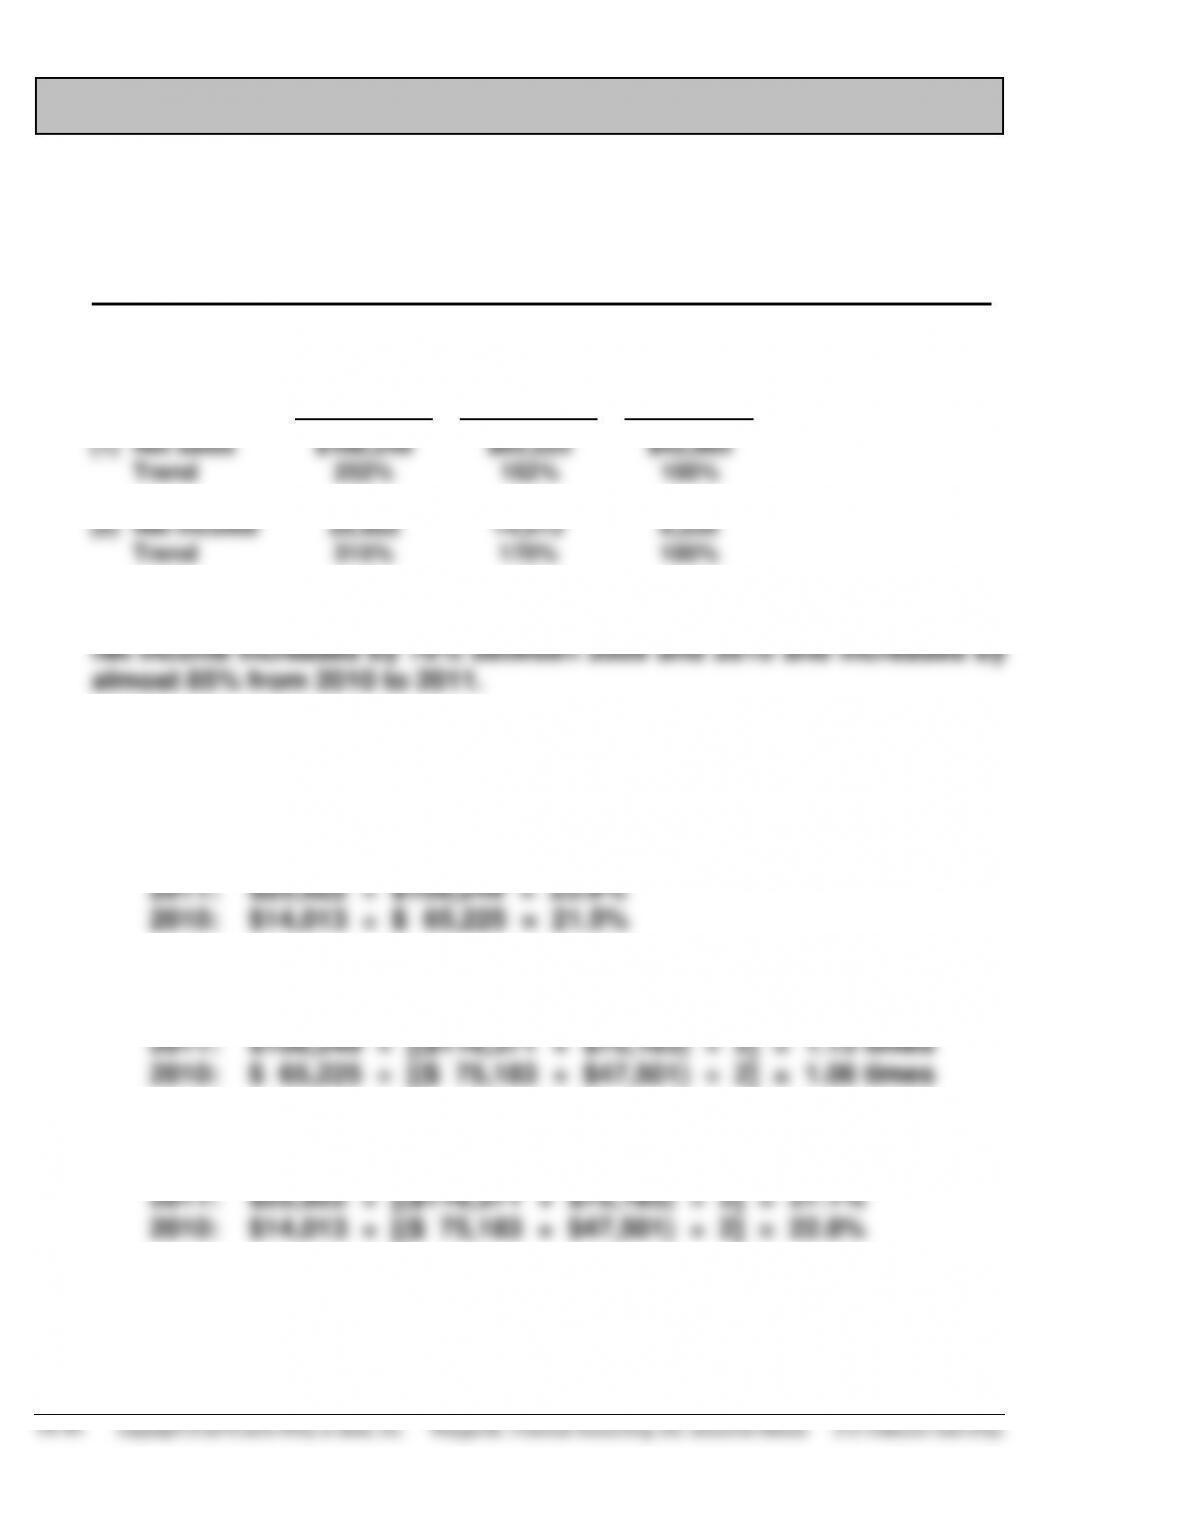
(a) APPLE, INC.
Trend Analysis of Net Sales and Net Income
For the Three Years Ended 2011
Base Period 2009—(in millions)
2011
2010
2009
(1)
Net sales
Trend
$108,249
252%
$65,225
152%
$42,905
100%
(2)
Net income
Trend
25,922
315%
14,013
170%
8,235
100%
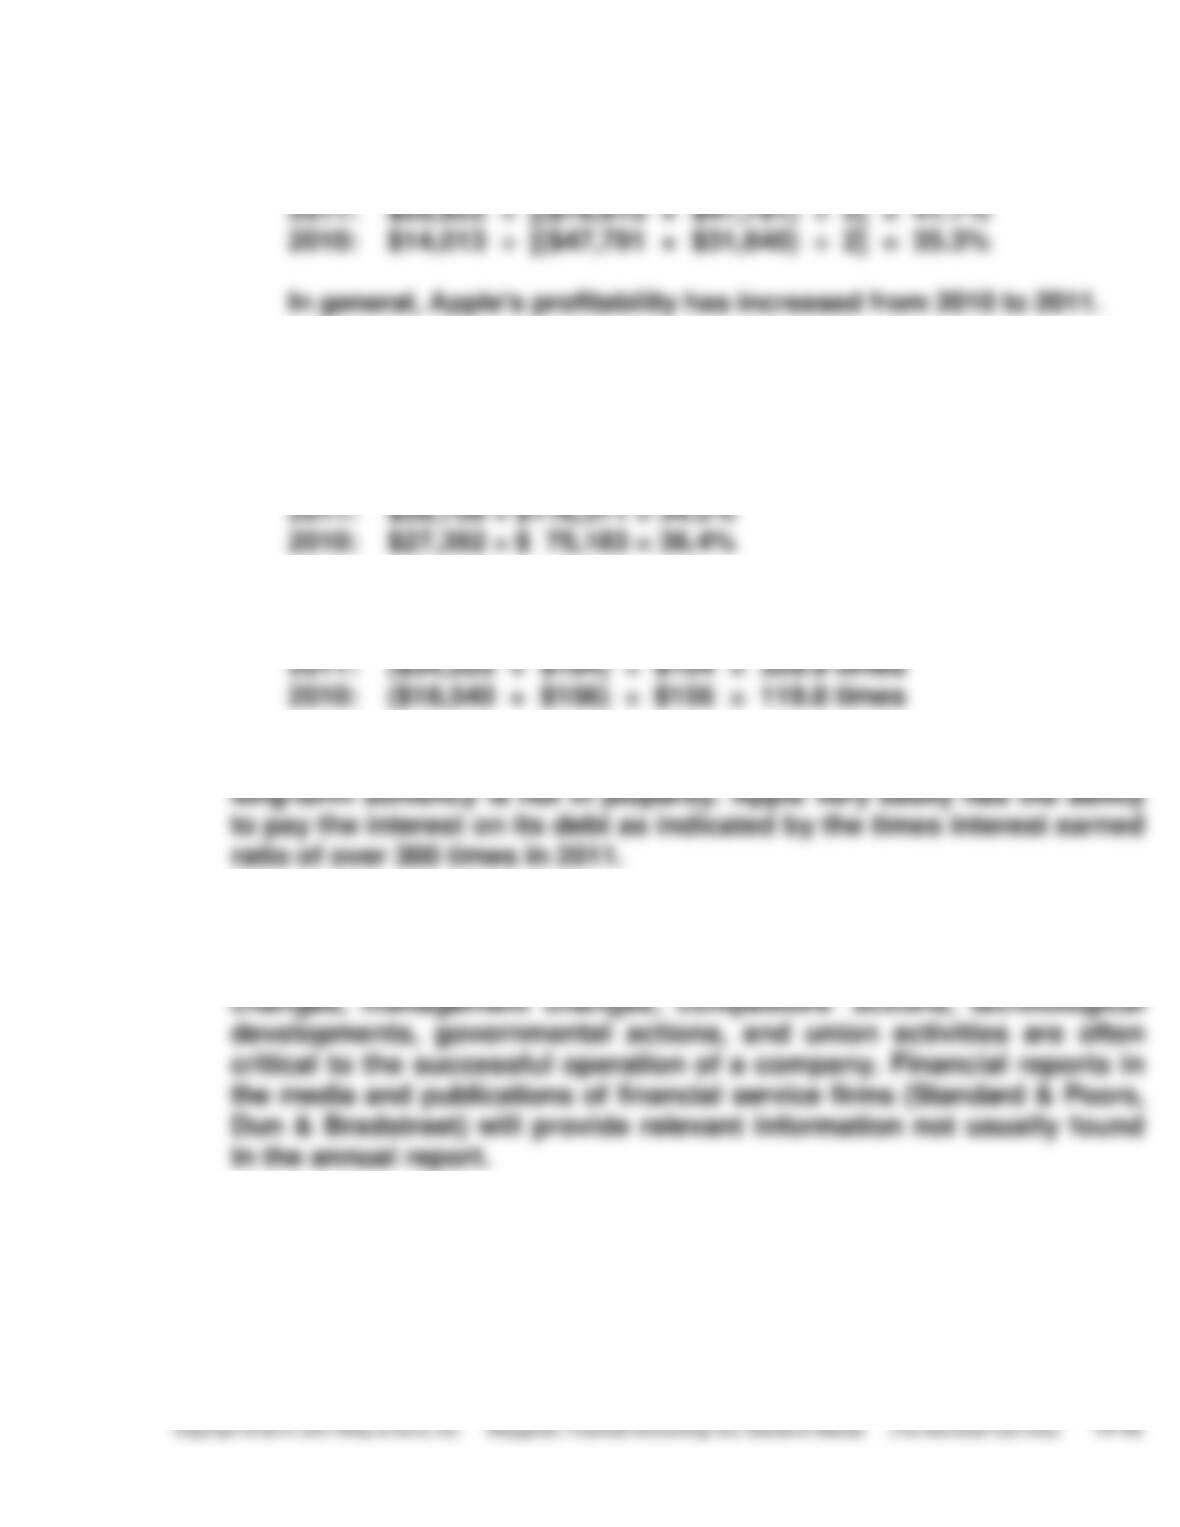
Between 2009 and 2011 Apple’s net sales increased by 152%. Apple’s
(b) (dollar amounts in millions)
(1) Profit Margin
(2) Asset Turnover
(3) Return on Assets
BYP 14-1 (Continued)
(4) Return on Common Stockholders’ Equity
(c) (dollar amounts in millions)
(1) Debt to Assets
(2) Times Interest Earned
Since creditors are providing less than 40% of Apple’s total assets, its
(d) Substantial amounts of important information about a company are not
in its financial statements. Events involving such things as industry
BYP 14-2 COMPARATIVE ANALYSIS PROBLEM
(a)
PepsiCo
Coca-Cola Company
(1)
(i)
Percentage increase
in net sales
$66,504 $57,838
= 15.0%
$46,542 $35,119
= 32.5%
$57,838
$35,119
(ii)
Percentage increase
(decrease) in net
income
$6,443 $6,320
= 1.9%
$8,572 $11,809
= 27.4%
$6,320
$11,809
(2)
(i)
Percentage increase
(decrease) in total
assets
$72,882 $68,153
= 6.9%
$79,974 $72,921
= 9.7%
$68,153
$72,921
(ii)
Percentage increase
(decrease) in total
common
stockholders’ equity
$20,704 $21,273
= 2.7%
$31,921 $31,317
= 1.9%
$21,273
$31,317
(3)
Basic earnings per share
$4.08*
$3.75*
Price-earnings ratio
$66.35
= 16.3 times
$75.05
= 20.0 times
$4.08
$3.75
*Given on income statement
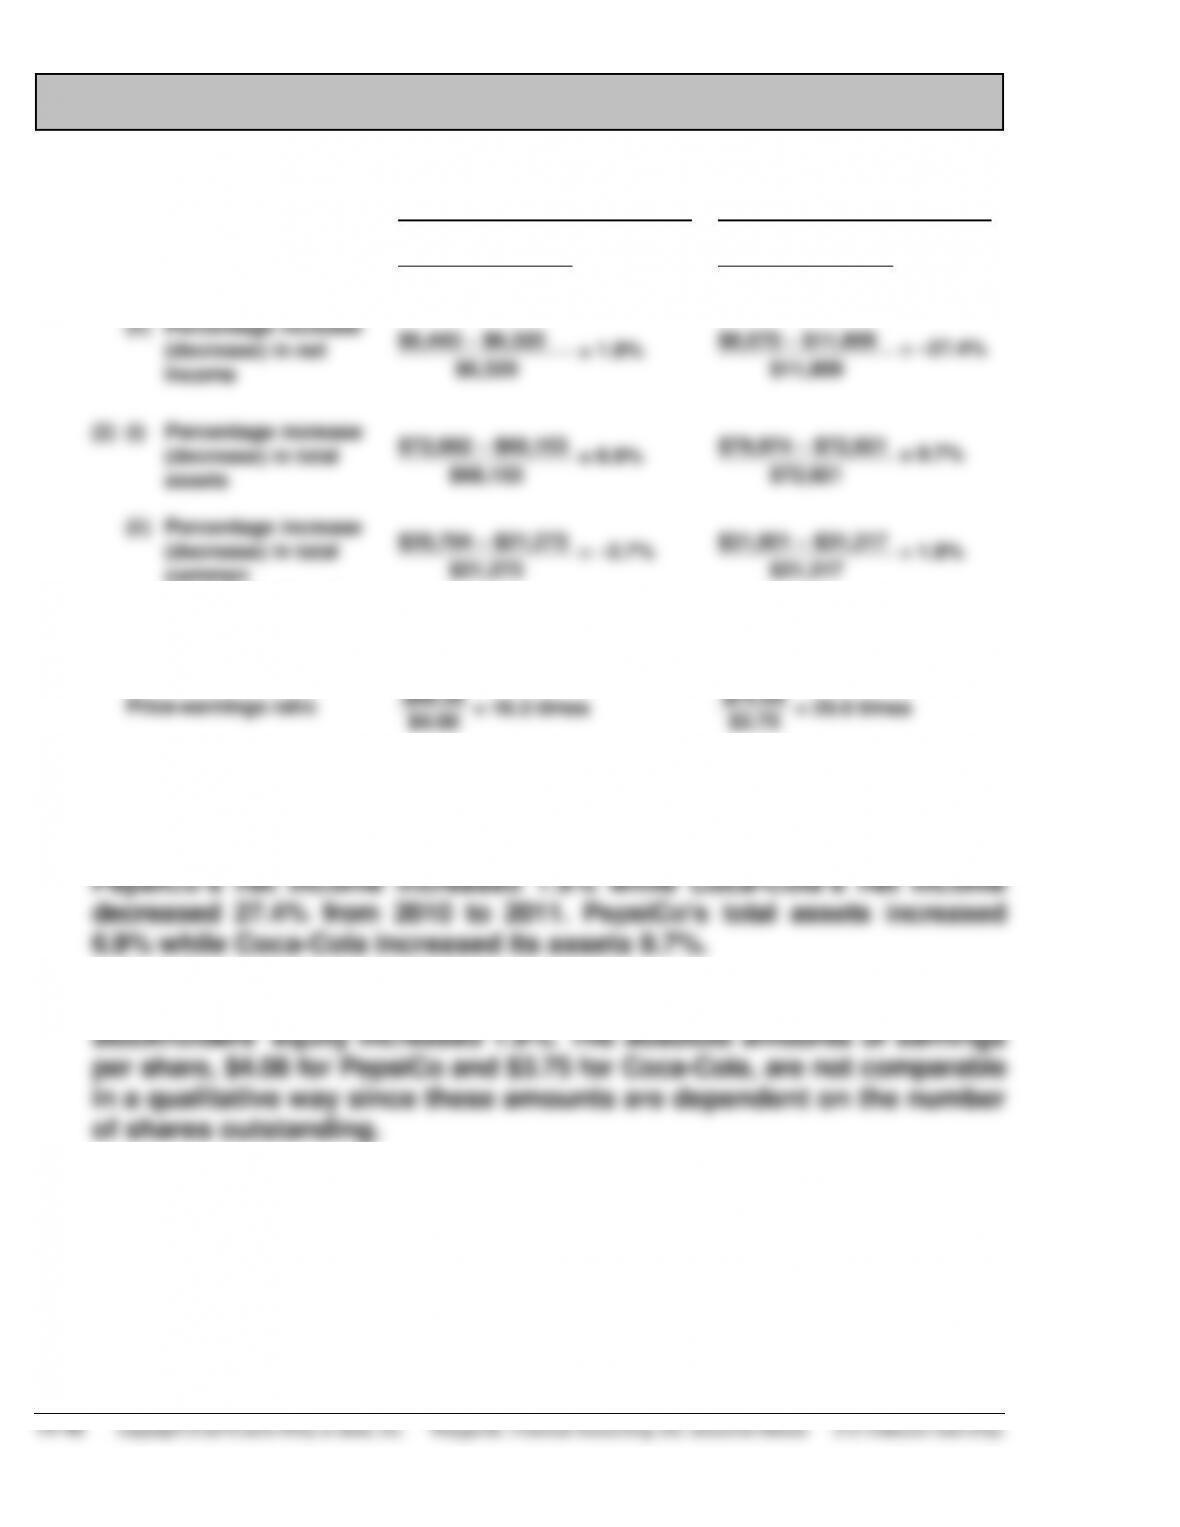
(b) PepsiCo’s net sales increased 15% while Coca–Cola’s increased over 32%.
PepsiCo’s stockholders’ equity decreased by 2.7% while Coca-Cola’s
BYP 14-3 COMPARATIVE ANALYSIS PROBLEM
(a)
Amazon
Wal-Mart
(1)
(i)
Percentage increase
in net sales
$42,000 $30,792
= 36.4%
$443,854 $418,952
= 5.9%
$30,792
$418,952
(ii)
Percentage increase
(decrease) in net
income
$631 $1,152
= (45.2)%
$16,387 $16,993
= (3.6)%
$1,152
$16,993
(2)
(i)
Percentage increase
(decrease) in total
assets
$25,278 $18,797
= 34.5%
$193,406 $180,782
= 7.0%
$18,797
$180,782
(ii)
Percentage increase
(decrease) in total
common
stockholders’ equity
$7,757 $6,864
= 13.0%
$75,761 $71,247
= 6.3%
$6,864
$71,247
(3)
Basic earnings per share
$1.39*
$4.54*
Price-earnings ratio $214.75 ÷ $1.39 = 154.5 times $57.90 ÷ $4.54 = 12.8 times
*Given on income statement
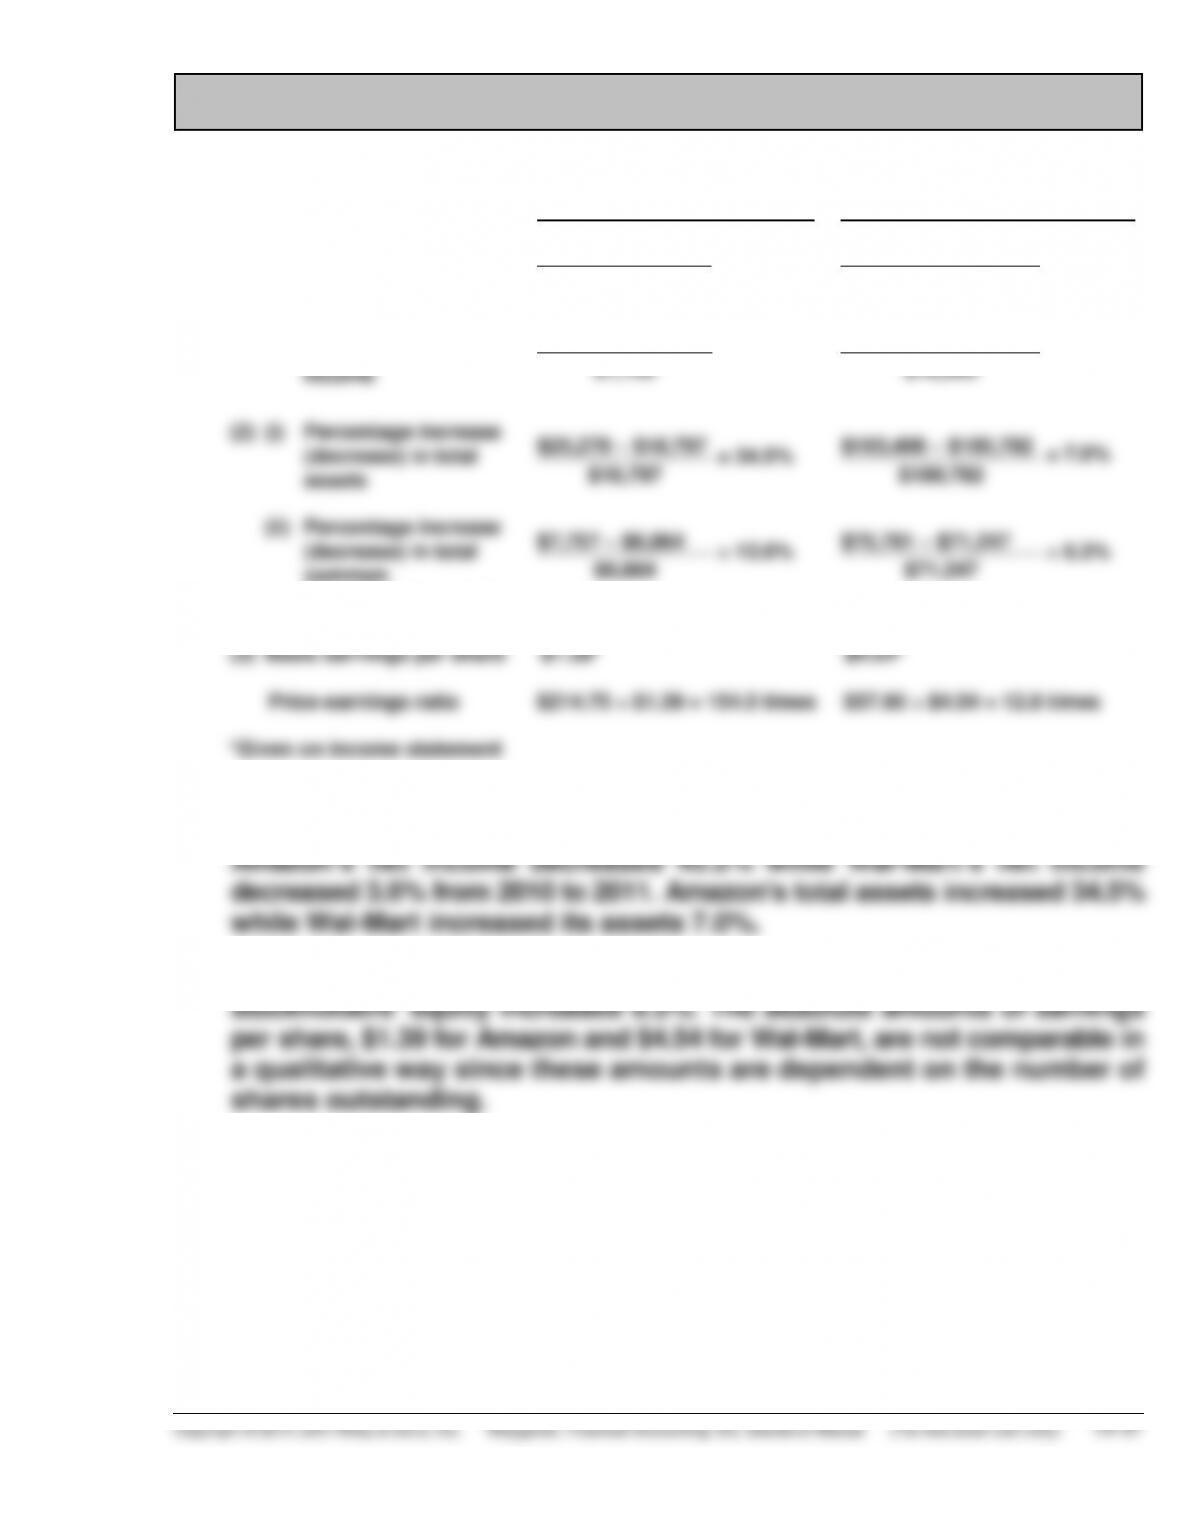
(b) Amazon’s net sales increased 36.4% while Wal-Mart’s increased 5.9%.
Amazon increased stockholders’ equity by 13.0% while Wal-Mart’s
BYP 14-4 REAL-WORLD FOCUS
(a) Optional elements include:
Financial highlights
(b) SEC-required elements include:
Auditors’ report
Management discussion
Financial statements and notes
Selected financial data
(c) Management discussion. This series of short, detailed reports discusses and
(d) Auditors’ report. This summary of the findings of an independent firm
(e) Selected financial data. This information summarizes a company’s financial