Unlock document.
This document is partially blurred.
Unlock all pages and 1 million more documents.
Get Access
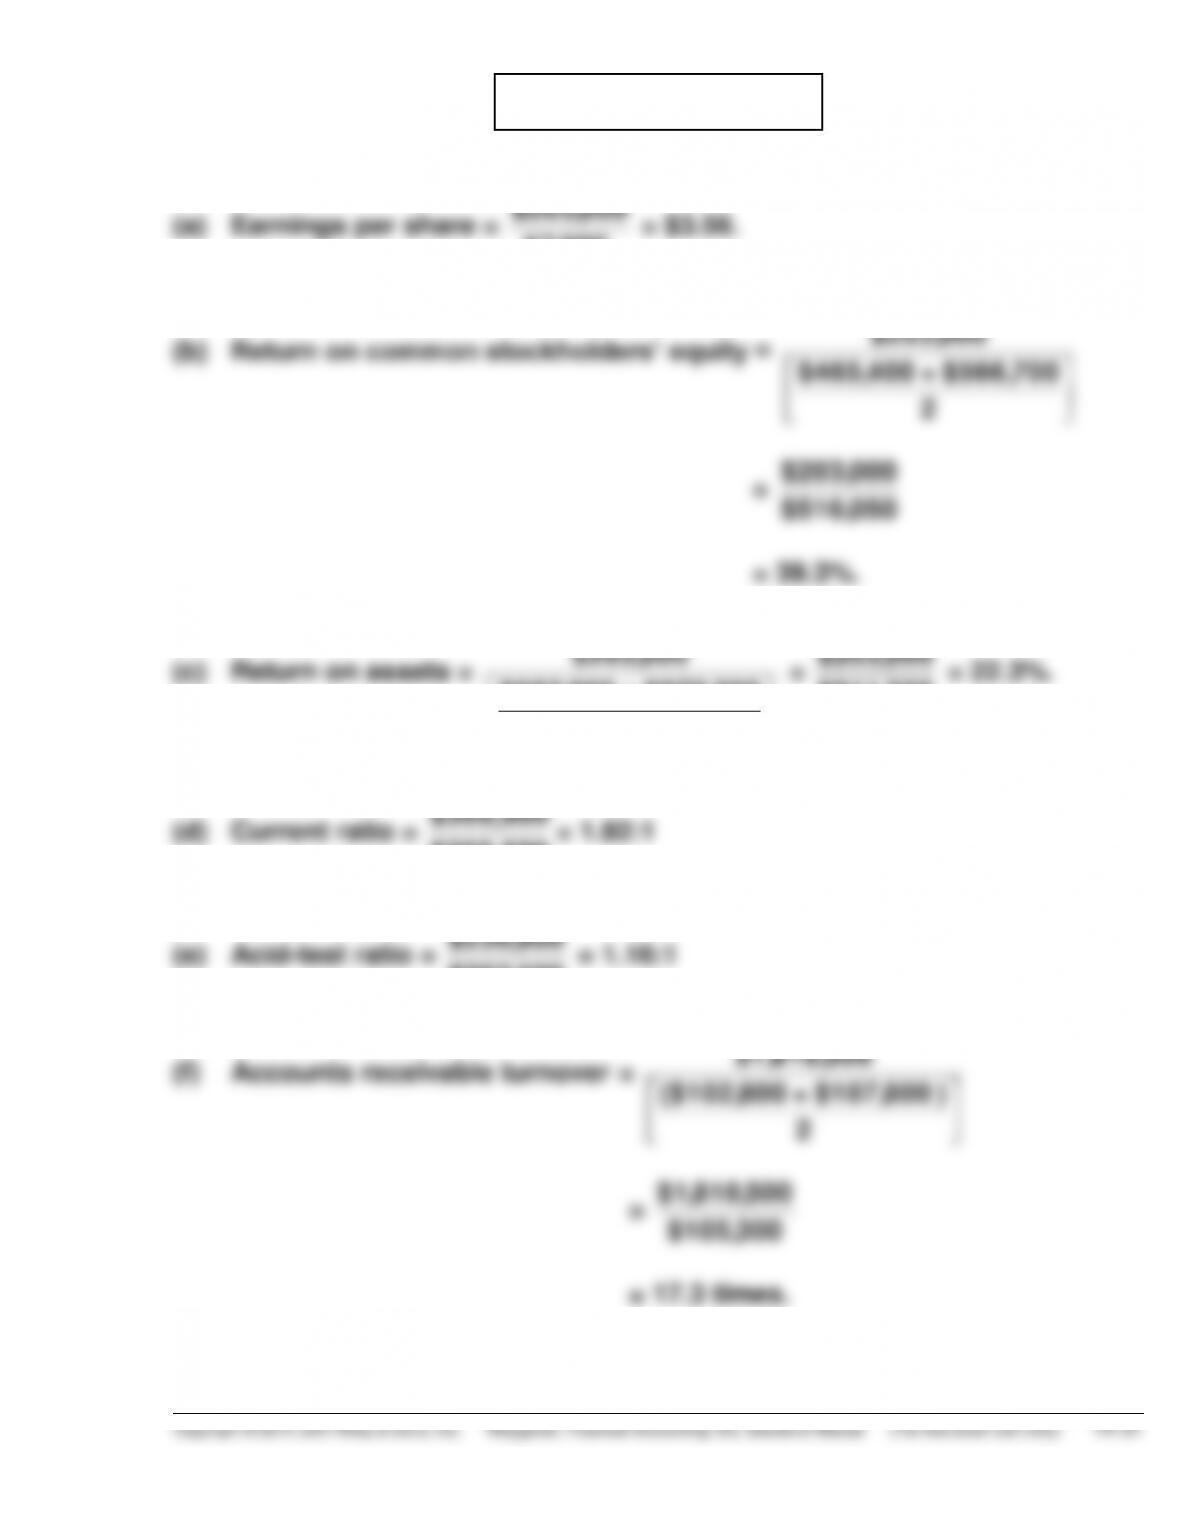
PROBLEM 14-2
(a) Earnings per share =
$203,000
57,000
= $3.56.
(b) Return on common stockholders’ equity =
$203,000
$465,400 + $566,700
2
=
$203,000
$516,050
= 39.3%.
(c) Return on assets =
$203,000
$852,800 + $970,200
2
=
$203,000
$911,500
= 22.3%.
(d) Current ratio =
$203,500
$369,900
= 1.82:1
(e) Acid-test ratio =
$236,900
$203,500
= 1.16:1
(f) Accounts receivable turnover =
$1,818,500
($102,800 + $107,800 )
2
=
$1,818,500
$105,300
= 17.3 times.
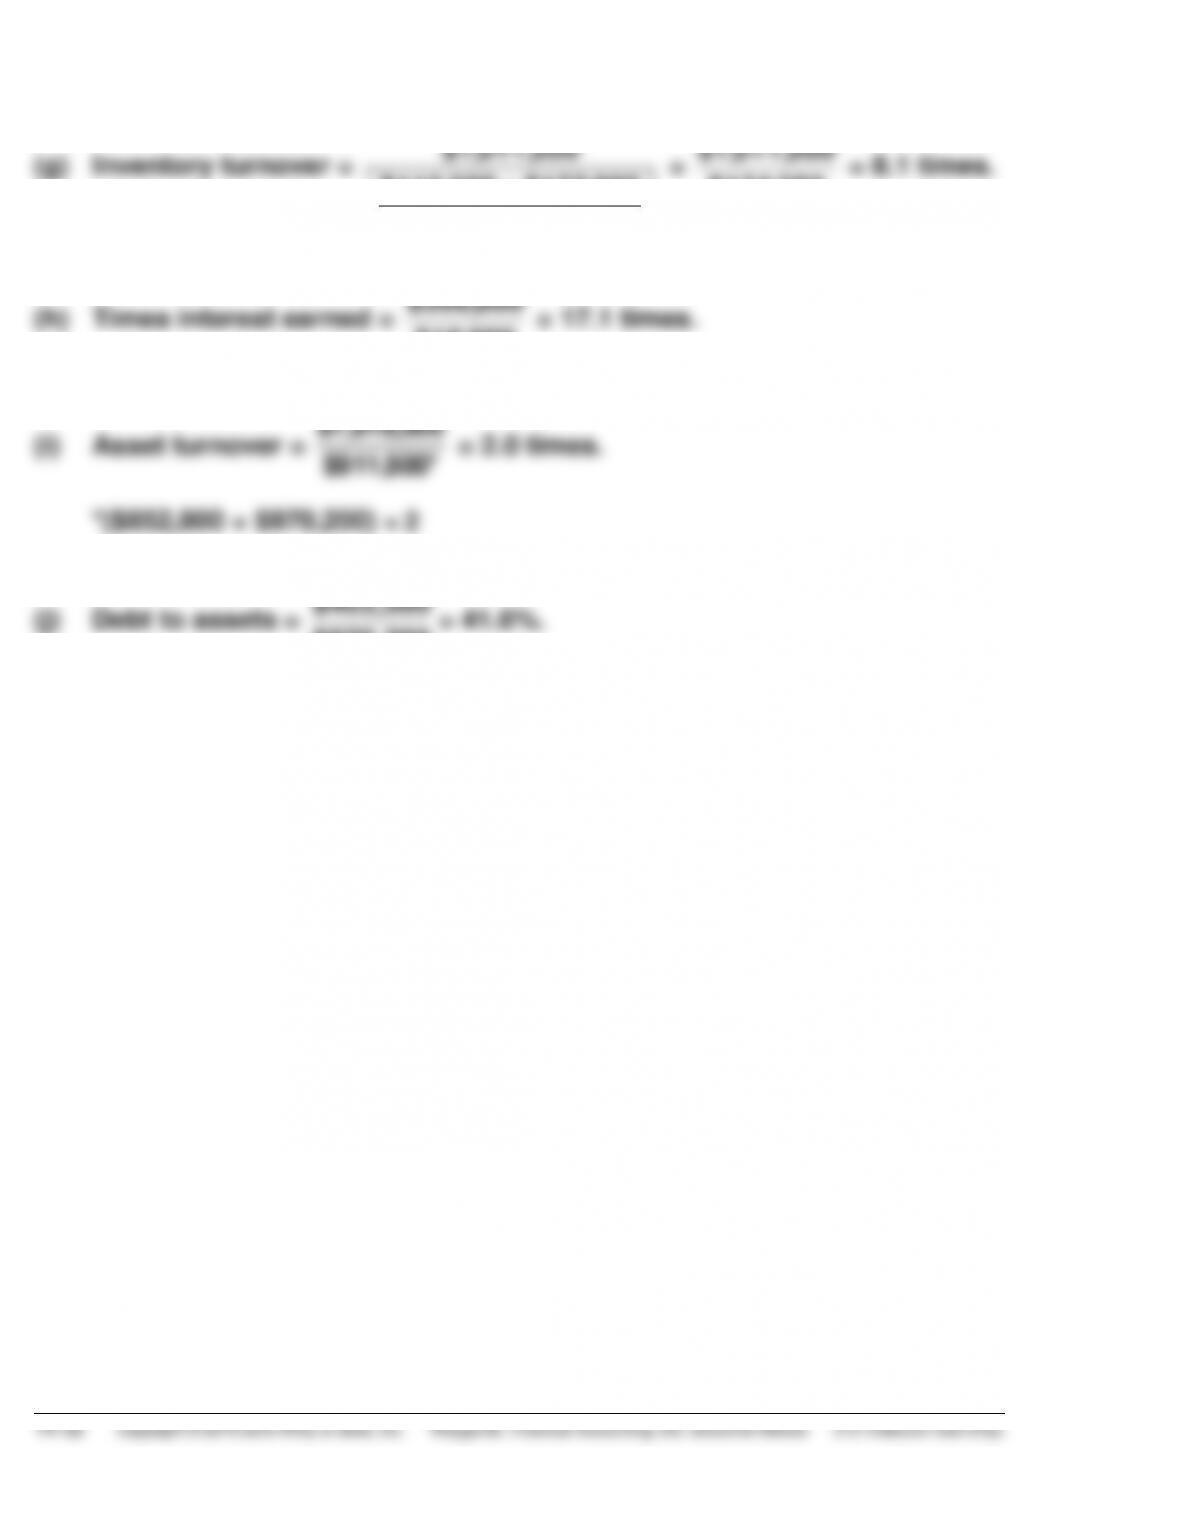
PROBLEM 14-2 (Continued)
(g) Inventory turnover =
$1,011,500
$115,500 + $133,000
2
=
$1,011,500
$124,250
= 8.1 times.
(h) Times interest earned =
$308,000
$18,000
= 17.1 times.
(i) Asset turnover =
$1,818,500
$911,500*
= 2.0 times.
*($852,800 + $970,200) ÷ 2
(j) Debt to assets =
$970,200
$403,500
= 41.6%.
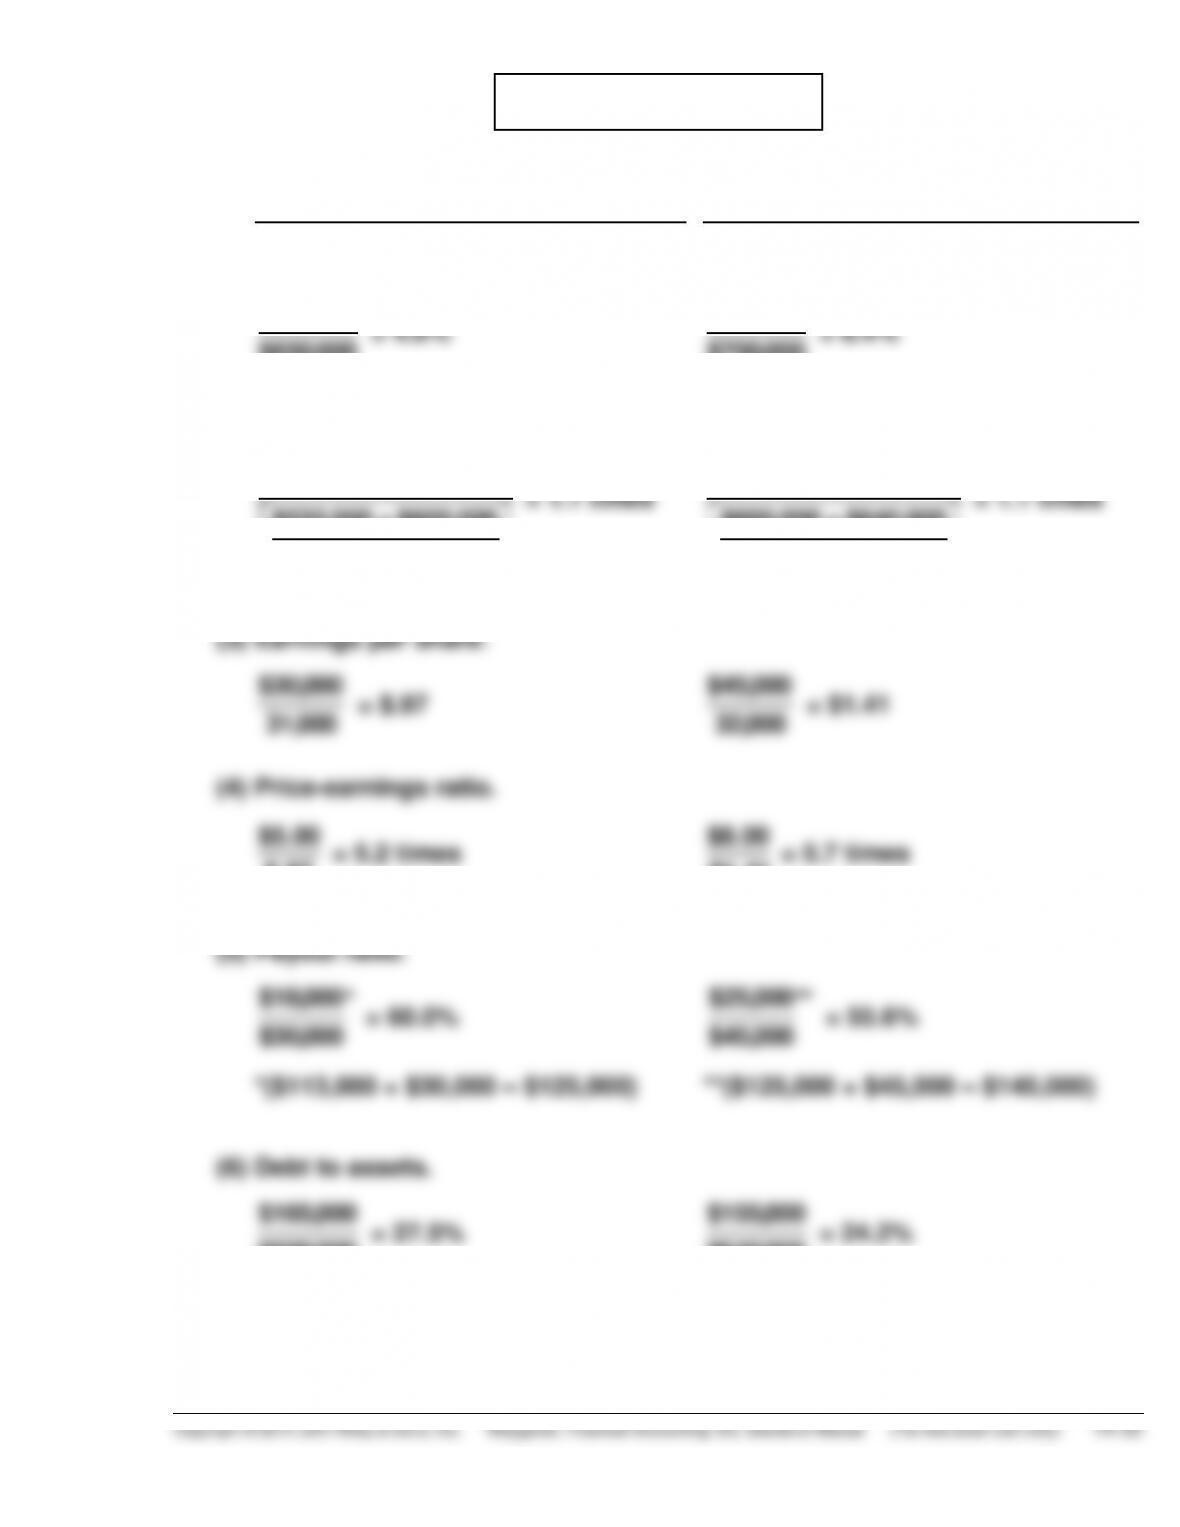
PROBLEM 14-3
(a)
2015
2016
(1)
Profit margin.
$30,000
$650,000
= 4.6%
$45,000
$700,000
= 6.4%
(2)
Asset turnover.
$650,000
$533,000 + $600,000
2
= 1.1 times
$700,000
$600,000 + $640,000
2
= 1.1 times
(3)
Earnings per share.
$30,000
31,000
= $.97
$45,000
32,000
= $1.41
(4)
Price-earnings ratio.
$5.00
$.97
= 5.2 times
$8.00
$1.41
= 5.7 times
(5)
Payout ratio.
$18,000
$30,000
*
= 60.0%
*($113,000 + $30,000 – $125,000)
$25,000
$45,000
**
= 55.6%
**($125,000 + $45,000 – $145,000)
(6)
Debt to assets.
$165,000
$600,000
= 27.5%
$155,000
$640,000
= 24.2%
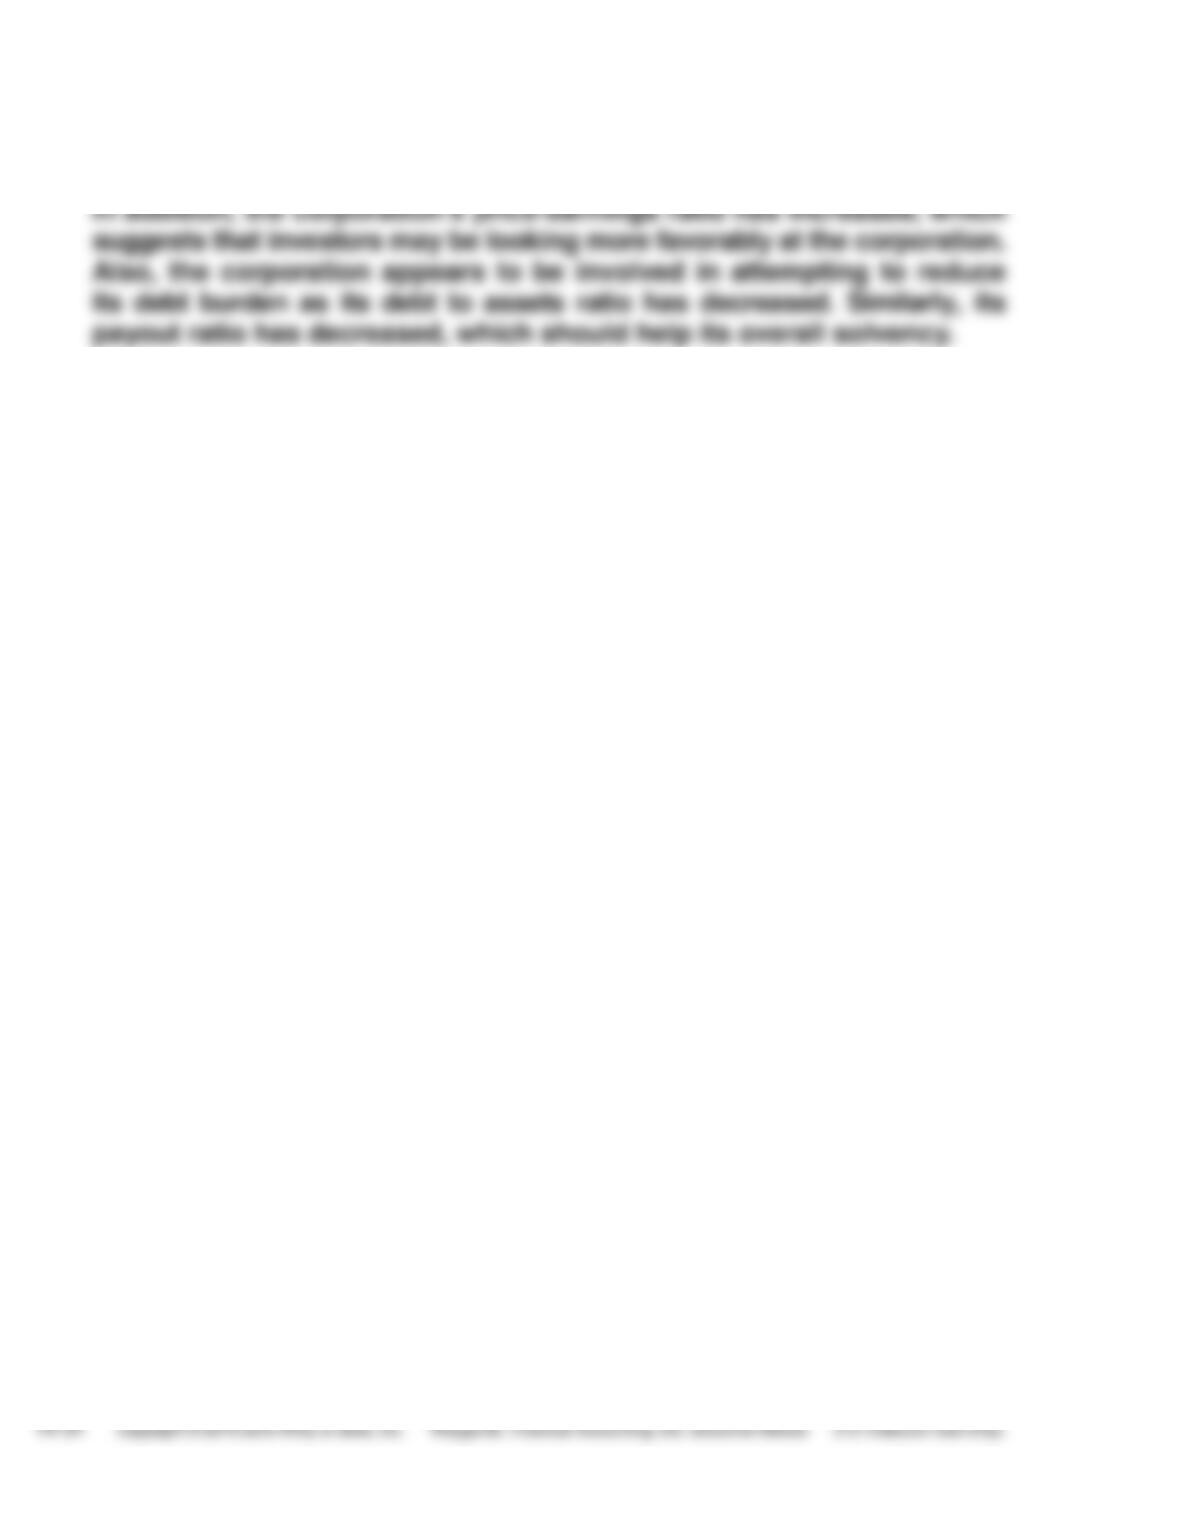
PROBLEM 14-3 (Continued)
(b) The underlying profitability of the corporation appears to have improved.
For example, profit margin and earnings per share have both increased.
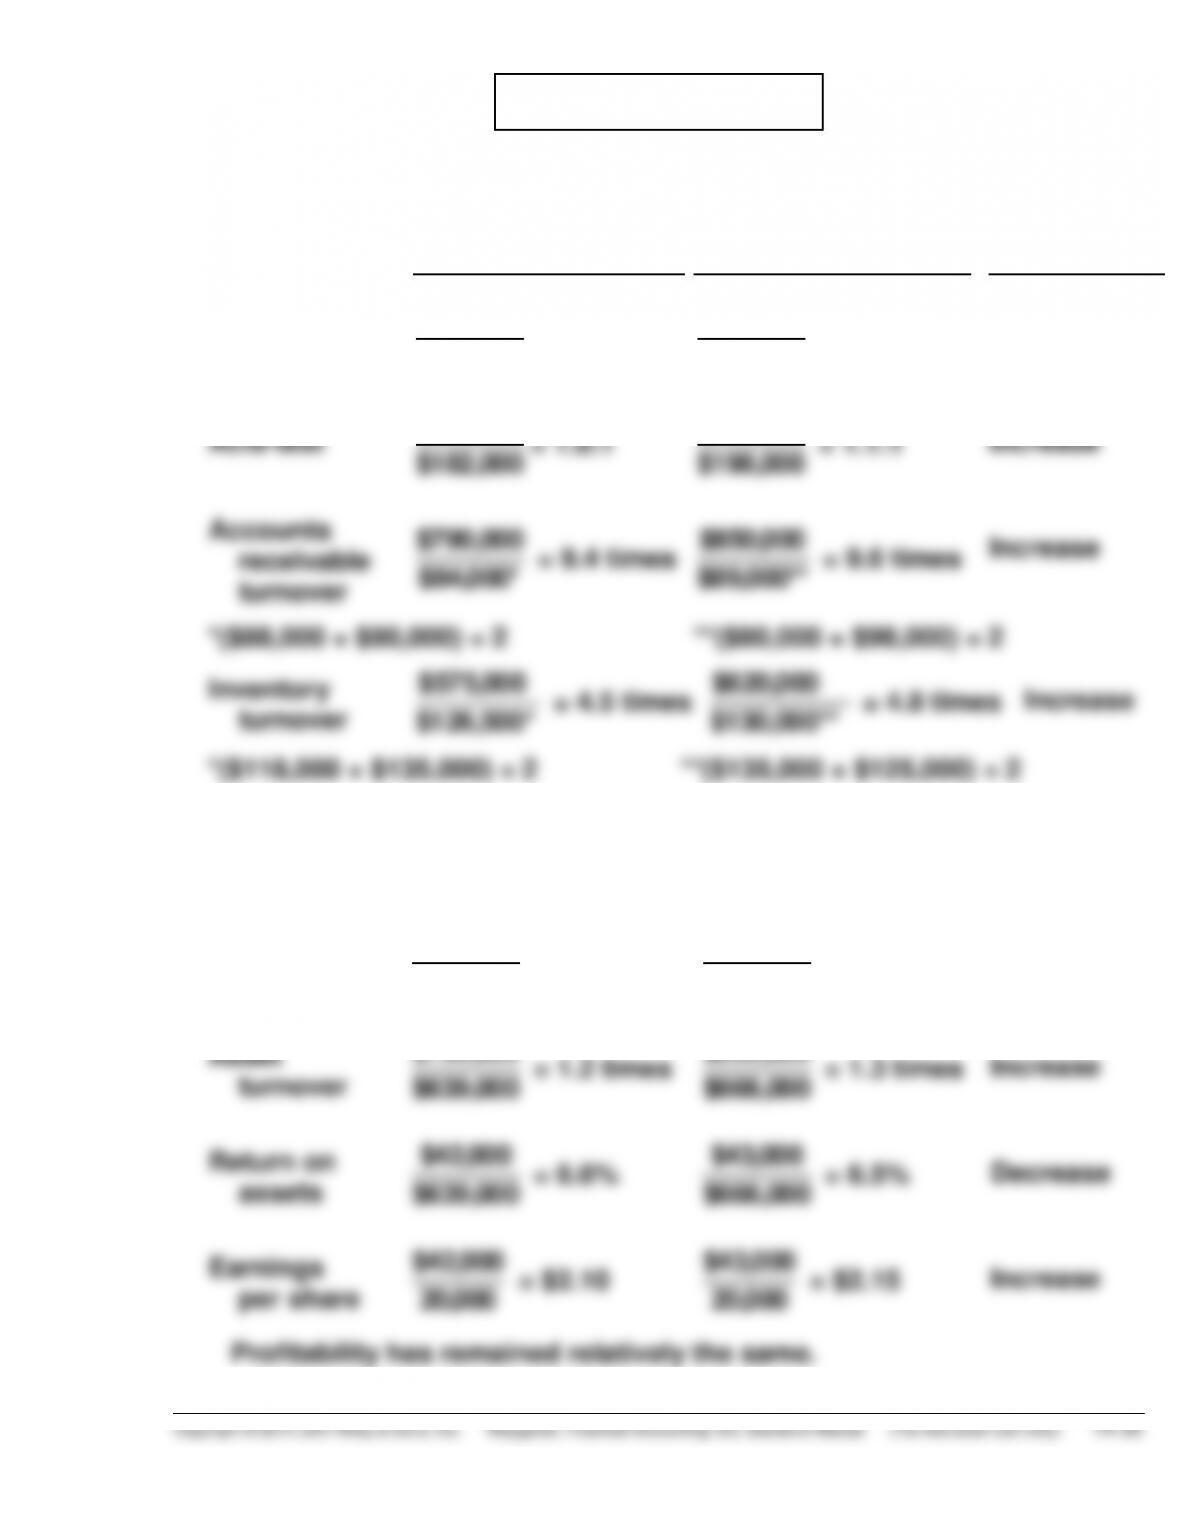
PROBLEM 14-4
(a) LIQUIDITY
2014
2015
Change
Current
$343,000
$182,000
= 1.9:1
$374,000
$198,000
=1.9:1
No change
Acid-test
$185,000
$182,000
= 1.0:1
$220,000
$198,000
= 1.1:1
Increase
Accounts
receivable
turnover
$790,000
$84,000*
= 9.4 times
$850,000
$89,000**
= 9.6 times
Increase
*($88,000 + $80,000) ÷ 2 **($80,000 + $98,000) ÷ 2
Inventory
turnover
$575,000
$126,500*
= 4.5 times
$620,000
$130,000**
= 4.8 times
Increase
*($118,000 + $135,000) ÷ 2 **($135,000 + $125,000) ÷ 2
An overall increase in short-term liquidity has occurred.
PROFITABILITY
Profit
margin
$42,000
$790,000
= 5.3%
$43,000
$850,000
= 5.1%
Decrease
Asset
turnover
$790,000
$639,000
= 1.2 times
$850,000
$666,000
= 1.3 times
Increase
Return on
assets
$42,000
$639,000
= 6.6%
$43,000
$666,000
= 6.5%
Decrease
Earnings
per share
$42,000
20,000
= $2.10
$43,000
20,000
= $2.15
Increase
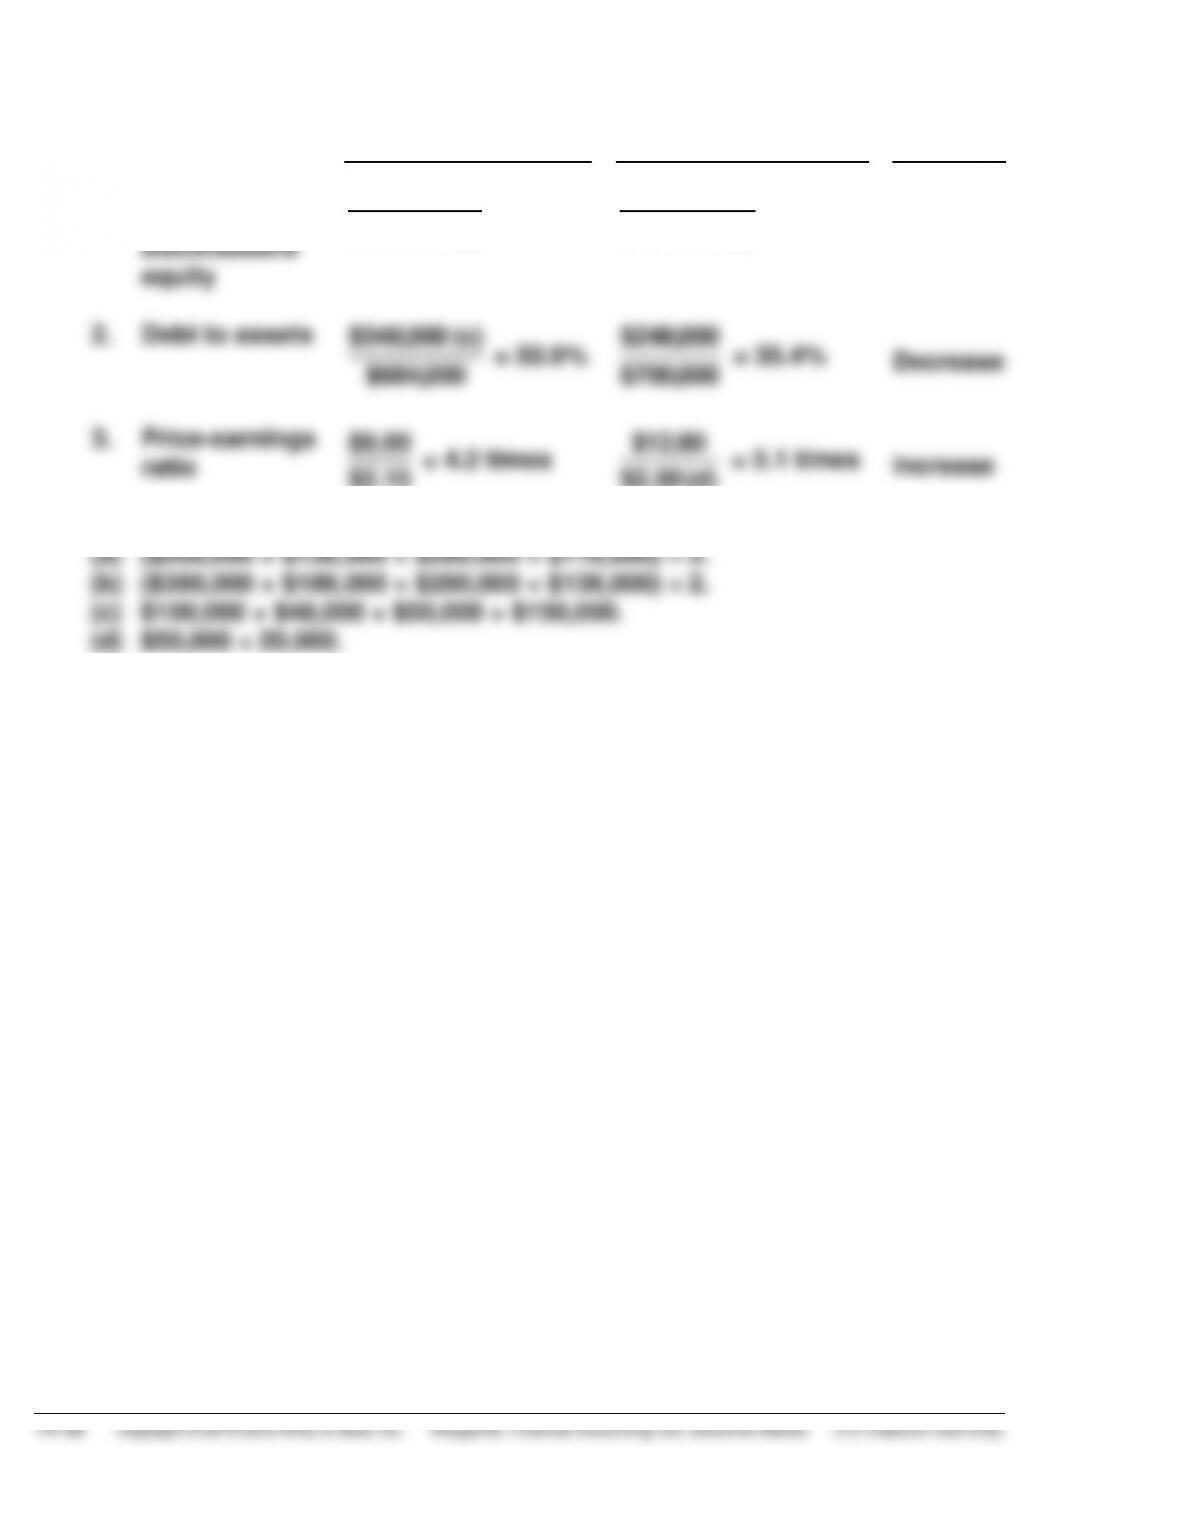
PROBLEM 14-4 (Continued)
(b)
2015
2016
Change
1.
Return on
common
stockholders’
equity
$43,000
$326,000 (a)
= 13.2%
$50,000
$451,000 (b)
= 11.1%
Decrease
2.
Debt to assets
$348,000 (c)
$684,000
= 50.9%
$248,000
$700,000
= 35.4%
Decrease
3.
Price-earnings
ratio
$9.00
$2.15
= 4.2 times
$12.80
$2.50 (d)
= 5.1 times
Increase
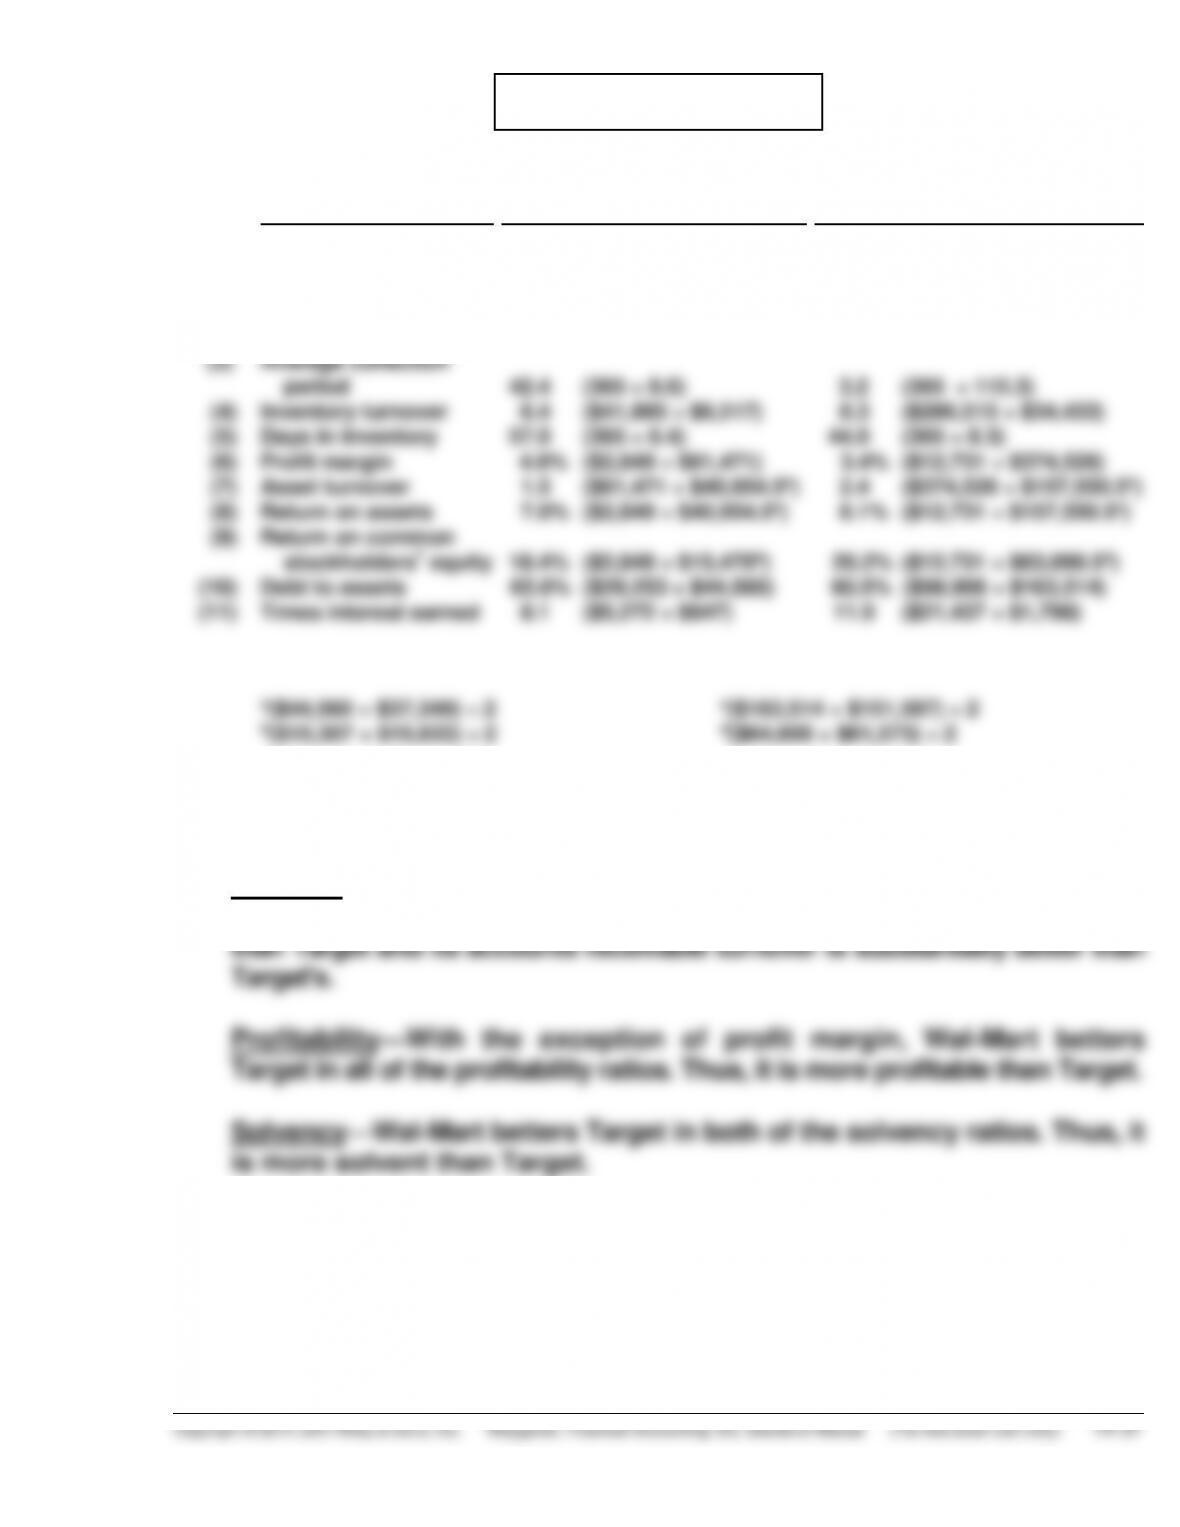
PROBLEM 14-5
(a)
Ratio
Target
Wal-Mart
(All Dollars Are in Millions)
(1)
(2)
(3)
(4)
(5)
(6)
(7)
(8)
(9)
(10)
(11)
Current
Accounts receivable
turnover
Average collection
period
Inventory turnover
Days in inventory
Profit margin
Asset turnover
Return on assets
Return on common
stockholders’ equity
Debt to assets
Times interest earned
1.6:1 ($18,906 ÷ $11,782)
8.6 ($61,471 ÷ $7,124)
42.4 (365 ÷ 8.6)
6.4 ($41,895 ÷ $6,517)
57.0 (365 ÷ 6.4)
4.6% ($2,849 ÷ $61,471)
1.5 ($61,471 ÷ $40,954.5a)
7.0 % ($2,849 ÷ $40,954.5a)
18.4 % ($2,849 ÷ $15,470b)
65.6% ($29,253 ÷ $44,560)
8.1 ($5,272 ÷ $647)
.8:1 ($47,585 ÷ $58,454)
115.3 ($374,526 ÷ $3,247)
3.2 (365 ÷ 115.3)
8.3 ($286,515 ÷ $34,433)
44.0 (365 ÷ 8.3)
3.4% ($12,731 ÷ $374,526)
2.4 ($374,526 ÷ $157,550.5c)
8.1 % ($12,731 ÷ $157,550.5c)
20.2% ($12,731 ÷ $63,090.5d)
60.5% ($98,906 ÷ $163,514)
11.9 ($21,437 ÷ $1,798)
a($44,560 + $37,349) ÷ 2 c($163,514 + $151,587) ÷ 2
b($15,307 + $15,633) ÷ 2 d($64,608 + $61,573) ÷ 2
(b) The comparison of the two companies shows the following:
Liquidity—Target’s current ratio of 1.6:1 is significantly better than
Wal-Mart’s .8:1. However, Wal-Mart has a better inventory turnover ratio
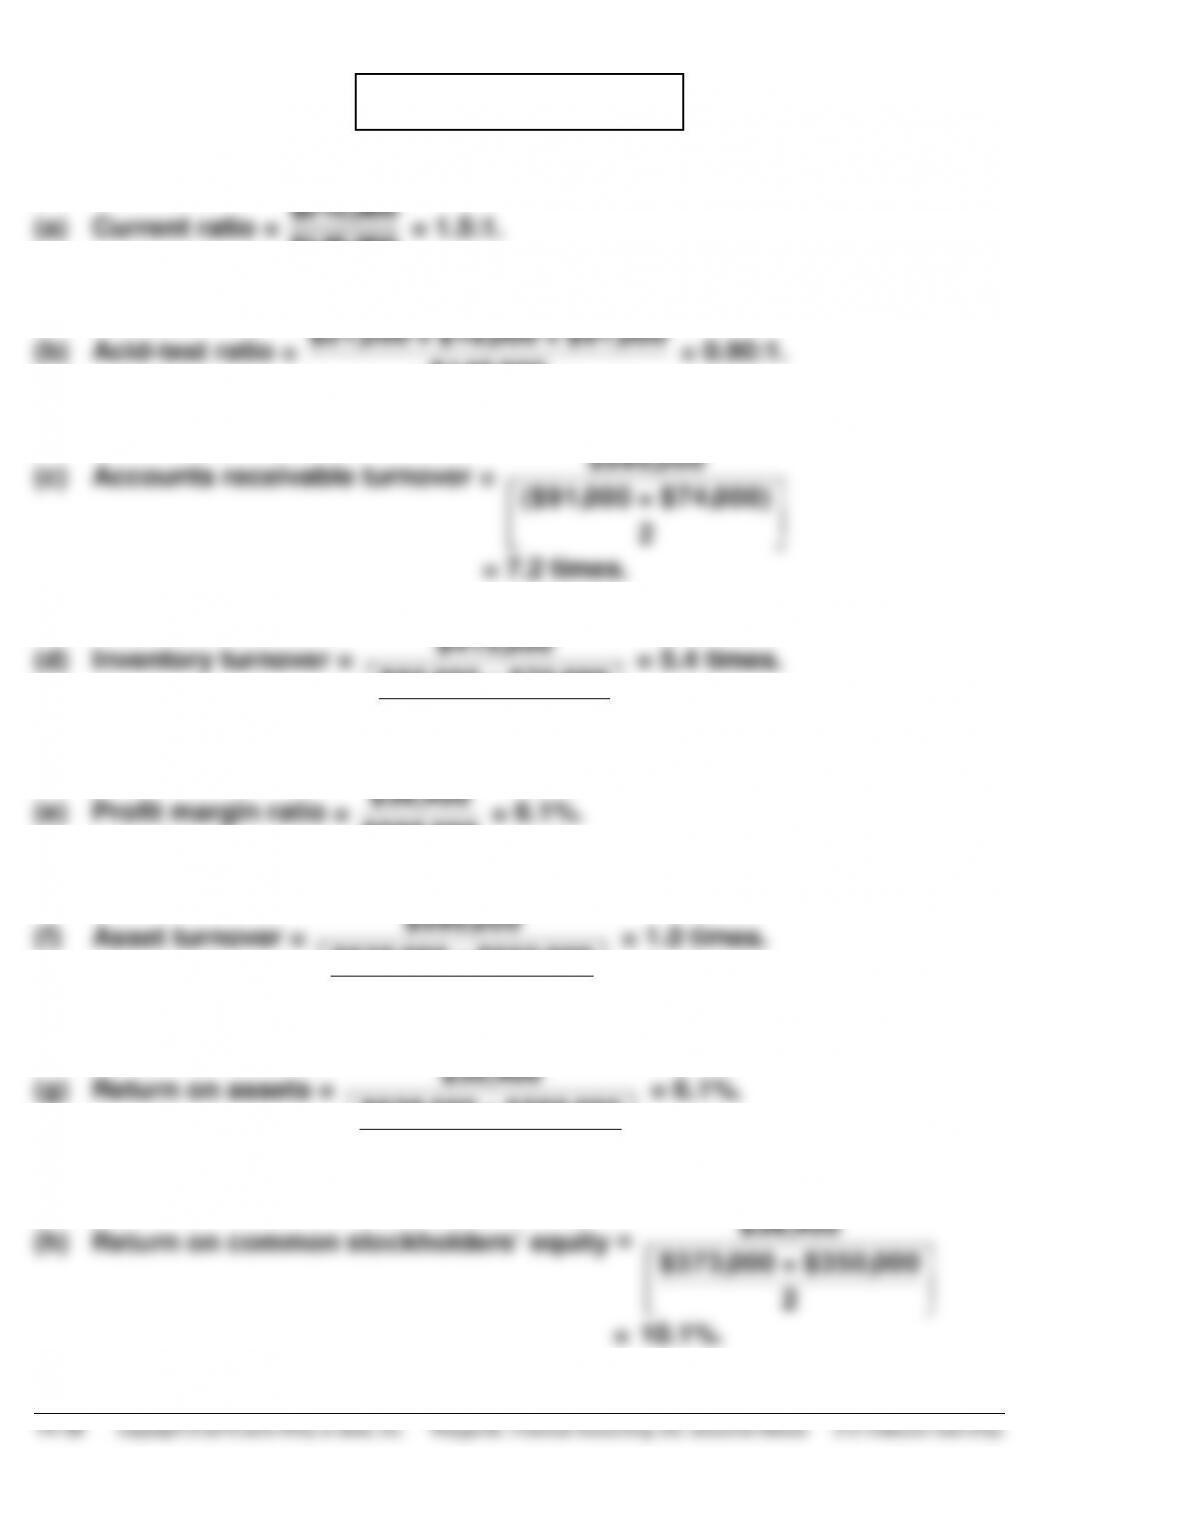
PROBLEM 14-6
(a) Current ratio =
$215,000
$145,000
= 1.5:1.
(b) Acid-test ratio =
$21,000 + $18,000 + $91,000
$145,000
= 0.90:1.
(c) Accounts receivable turnover =
$595,000
($91,000 + $74,000)
2
= 7.2 times.
(d) Inventory turnover =
$415,000
$85,000 + $70,000
2
= 5.4 times.
(e) Profit margin ratio =
$36,400
$595,000
= 6.1%.
(f) Asset turnover =
$595,000
$638,000 + $560,000
2
= 1.0 times.
(g) Return on assets =
$36,400
$638,000 + $560,000
2
= 6.1%.
(h) Return on common stockholders’ equity =
$36,400
$373,000 + $350,000
2
= 10.1%.
PROBLEM 14-6 (Continued)
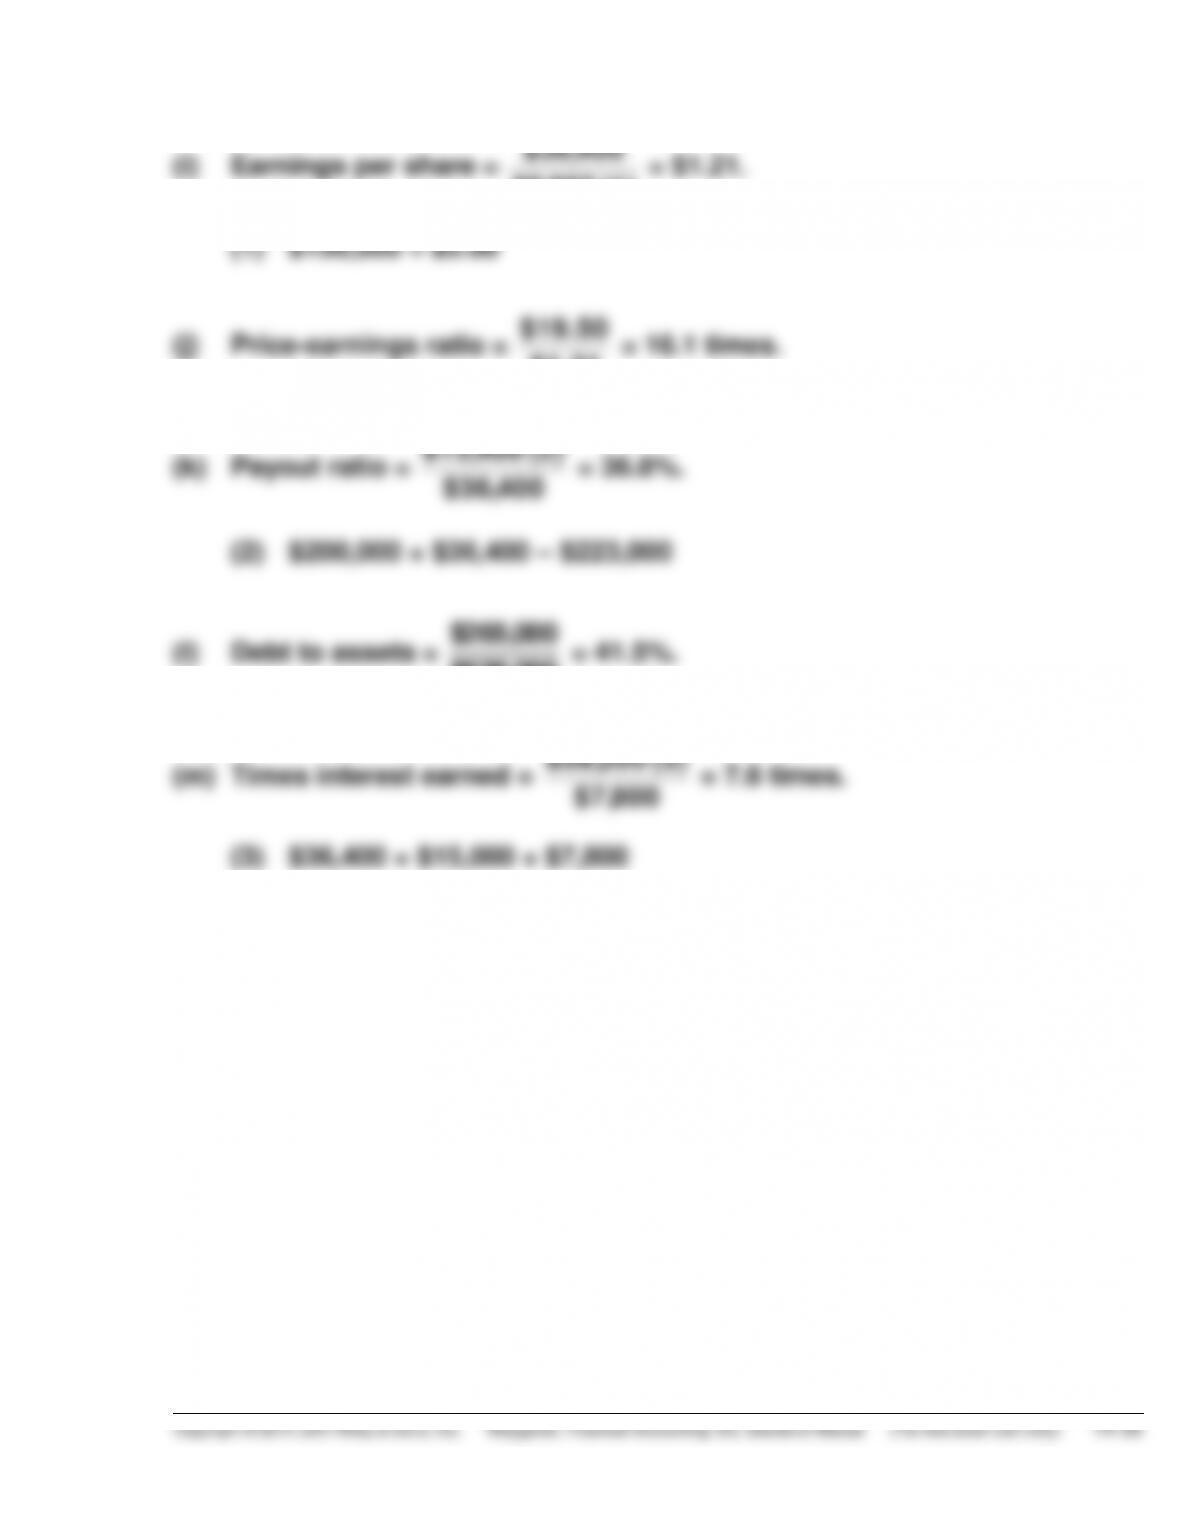
(i) Earnings per share =
$36,400
30,000 (1)
= $1.21.
$1.21
(k) Payout ratio =
$13,400 (2)
$36,400
= 36.8%.
(2) $200,000 + $36,400 – $223,000
(l) Debt to assets =
$265,000
$638,000
= 41.5%.
(m) Times interest earned =
$59,200 (3)
$7,800
= 7.6 times.
(3) $36,400 + $15,000 + $7,800
PROBLEM 14-7
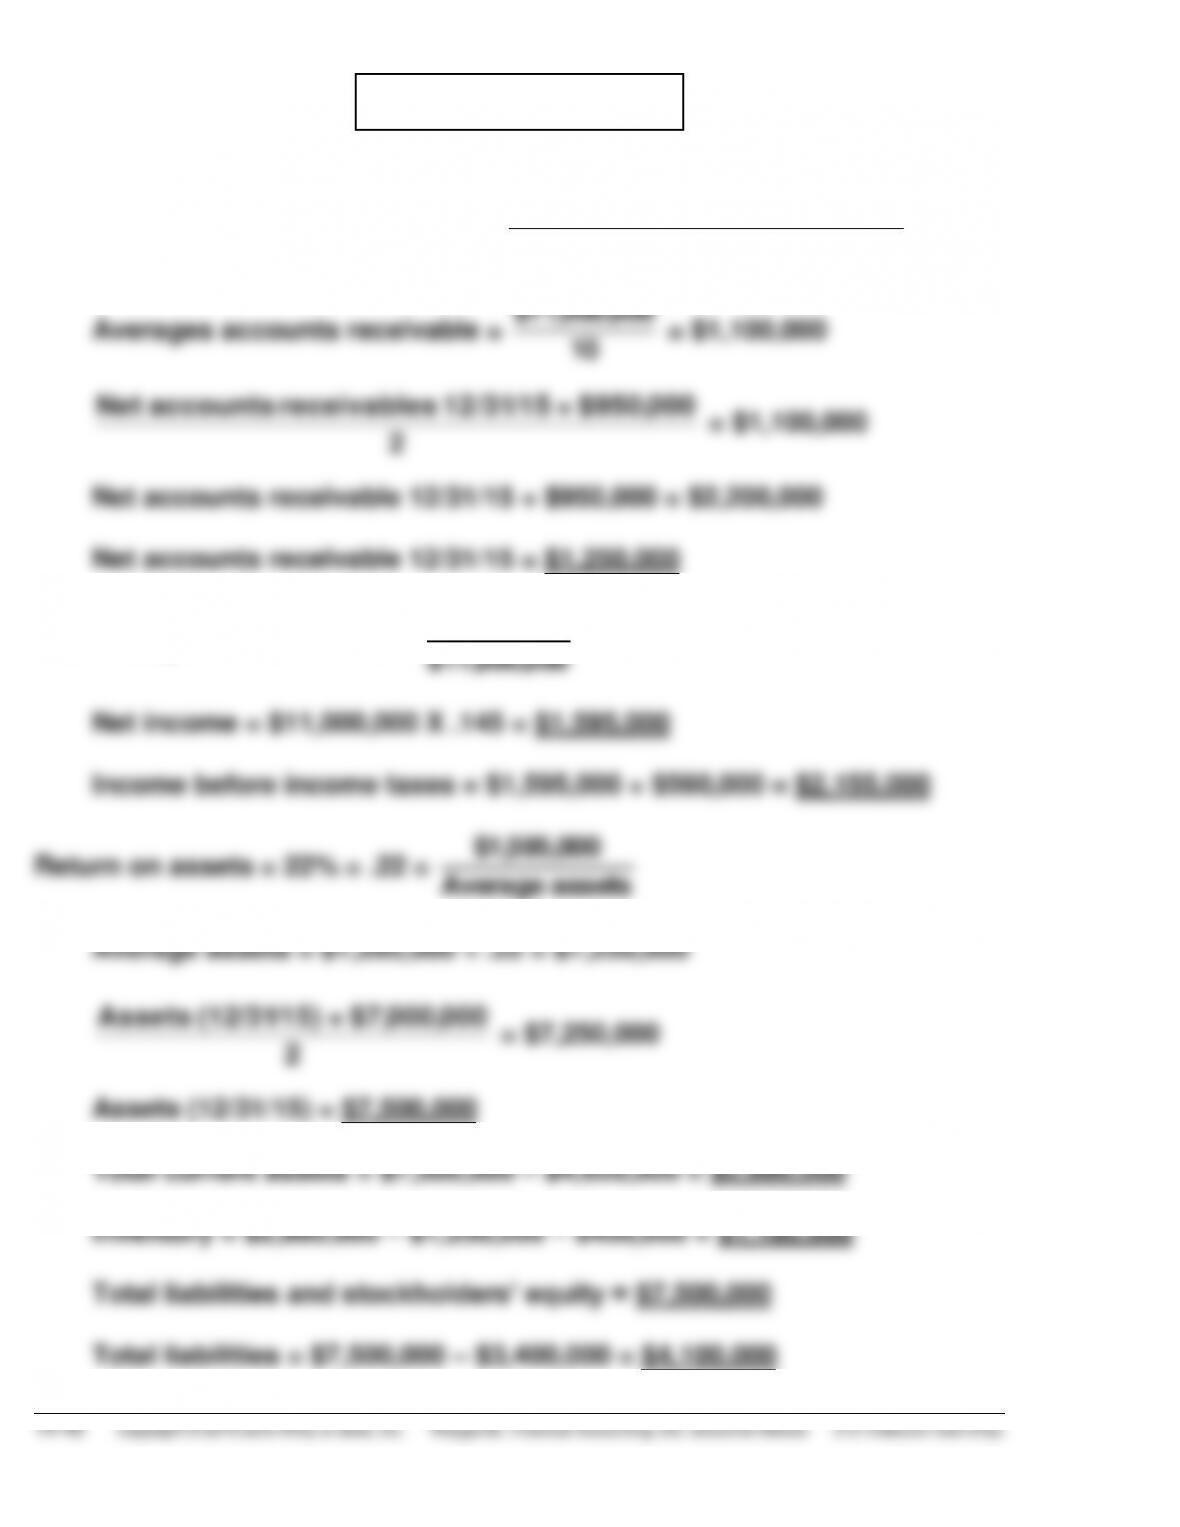
Accounts receivable turnover = 10 =
$11,000,000
Average accounts receivable
Averages accounts receivable =
$11,000,000
10
= $1,100,000
Net accounts receivables 12/31/15 + $950,000
2
= $1,100,000
Net accounts receivable 12/31/15 + $950,000 = $2,200,000
Net accounts receivable 12/31/15 = $1,250,000
Profit margin = 14.5% = .145 =
Net income
$11,000,000
Net income = $11,000,000 X .145 = $1,595,000
Income before income taxes = $1,595,000 + $560,000 = $2,155,000
Return on assets = 22% = .22 =
$1,595,000
Average assets


