Unlock document.
This document is partially blurred.
Unlock all pages and 1 million more documents.
Get Access
EXERCISE 14-2
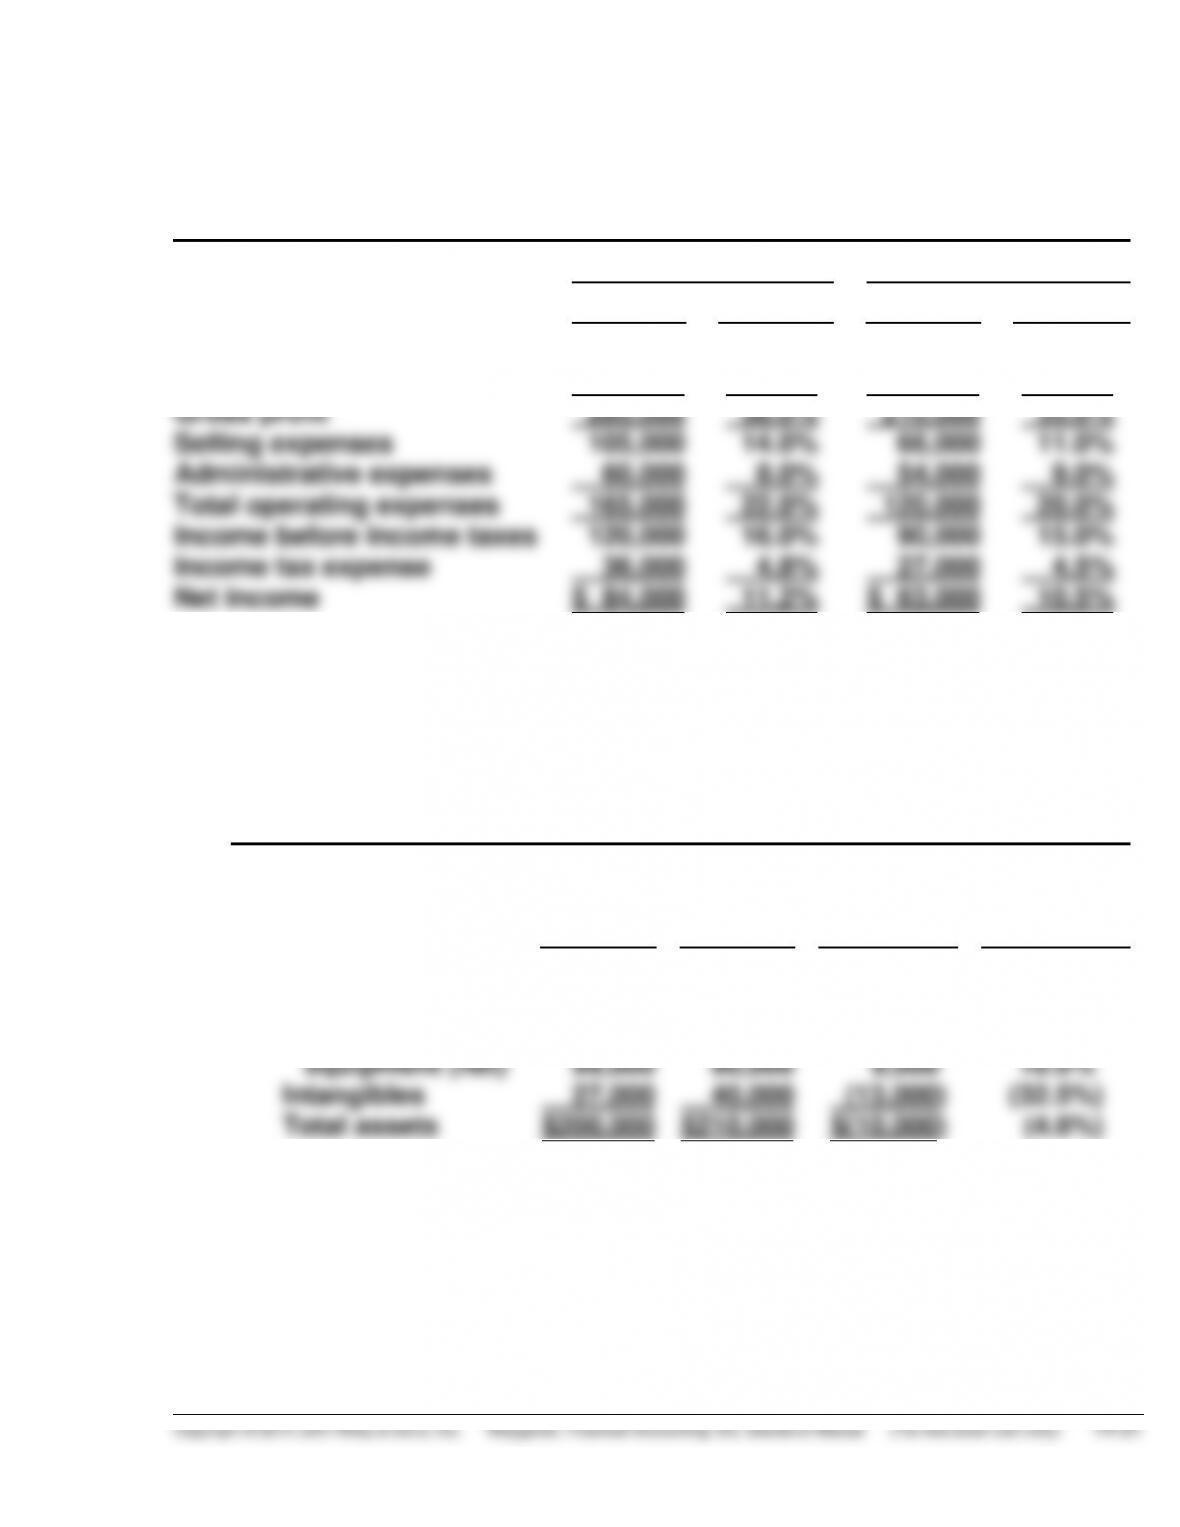
NAVARRO CORPORATION
Condensed Income Statements
For the Years Ended December 31
2015
2014
Amount
Percent
Amount
Percent
Net sales
Cost of goods sold
Gross profit
Selling expenses
Administrative expenses
Total operating expenses
Income before income taxes
Income tax expense
Net income
$750,000
465,000
285,000
105,000
60,000
165,000
120,000
36,000
$ 84,000
100.0%
62.0%
38.0%
14.0%
8.0%
22.0%
16.0%
4.8%
11.2%
$600,000
390,000
210,000
66,000
54,000
120,000
90,000
27,000
$ 63,000
100.0%
65.0%
35.0%
11.0%
9.0%
20.0%
15.0%
4.5%
10.5%
EXERCISE 14-3
(a) GURLEY CORPORATION
Condensed Balance Sheets
December 31
2015
2014
Increase
(Decrease)
Percentage
Change
from 2014
Assets
Current assets
Property, plant &
equipment (net)
Intangibles
Total assets
$ 74,000
99,000
27,000
$200,000
$ 80,000
90,000
40,000
$210,000
$ (6,000)
( 9,000)
(13,000)
$(10,000)
(7.5%)
(10.0%)
(32.5%)
(4.8%)
EXERCISE 14-3 (Continued)
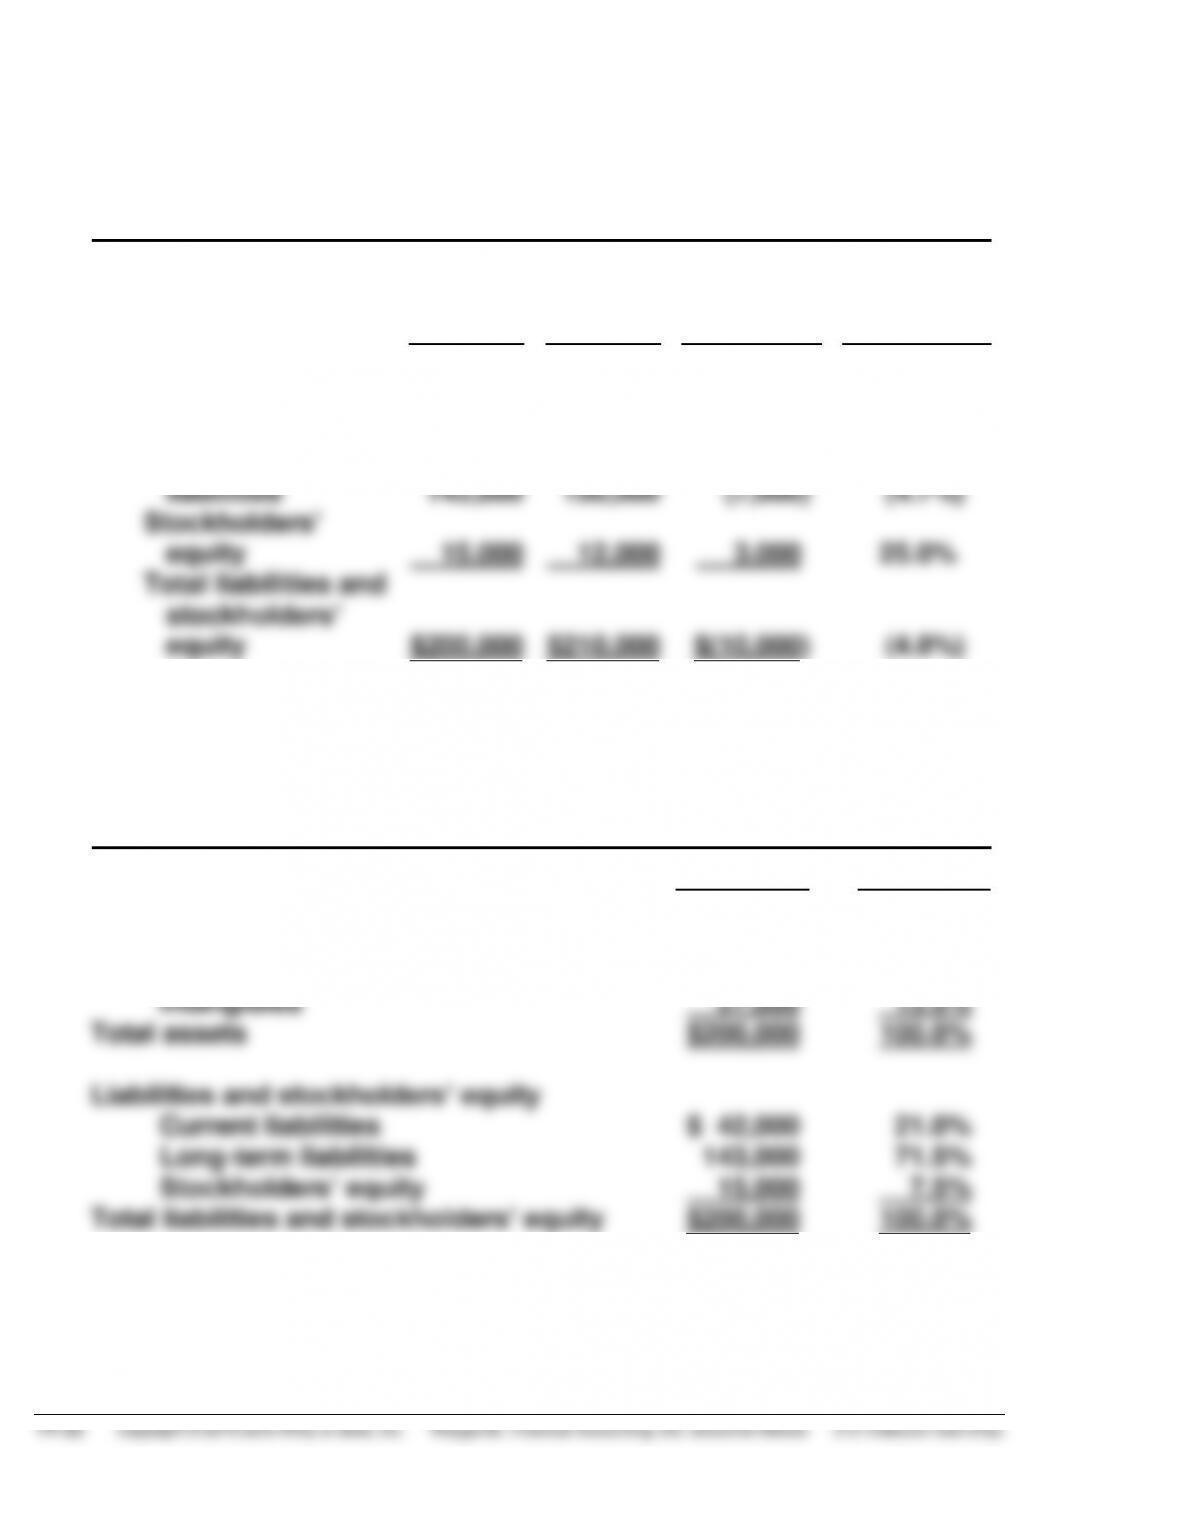
GURLEY CORPORATION
Condensed Balance Sheets (Continued)
December 31
2015
2014
Increase
(Decrease)
Percentage
Change
from 2015
Liabilities and stock-
holders’ equity
Current liabilities
Long-term
liabilities
Stockholders’
equity
Total liabilities and
stockholders’
equity
$ 42,000
143,000
15,000
$200,000
$ 48,000
150,000
12,000
$210,000
$ (6,000)
(7,000)
3,000)
$(10,000)
(12.5%)
(4.7%)
(25.0%)
(4.8%)
(b) GURLEY CORPORATION
Condensed Balance Sheet
December 31, 2015
Amount
Percent
Assets
Current assets
Property, plant, and equipment (net)
Intangibles
Total assets
Liabilities and stockholders’ equity
Current liabilities
Long-term liabilities
Stockholders’ equity
Total liabilities and stockholders’ equity
$ 74,000
99,000
27,000
$200,000
$ 42,000
143,000
15,000
$200,000
37.0%
49.5%
13.5%
100.0%
21.0%
71.5%
7.5%
100.0%
EXERCISE 14-4
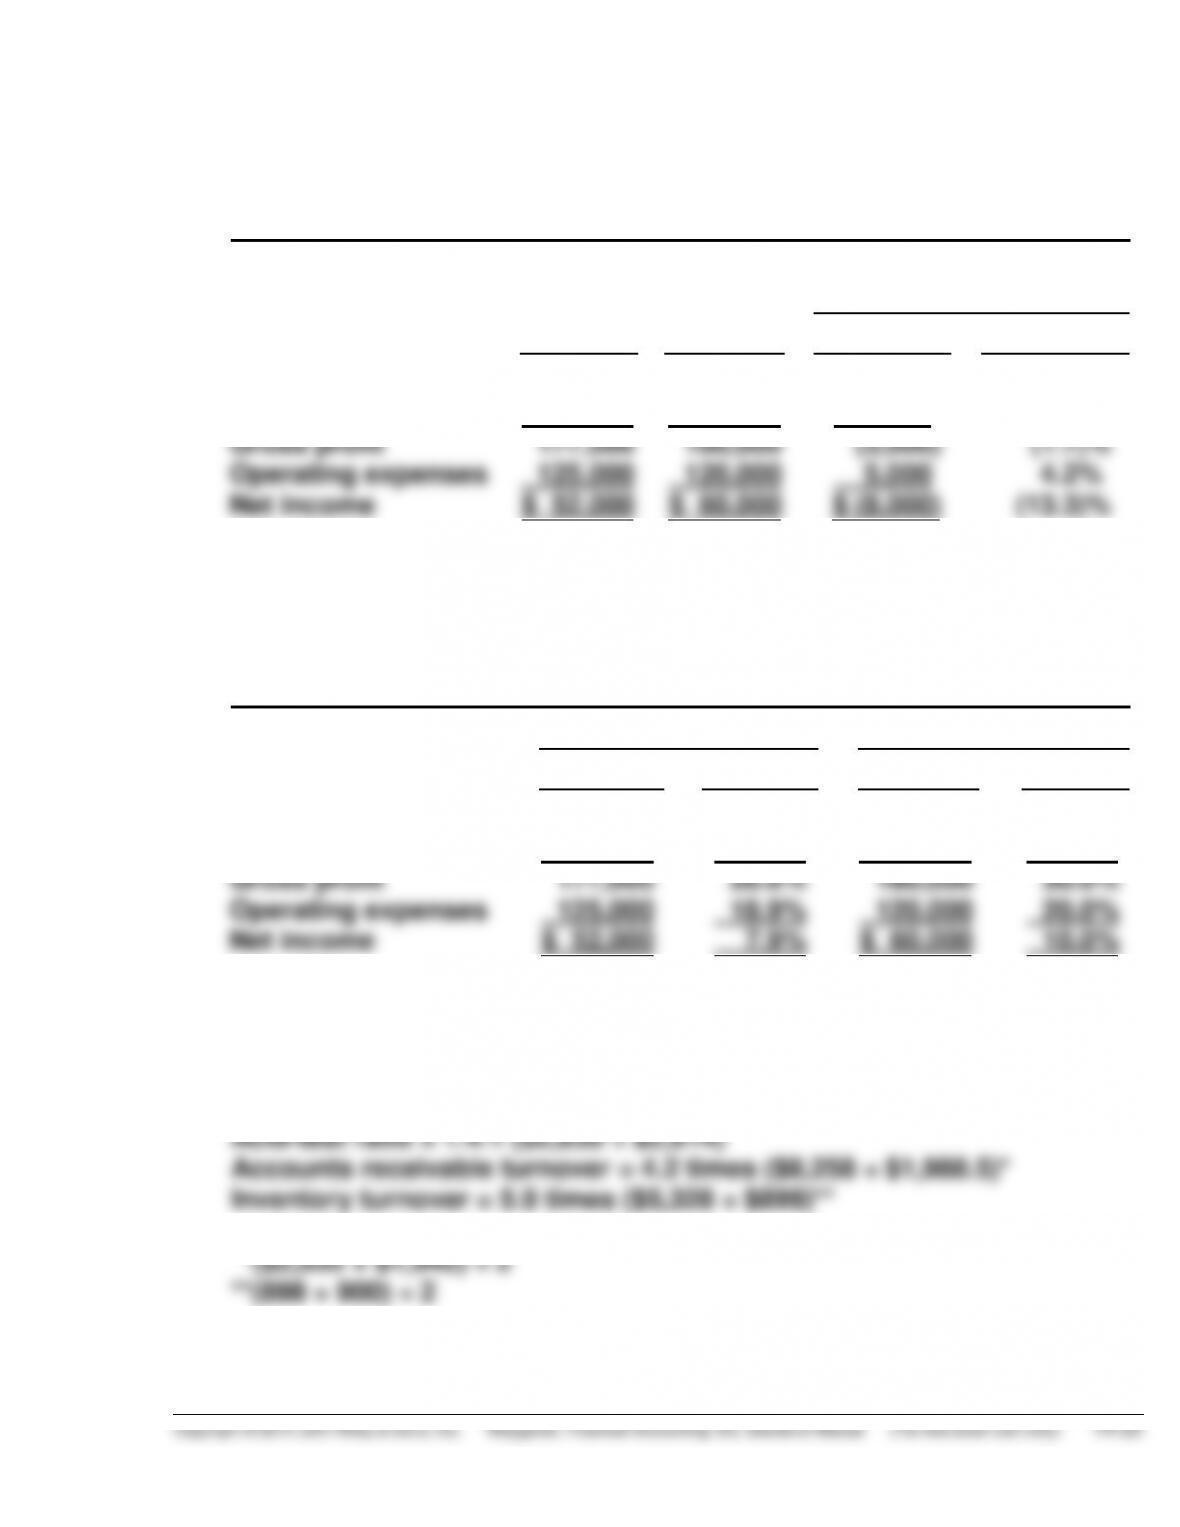
(a) EMLEY CORPORATION
Condensed Income Statements
For the Years Ended December 31
Increase or (Decrease)
During 2015
2016
2015
Amount
Percentage
Net sales
Cost of goods sold
Gross profit
Operating expenses
Net income
$660,000
483,000
177,000
125,000
$ 52,000
$600,000
420,000
180,000
120,000
$ 60,000
$60,000
63,000
(3,000)
5,000
$ (8,000)
10.0%
15.0%
(1.7)%
4.2%
(13.3)%
(b) EMLEY CORPORATION
Condensed Income Statements
For the Years Ended December 31
2015
2014
Amount
Percent
Amount
Percent
Net sales
Cost of goods sold
Gross profit
Operating expenses
Net income
$660,000
483,000
177,000
125,000
$ 52,000
100.0%
73.2%
26.8%
18.9%
7.9%
$600,000
420,000
180,000
120,000
$ 60,000
100.0%
70.0%
30.0%
20.0%
10.0%
EXERCISE 14-5
(a) Current ratio = 2.0:1 ($4,054 ÷ $2,014)
EXERCISE 14-5 (Continued)
(b)
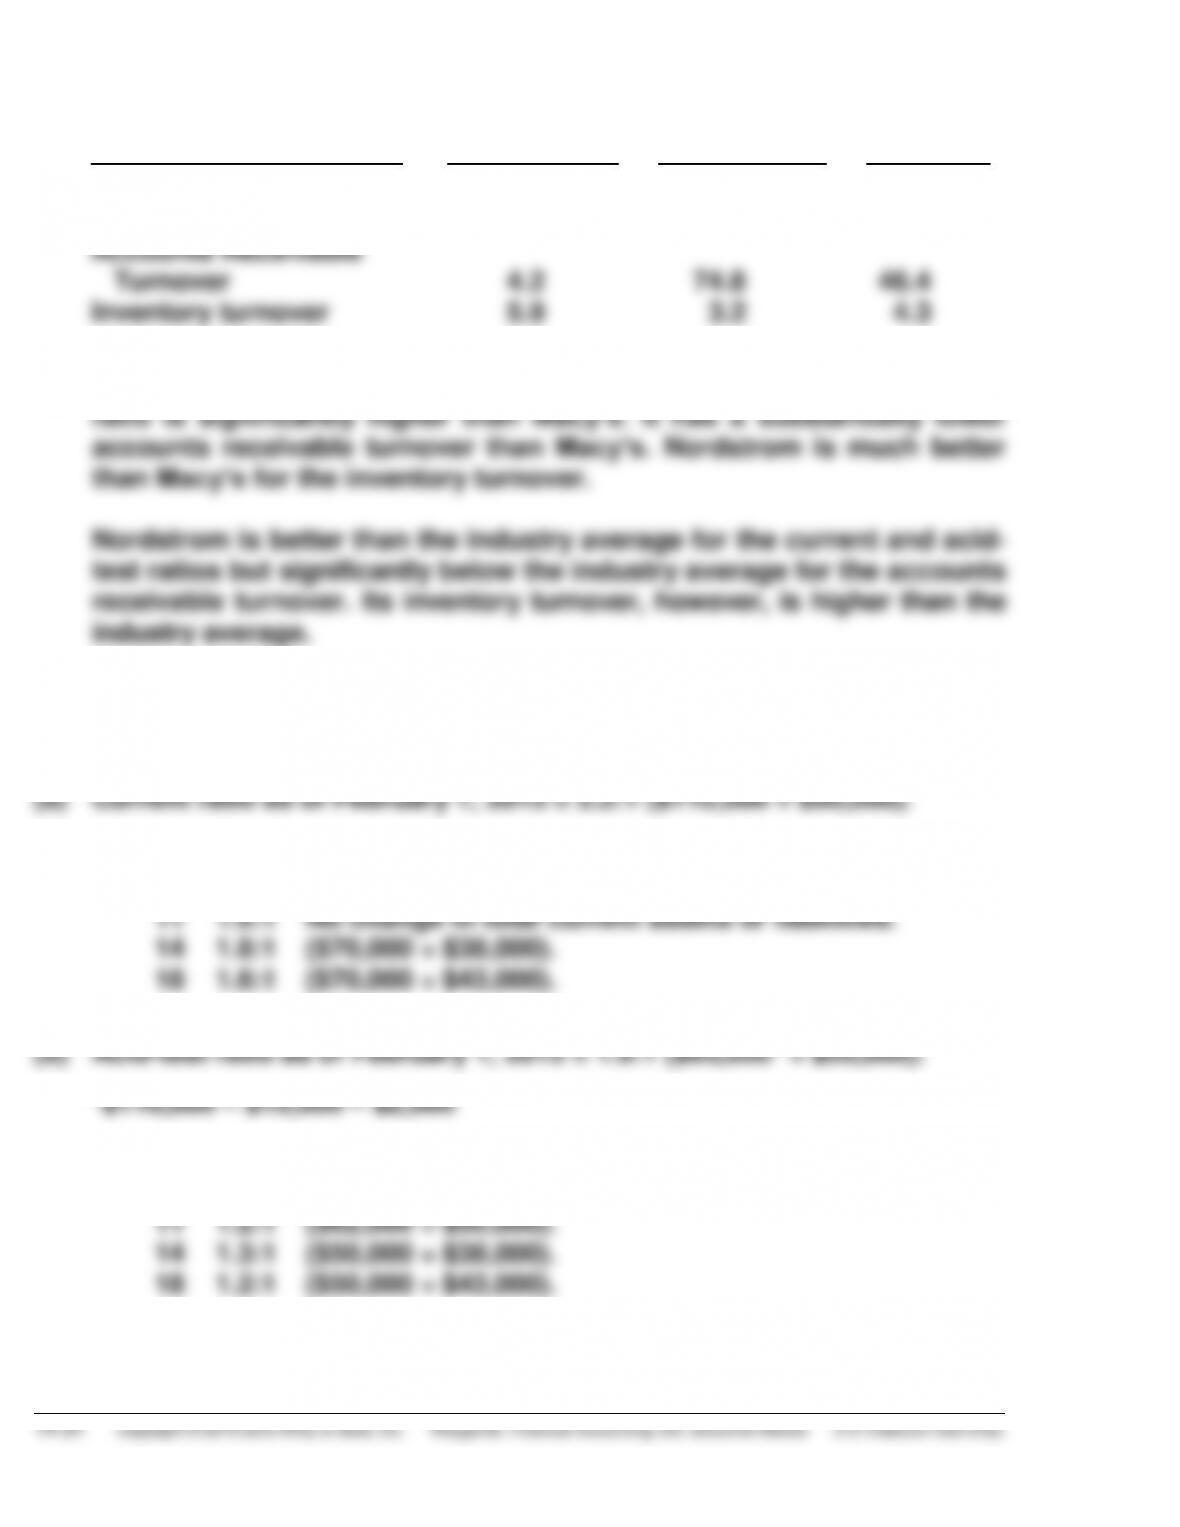
Ratio
Nordstrom
Macy’s
Industry
Current
Acid-test
Accounts Receivable
Turnover
Inventory turnover
2.0:1
1.4:1
4.2
5.9
1.40:1
0.51:1
74.8
3.2
1.70:1
.70:1
46.4
4.3
Nordstrom is better than Macy’s for the current ratio and its acid-test
EXERCISE 14-6
Feb. 3 2.2:1 No change in total current assets or liabilities.
7 1.6:1 ($82,000 ÷ $50,000).
Feb. 3 1.9:1 No change in total quick assets or current liabilities.
7 1.3:1 ($65,000 ÷ $50,000).
EXERCISE 14-7
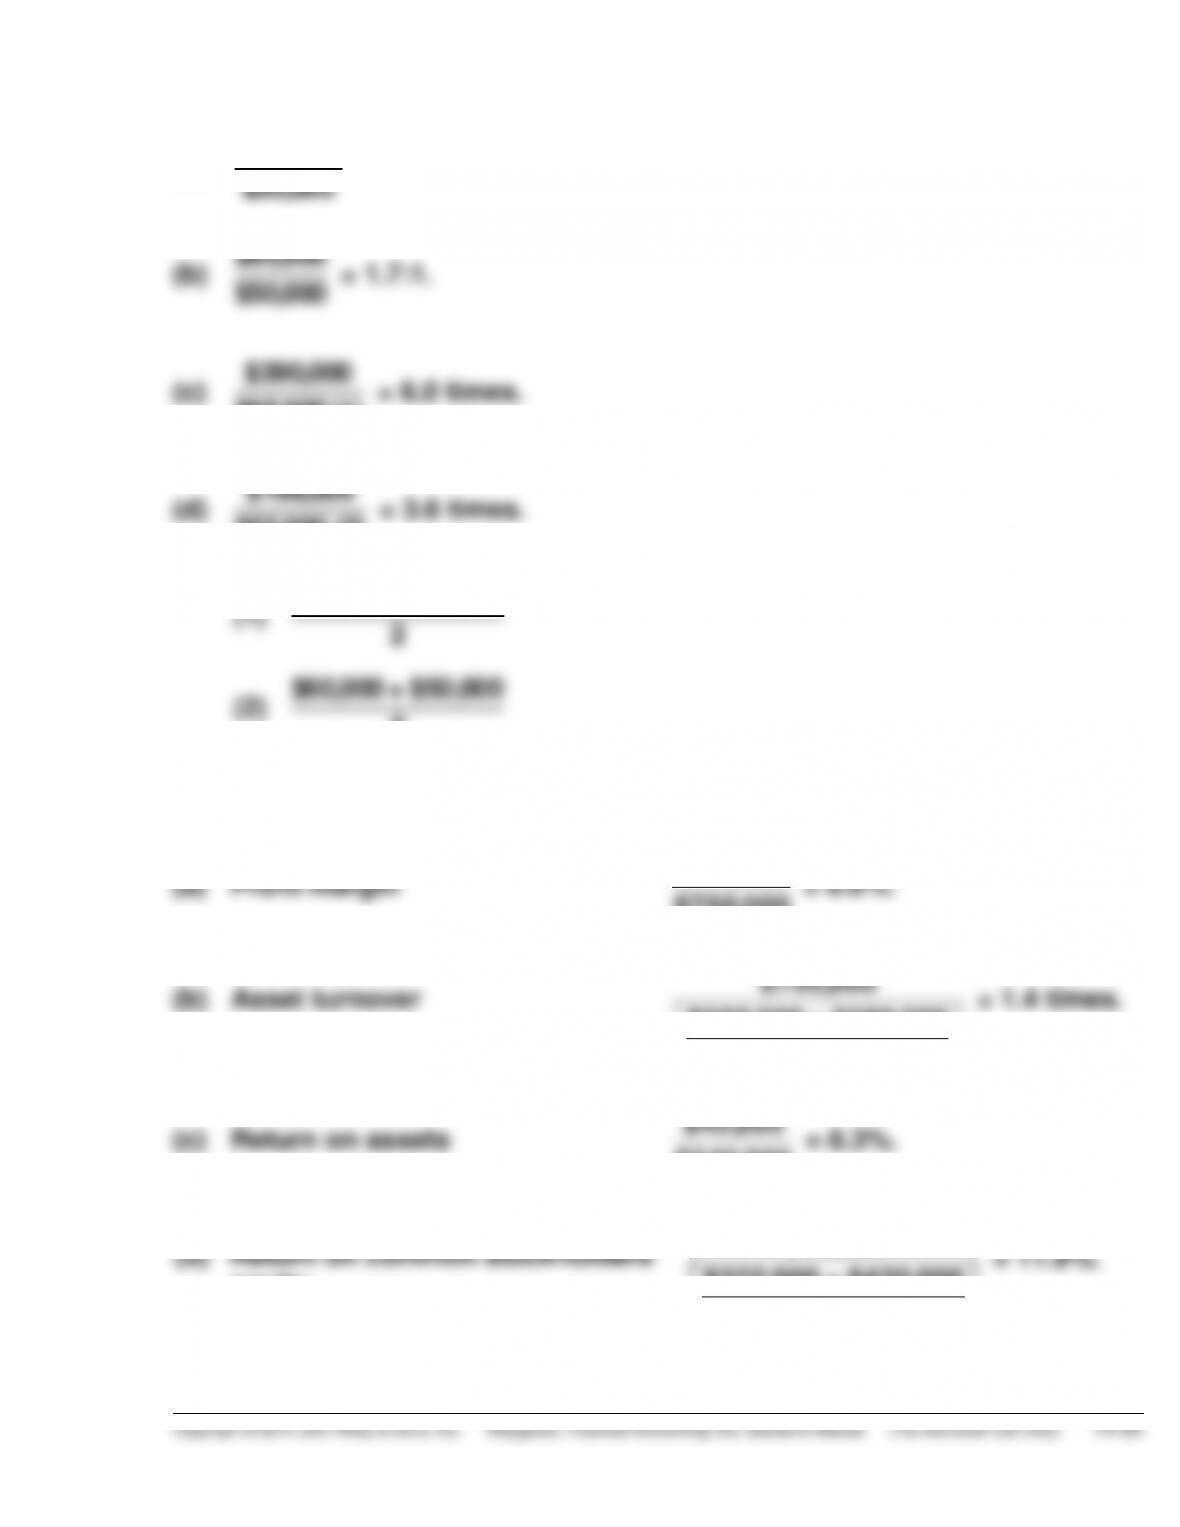
(a)
$145,000
$50,000
= 2.9:1.
(b)
$85,000
$50,000
= 1.7:1.
(c)
$390,000
$65,000 (1)
= 6.0 times.
(d)
$198,000
$55,000 (2)
= 3.6 times.
(1)
$70,000 + $60,000
2
(2)
$60,000 + $50,000
2
EXERCISE 14-8
$45,000
$750,000
(b) Asset turnover
$750,000
$500,000 + $580,000
2
= 1.4 times.
(c) Return on assets
$45,000
$540,000
= 8.3%.
(d)
Return on common stockholders’
equity
$45,000
$325,000 + $430,000
2
= 11.9%.
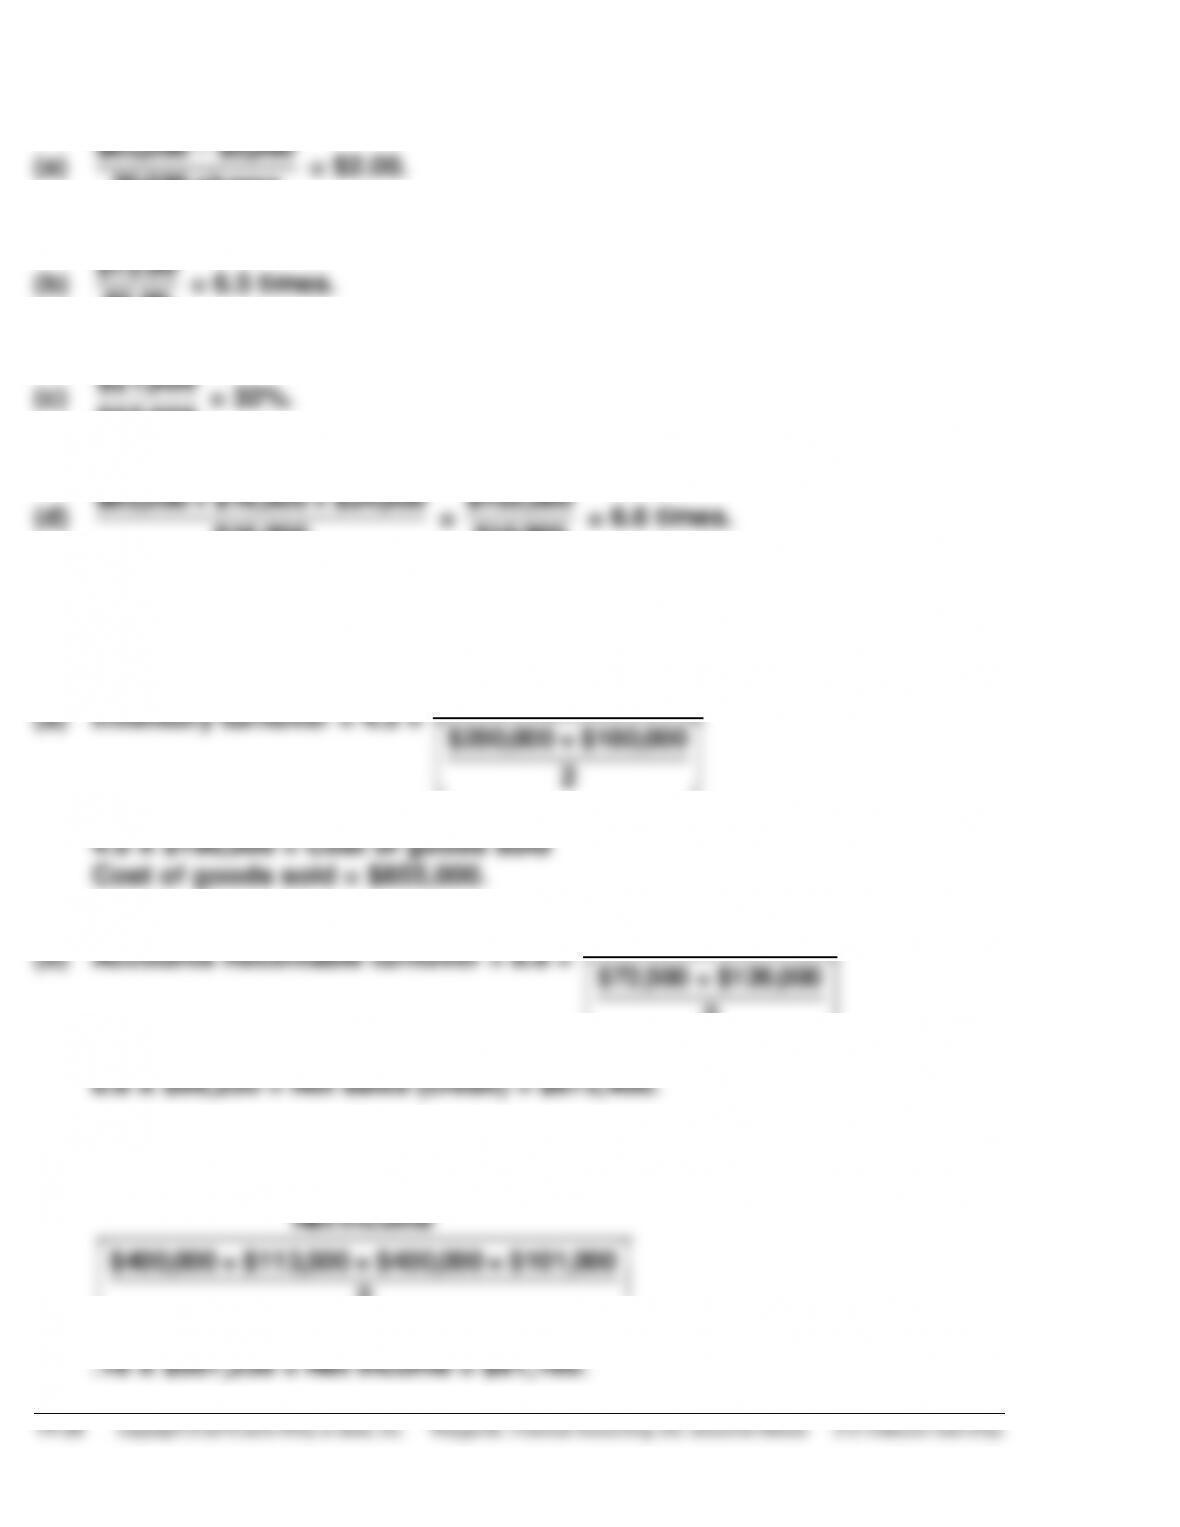
EXERCISE 14-9
(a)
$65,000 –$5,000
30,000 shares
= $2.00.
(b)
$13.00
$2.00
= 6.5 times.
(c)
$21,000
$65,000
= 32%.
(d)
$65,000 + $16,000 + $24,000
$16,000
=
$105,000
$16,000
= 6.6 times.
EXERCISE 14-10
Cost of goods sold
EXERCISE 14-10 (Continued)
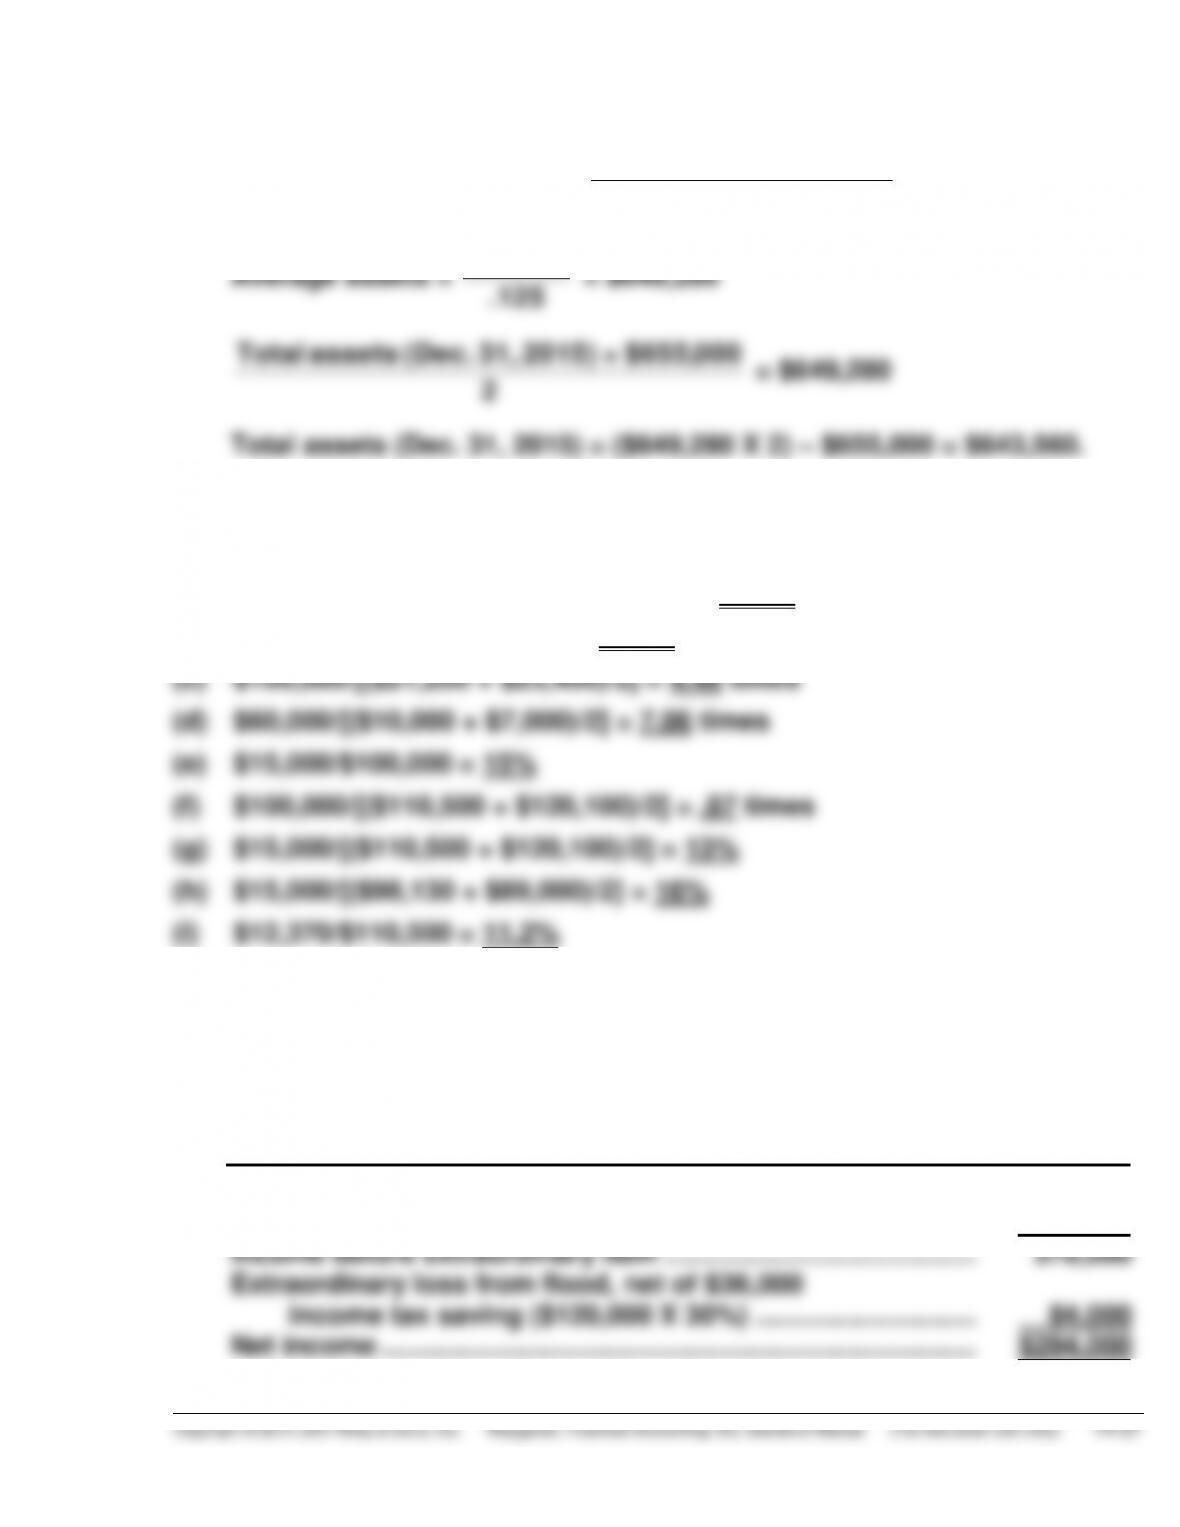
(d) Return on assets = 12.5% =
$81,160 [see (c) above]
Average assets
$81,160
EXERCISE 14-11
(a) ($4,300 + $21,200+ $10,000)/$12,370 = 2.87:1
(b) ($4,300 + $21,200)/$12,370 = 2.06:1
EXERCISE 14-12
(a) HAAS CORPORATION
Partial Income Statement
For the Year Ended October 31, 2015
Income before income taxes .................................................. $540,000
Income tax expense ($540,000 X 30%) .................................. 162,000
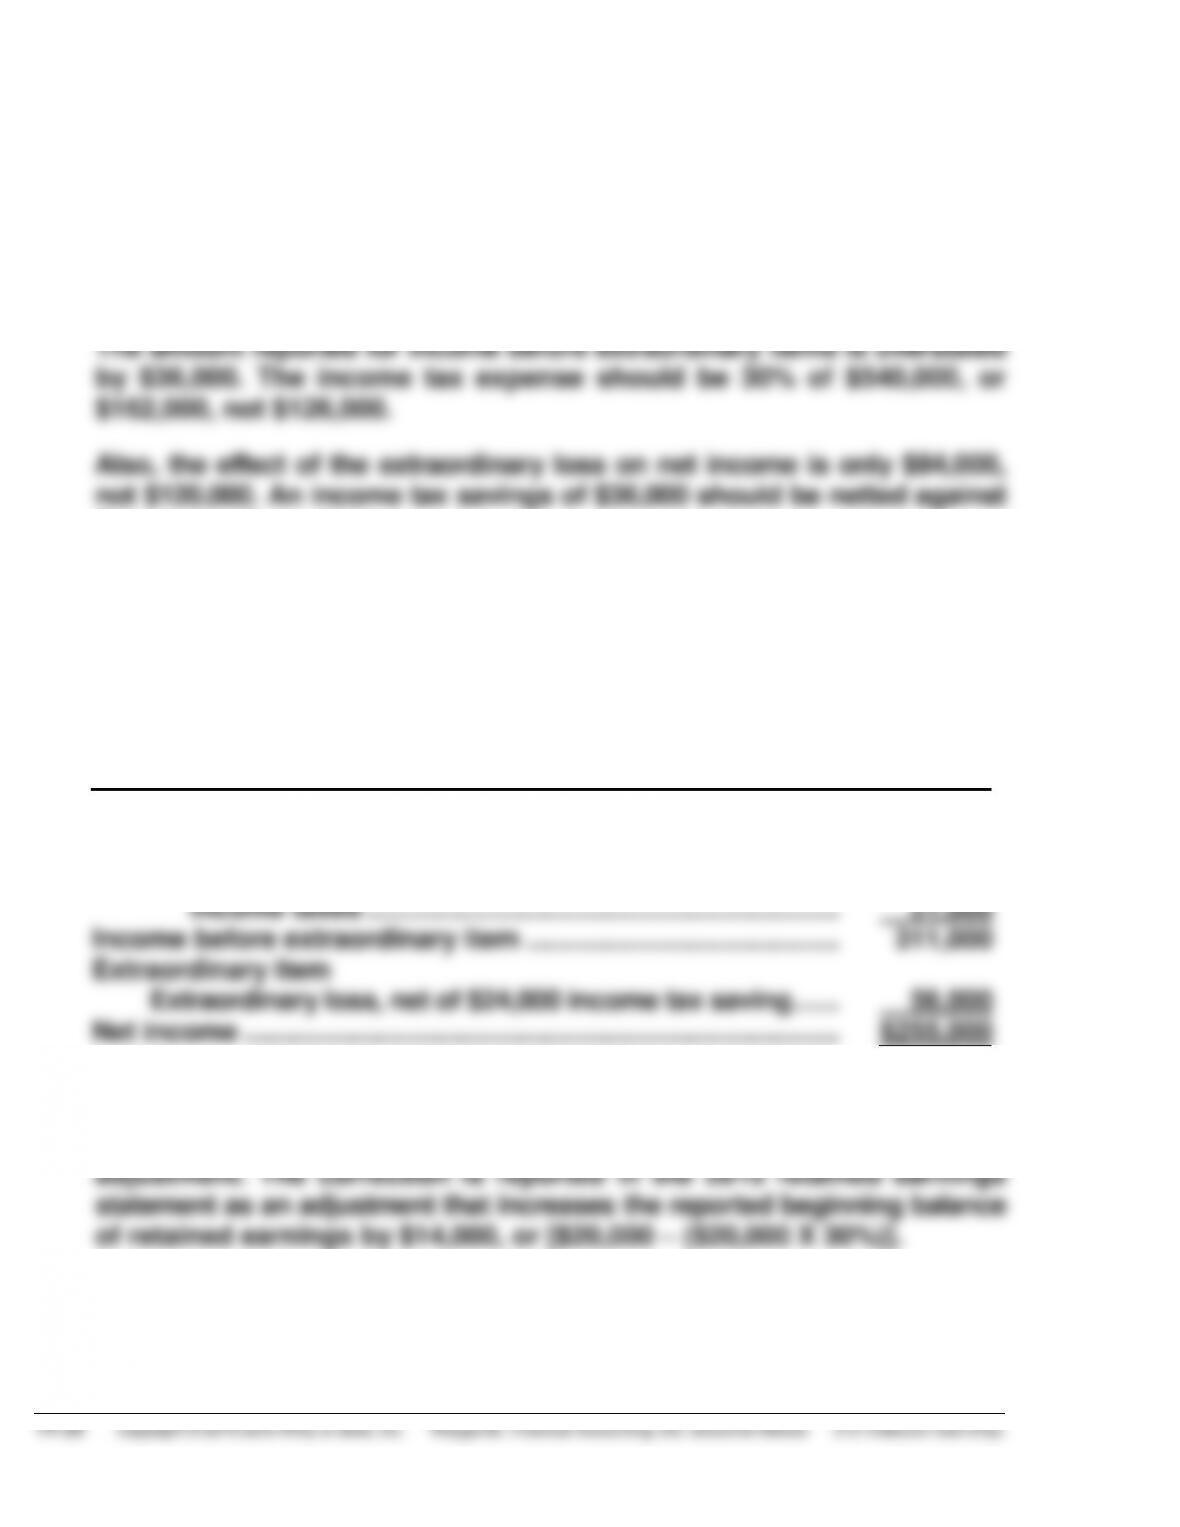
EXERCISE 14-12 (Continued)
(b) To: Chief Accountant
From: Your name, Independent Auditor
After reviewing your income statement for the year ended 10/31/15, we
believe it is misleading for the following reasons:
the extraordinary loss.
EXERCISE 14-13
(a) TRAYER CORPORATION
Partial Income Statement
For the Year Ended December 31, 2015
Income from continuing operations ...................................... $290,000
Discontinued operations
Gain on discontinued division, net of $9,000
(b) The correction of an error in last year’s financial statements is a prior period
SOLUTIONS TO PROBLEMS
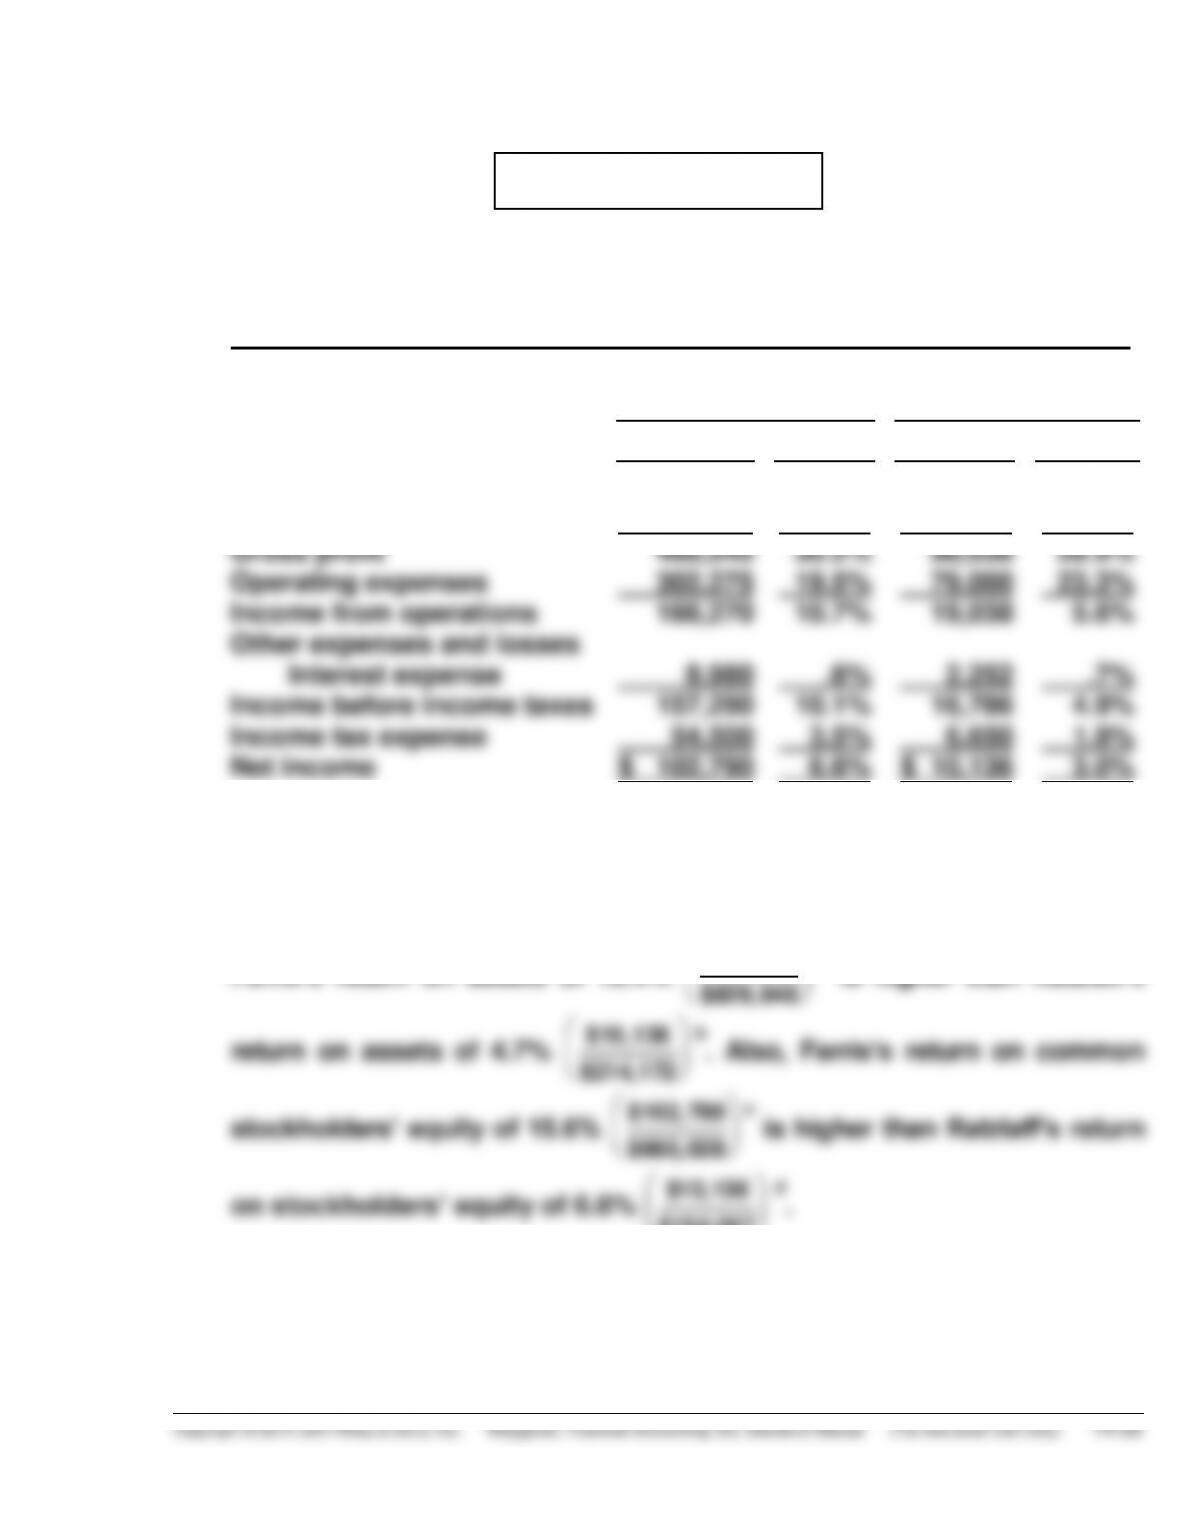
PROBLEM 14-1
(a) Condensed Income Statement
For the Year Ended December 31, 2015
Farris Company
Ratzlaff
Company
Dollars
Percent
Dollars
Percent
Net sales
Cost of goods sold
Gross profit
Operating expenses
Income from operations
Other expenses and losses
Interest expense
Income before income taxes
Income tax expense
Net income
$1,549,035
1,080,490
468,545
302,275
166,270
8,980
157,290
54,500
$ 102,790
100.0%
69.8%
30.2%
19.5%
10.7%
.6%
10.1%
3.5%
6.6%
$339,038
241,000
98,038
79,000
19,038
2,252
16,786
6,650
$ 10,136
100.0%
71.1%
28.9%
23.3%
5.6%
.7%
4.9%
1.9%
3.0%
(b) Farris Company appears to be more profitable. It has higher relative
gross profit, income from operations, income before taxes, and net income.
Farris’s return on assets of 12.4%
$102, 790
$829, 848
a is higher than Ratzlaff’s
return on assets of 4.7%
$10,136
$214,172
b. Also, Farris’s return on common
stockholders’ equity of 15.6%
$102, 790
$660, 028
c is higher than Ratzlaff’s return
on stockholders’ equity of 6.6%
$10,136
$154,047
d.

PROBLEM 14-1 (Continued)
2015
2014
Current assets
Plant assets
Total assets
$325,975
521,310
$847,285
+
$312,410
500,000
$812,410
=
2
$1,659,695
b$10,136 is Ratzlaff’s 2015 net income. $214,172 is Ratzlaff’s 2015 average
assets:
2015
2014
Current assets
Plant assets
Total assets
$ 83,336
139,728
$223,064
+
$ 79,467
125,812
$205,279
=
2
$428,343
c$102,790 is Farris’s 2015 net income. $660,028 is Farris’s 2015
average stockholders’ equity:
2015
2014
Common stock
Retained earnings
Stockholders’ equity
$500,000
173,460
$673,460
+
$500,000
146,595
$646,595
=
$1, 320, 055
2
d$10,136 is Ratzlaff’s 2015 net income. $154,047 is Ratzlaff’s 2015
average stockholders’ equity:
2015
2014
Common stock
Retained earnings
Stockholders’ equity
$120,000
38,096
$158,096
+
$120,000
29,998
$149,998
=
2
$308,094


