EXERCISE 6-8 (Continued)
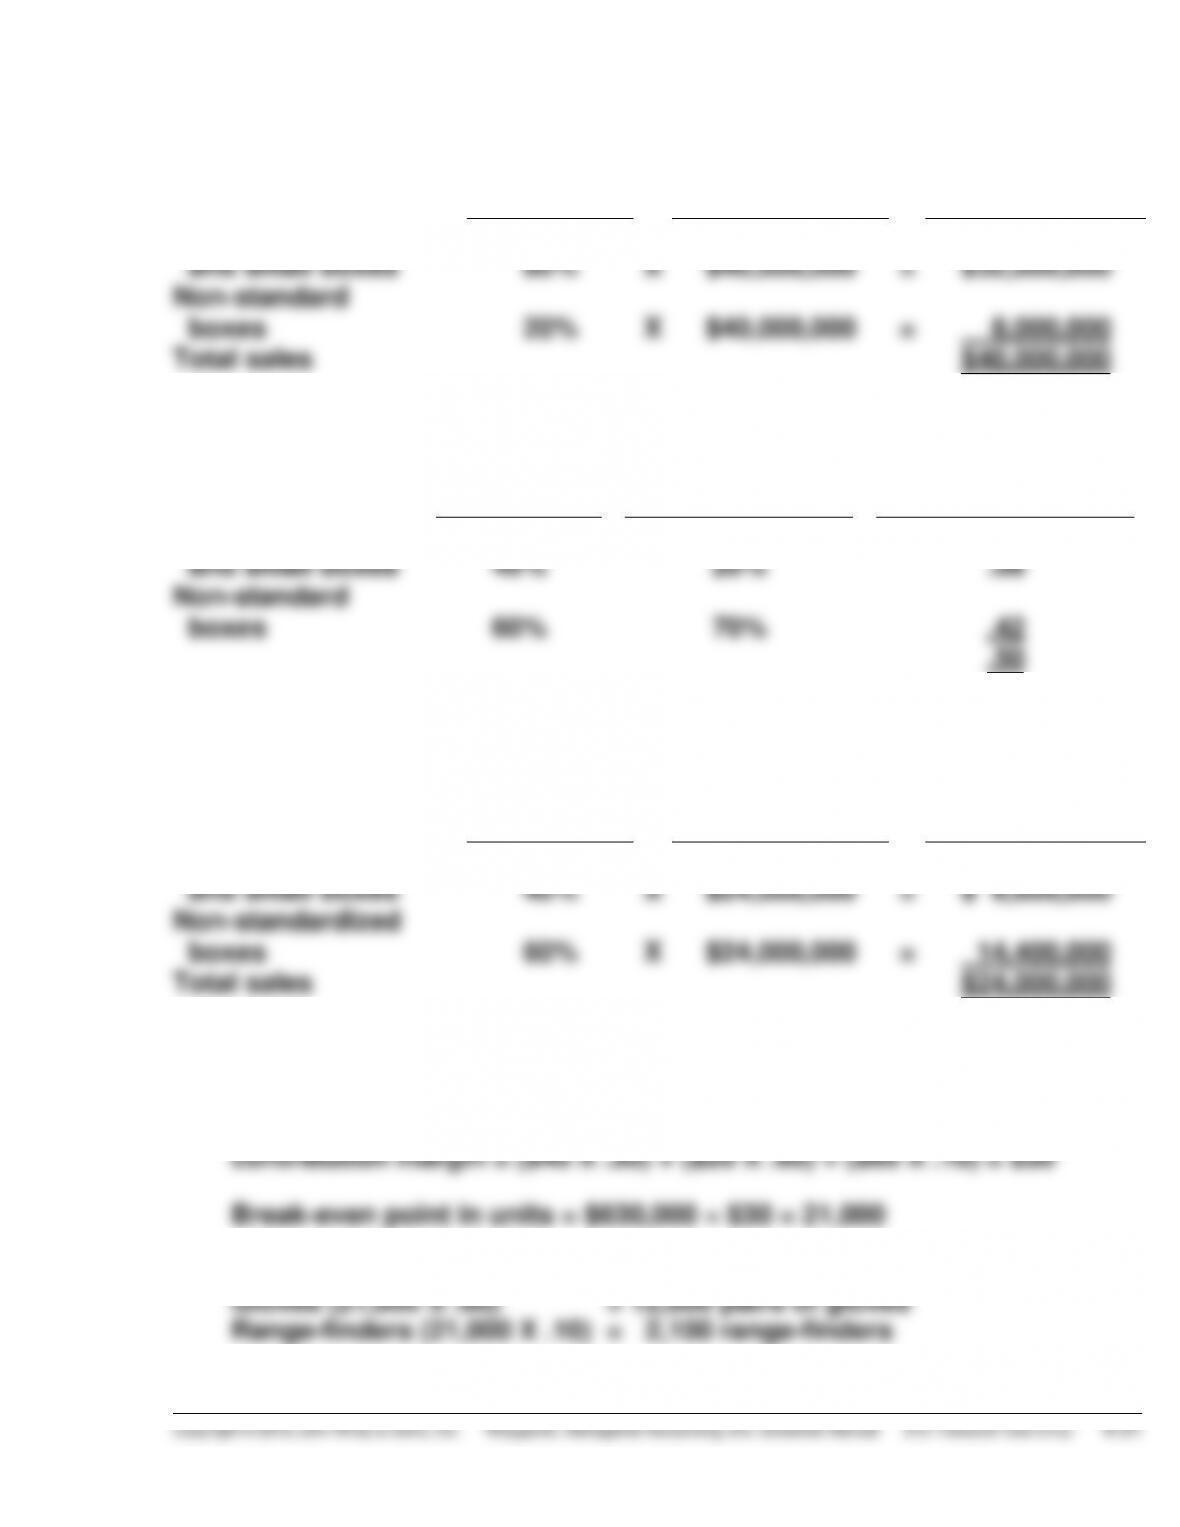
Sales Mix
Percentage
Total Break-
even Sales
in Dollars
Sales Dollars
Needed
Per Product
Mail pouches
and small boxes
Non-standard
boxes
Total sales
80%
20%
X
X
$40,000,000
$40,000,000
=
=
$32,000,000
8,000,000
$40,000,000
(b)
Sales Mix
Percentage
Contribution
Margin Ratio
Weighted-Average
Contribution
Margin Ratio
Mail pouches
and small boxes
Non-standard
boxes
40%
60%
20%
70%
.08
.42
.50
Total break-even sales in dollars = $12,000,000 ÷ .50 = $24,000,000
Sales Mix
Percentage
Total Break-
even Sales
in Dollars
Sales Dollars
Per Product
Mail pouches
and small boxes
Non-standardized
boxes
Total sales
40%
60%
X
X
$24,000,000
$24,000,000
=
=
$ 9,600,000
14,400,000
$24,000,000
EXERCISE 6-9
(a) Weighted-average unit
(b) Shoes (21,000 X .30) = 6,300 pairs of shoes
EXERCISE 6-9 (Continued)
(c) Shoes: 6,300 X $40 = $252,000
Gloves: 12,600 X $20 = 252,000
EXERCISE 6-10
(a) Sales mix percentage
iPad division: $600,000 ÷ ($600,000 + $400,000) = .60
Contribution margin ratio:
(b)
Weighted-average contribution
=
$320,000
= .32 OR
margin ratio
$1,000,000
(c) Break-even point in dollars = $120,000 ÷ .32 = $375,000
(d) Sales dollars needed at break-even point for each division
EXERCISE 6-11
(a)
Product
A
B
C
Contribution margin per unit (a)
Machine hours required (b)
Contribution margin per unit of limited resource (a) ÷ (b)
$ 5
2
$2.50
$ 2
1
$ 2
$ 3
2
$1.50
contribution margin per machine hour.
EXERCISE 6-11 (Continued)
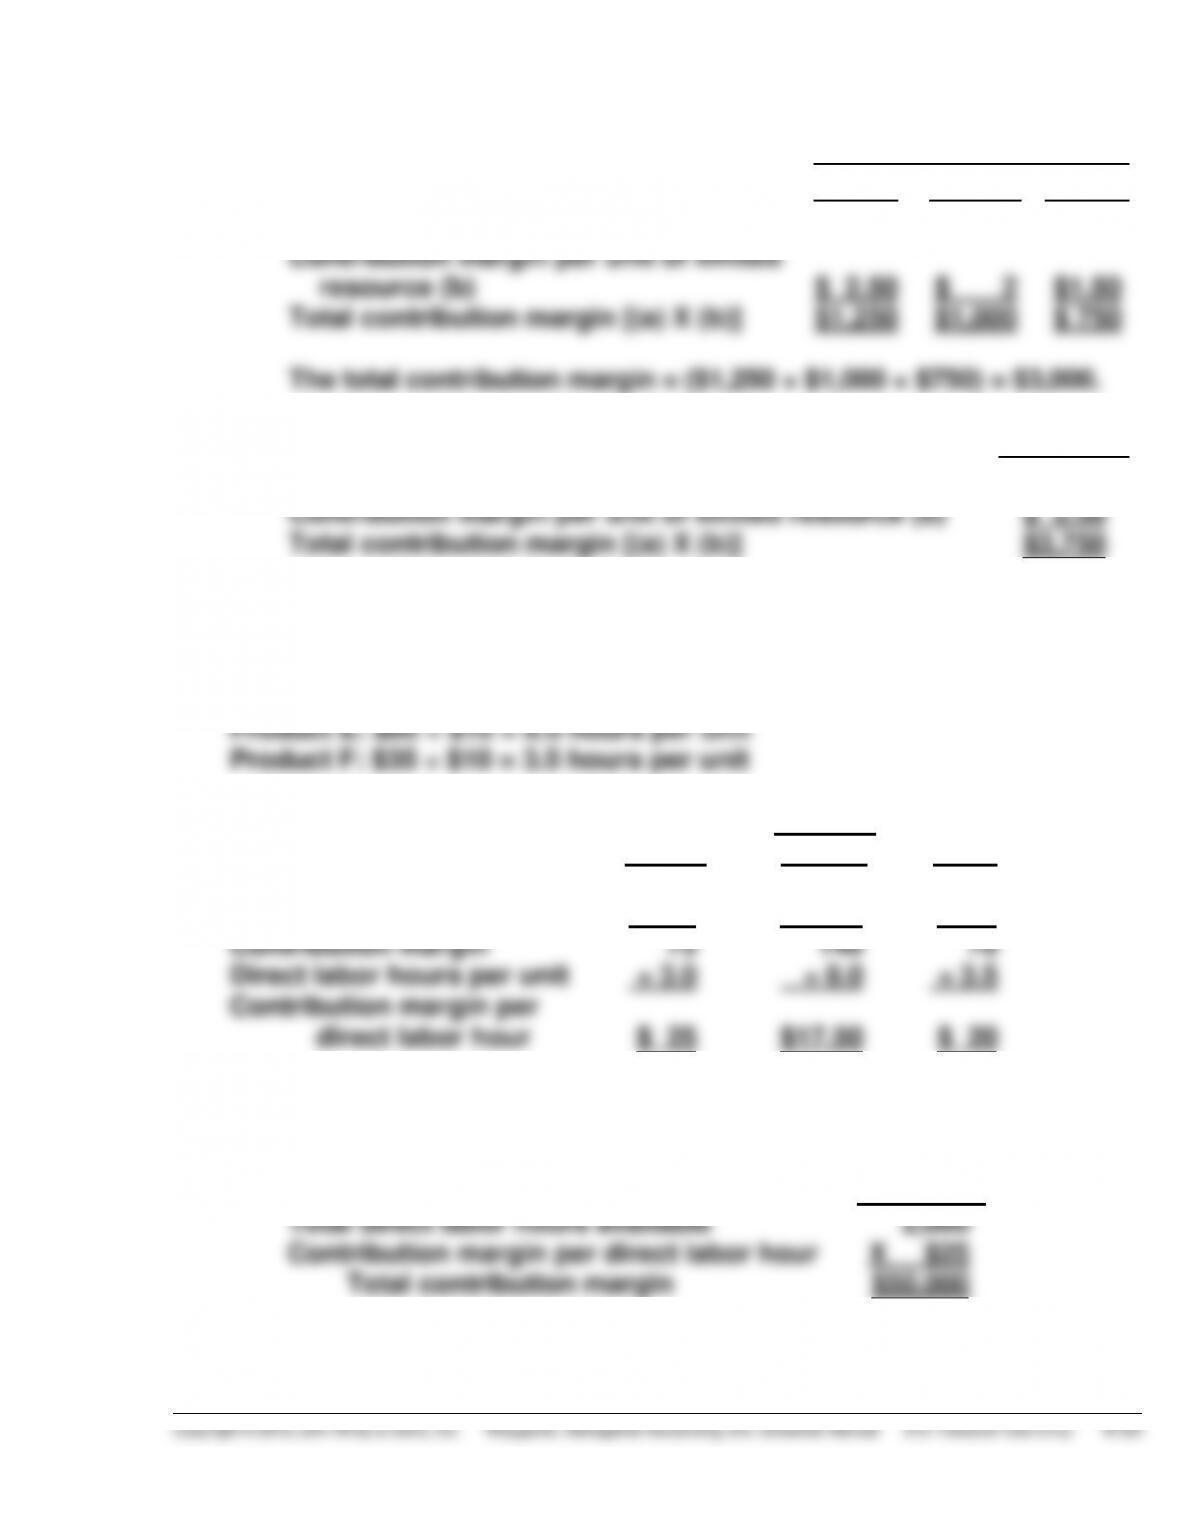
(c)
1.
Product
A
B
C
Machine hours (a) (1,500 ÷ 3)
Contribution margin per unit of limited
resource (b)
Total contribution margin [(a) X (b)]
500
$ 2.50
$1,250
500
$ 2
$1,000
500
$1.50
$ 750
The total contribution margin = ($1,250 + $1,000 + $750) = $3,000.
2.
Product A
Machine hours (a)
Contribution margin per unit of limited resource (b)
Total contribution margin [(a) X (b)]
1,500
$ 2.50
$3,750
EXERCISE 6-12
(a)
Product D: $30 ÷ $10 = 3.0 hours per unit
Product E: $80 ÷ $10 = 8.0 hours per unit
Product F: $35 ÷ $10 = 3.5 hours per unit
(b)
Product
D
E
F
Selling price
$200
$ 300
$250
Variable costs
125
160
180
Contribution margin
75
140
70
Direct labor hours per unit
÷ 3.0
÷ 8.0
÷ 3.5
Contribution margin per
direct labor hour
$ 25
$17.50
$ 20
(c) Product D should be produced because it generates the highest contri-
bution margin per direct labor hour.
Product D
Total direct labor hours available
2,000
Contribution margin per direct labor hour
X $25
Total contribution margin
$50,000
EXERCISE 6-13
(a)
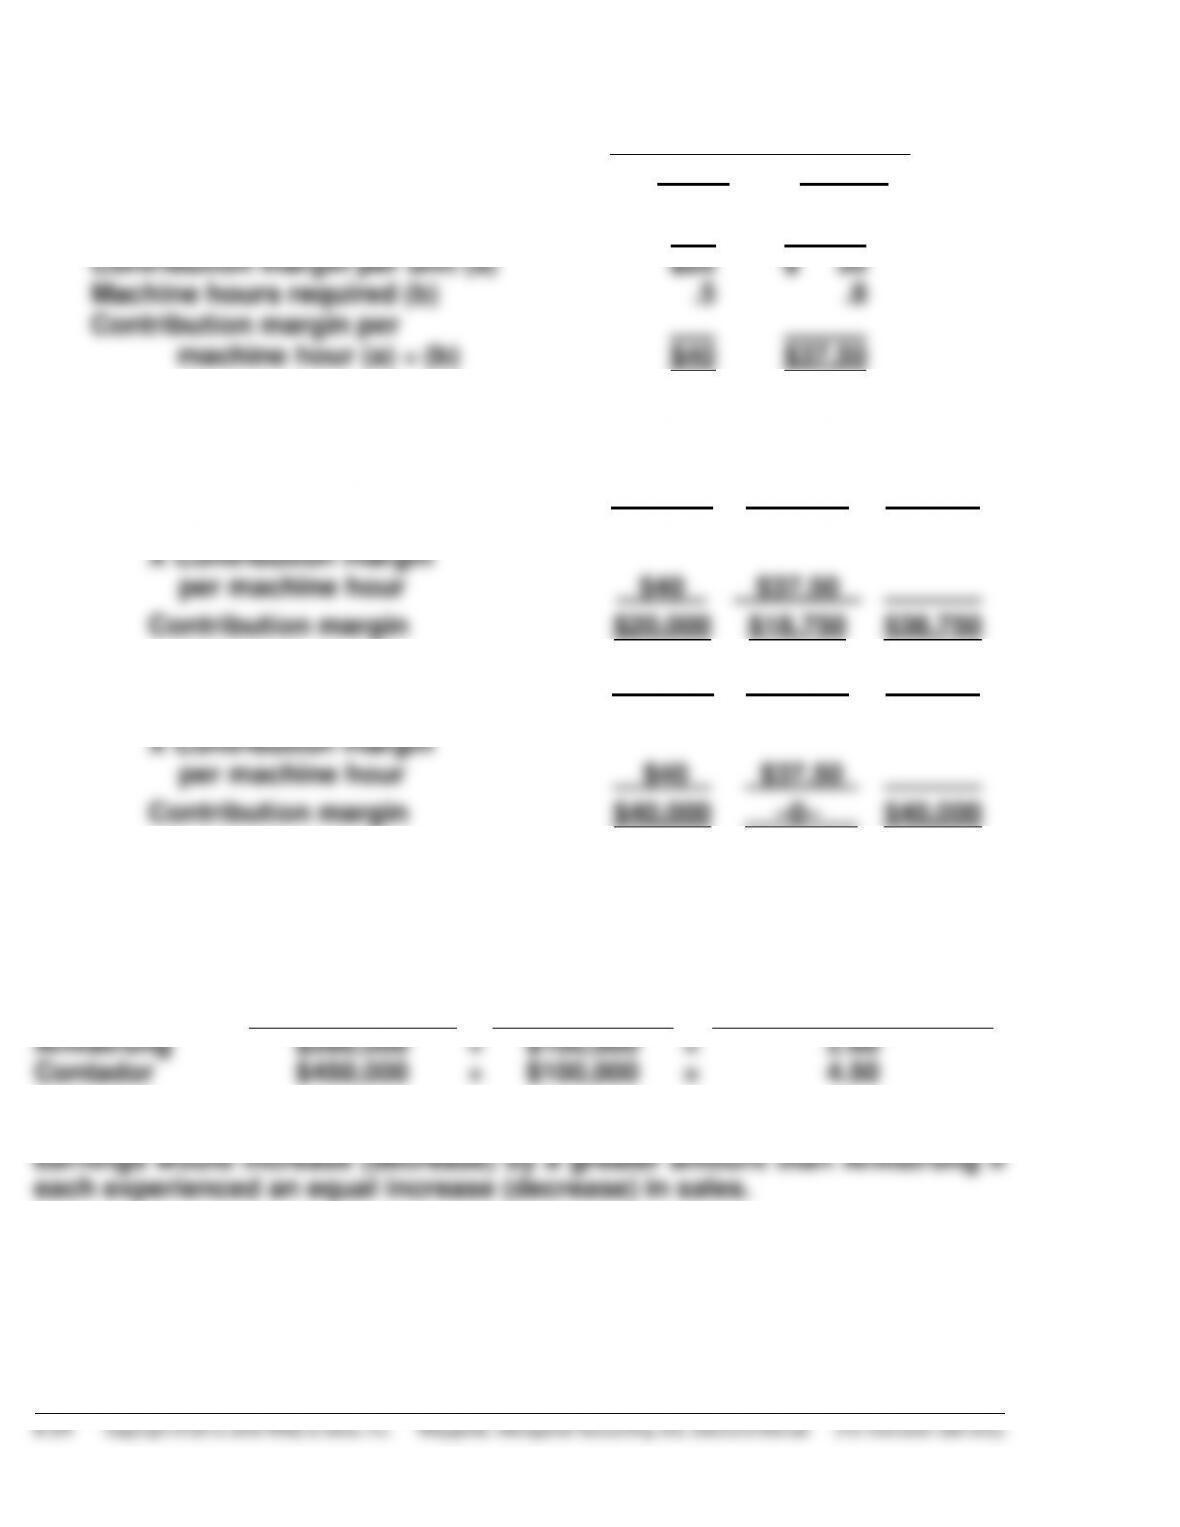
Product
Basic
Deluxe
Selling price per unit
Variable costs per unit
$40
20
$ 52
22
Contribution margin per unit (a)
$20
$ 30
Machine hours required (b)
.5
.8
Contribution margin per
machine hour (a) ÷ (b)
$40
$37.50
(b) The Basic product should be manufactured because it results in the
higher contribution margin per machine hour.
(c)
1.
Basic
Deluxe
Total
Machine hours allocated
500
500
1,000
X Contribution margin
per machine hour
$40
$37.50
Contribution margin
$20,000
$18,750
$38,750
2.
Basic
Deluxe
Total
Machine hours allocated
1,000
–0–
1,000
X Contribution margin
per machine hour
$40
$37.50
Contribution margin
$40,000
–0–
$40,000
EXERCISE 6-14
(a)
Contribution
Margin
÷
Net
Income
=
Degree of Operating
Leverage
Armstrong
Contador
$260,000
$450,000
÷
÷
$100,000
$100,000
=
=
2.60
4.50
Interpretation: Contador has a higher degree of operating leverage. Its
EXERCISE 6-14 (Continued)
(b)
Armstrong Company
Contador Company
Sales
Variable costs
Contribution margin
Fixed costs
Net income
$550,000**
264,000**
286,000**
160,000**
$126,000**
$550,000***
55,000***
495,000***
350,000***
$145,000***
*$500,000 X 1.1
that of Armstrong.
EXERCISE 6-15
(a)
Contribution
Margin
÷
Net Income
=
Degree of
Operating Leverage
Manual system
Computerized
system
$300,000
$900,000
÷
÷
$250,000
$250,000
=
=
1.20
3.60
(b) The computerized system would produce profits that are 3.0 times
(3.60 ÷ 1.20) as much as the manual system. With a $150,000 increase in
EXERCISE 6-15 (Continued)
Manual
System
Computerized
System
Sales
Variable costs
Contribution margin
Fixed costs
Net income
$1,650,000
1,320,000*
330,000
50,000
$ 280,000
$1,650,000
660,000**
990,000
650,000
$ 340,000
*($1,200,000 ÷ $1,500,000) X $1,650,000
**($600,000 ÷ $1,500,000) X $1,650,000
(c)
(Actual Sales
–
Break-even Sales)
÷
Actual Sales
=
Margin of Safety Ratio
Manual system
Computerized
system
($1,500,000
($1,500,000
–
–
$250,000*)
$1,083,333**)
÷
÷
$1,500,000
$1,500,000
=
=
.83
.28
*$ 50,000 ÷ ($300,000 ÷ $1,500,000)
**$650,000 ÷ ($900,000 ÷ $1,500,000)
EXERCISE 6-16
(a)
Contribution
Margin
÷
Net
Income
=
Degree of Operating
Leverage
Traditional Yams
Auto-Yams
$ 80,000
$240,000
÷
÷
$50,000
$50,000
=
=
1.60
4.80
Auto-Yams, which relies more heavily on fixed costs, has the higher
degree of operating leverage, 4.8 versus 1.60. That means for every
dollar of increase (decrease) in sales, Auto-Yams will generate 3
(4.80 ÷ 1.60) times more (less) in contribution margin and net income.
EXERCISE 6-16 (Continued)
(b)
% Change
in Sales
X
Degree of
Operating
Leverage
=
% Change in
Net Income
15% decrease:
Traditional Yams
Auto-Yams
(15%)
(15%)
X
X
1.60
4.80
=
=
(24.0%)
(72.0%)
10% increase:
Traditional Yams
Auto-Yams
10%
10%
X
X
1.60
4.80
=
=
16.0%
48.0%
(c) There are several possible answers that could be given. For example,
if the candied Yams business is fairly stable, Auto-Yams might be the
choice, because they will generate the higher contribution margin and
EXERCISE 6-17
(a)
Unit Cost
Direct materials
$ 7.50
Direct labor
2.45
Variable manufacturing overhead
5.80
Manufacturing cost per unit
$15.75
EXERCISE 6-17 (Continued)
(b)
FELDE COMPANY
Income Statement
For the Year Ended December 31, 2014
Variable Costing
Sales (80,000 lures X $25)
$2,000,000
Variable cost of goods sold
(80,000 lures X $15.75)
$1,260,000
Variable selling and administrative
expenses (80,000 lures X $3.90)
312,000
1,572,000
Contribution margin
428,000
Fixed manufacturing overhead
225,000
Fixed selling and administrative
expenses
240,100
465,100
Net Income (loss)
$ (37,100)
(c)
Unit Cost
Direct materials
$ 7.50
Direct labor
2.45
Variable manufacturing overhead
5.80
Fixed manufacturing overhead ($225,000 ÷ 90,000)
2.50
Manufacturing cost per unit
$18.25
(d)
FELDE COMPANY
Income Statement
For the Year Ended December 31, 2014
Absorption Costing
Sales (80,000 lures X $25)
$2,000,000
Cost of goods sold (80,000 lures X $18.25)
1,460,000
Gross profit
540,000
Variable selling and administrative expenses
(80,000 lures X $3.90)
$312,000
Fixed selling and administrative expenses
240,100
552,100
Net Income
$ (12,100)
*EXERCISE 6-18
(a)
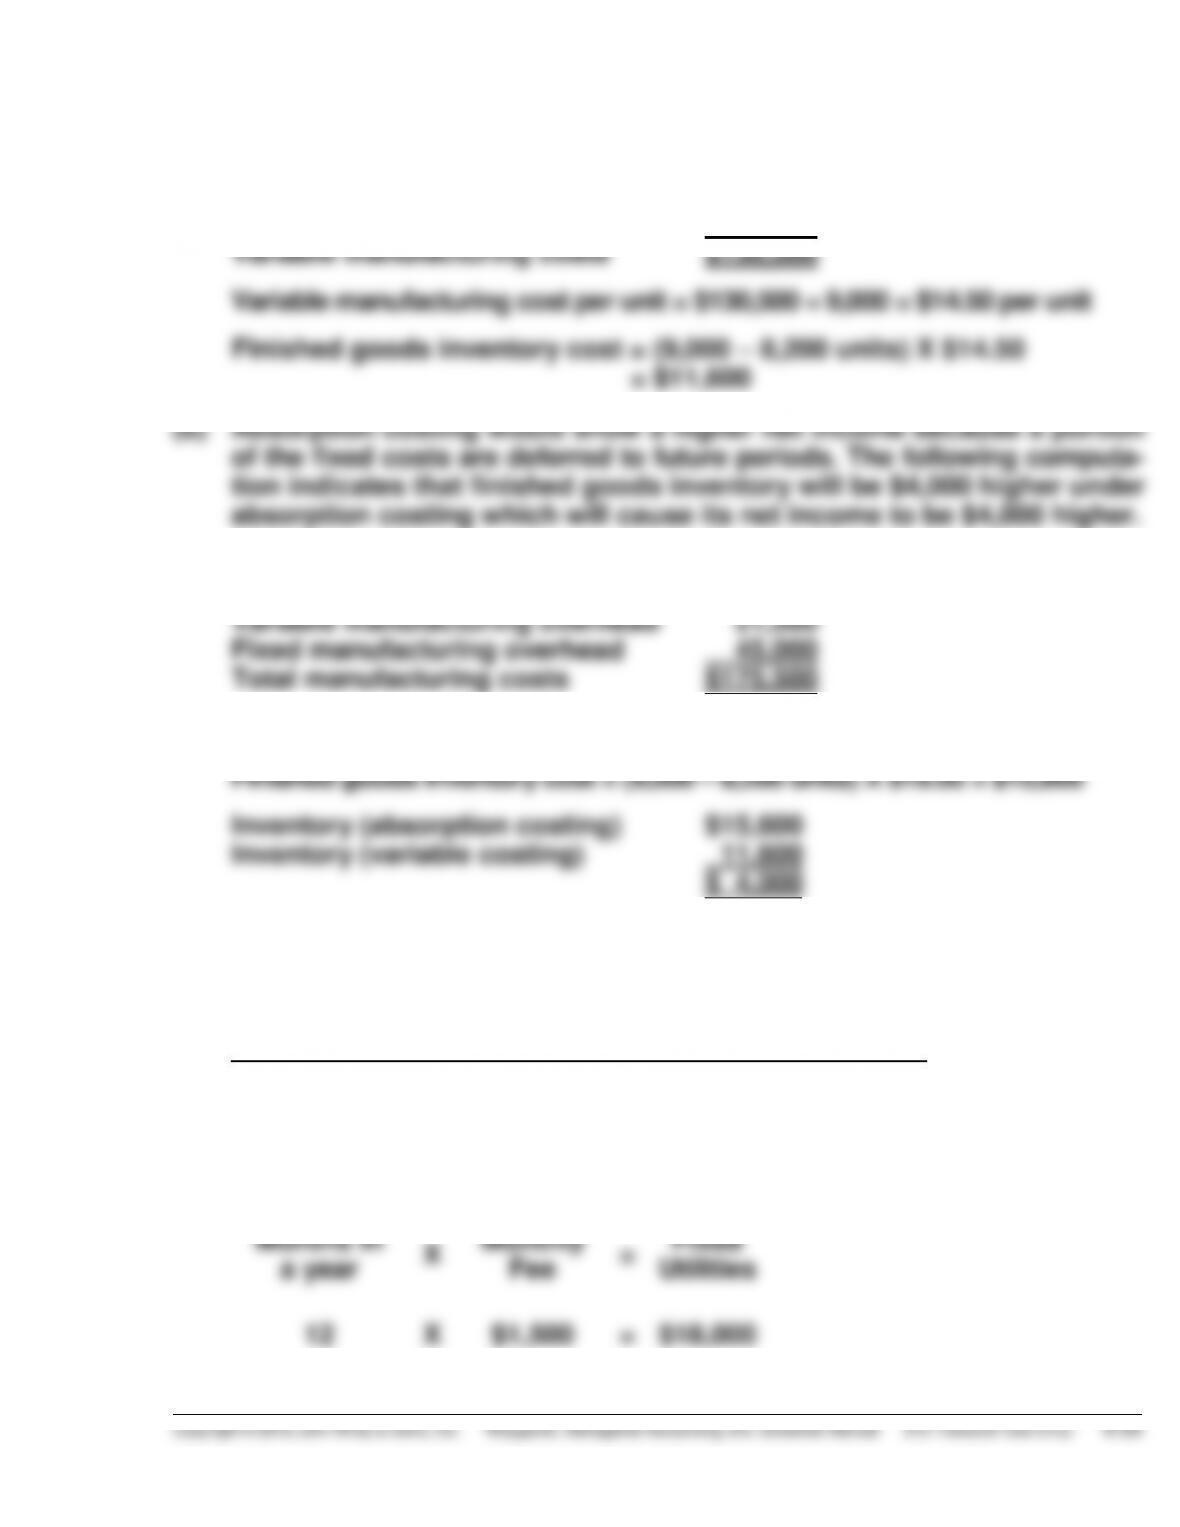
Direct materials used $ 79,000
Direct labor incurred 30,000
Variable manufacturing overhead 21,500
Direct materials used $ 79,000
Direct labor incurred 30,000
Total manufacturing costs per unit = $175,500 ÷ 9,000 = $19.50 per unit
*EXERCISE 6-19
(a)
Utility Expense
Months in
a year
X
Kilowatt
hours
X
Hourly
Charge
=
Variable
Utilities
12
X
500
X
$0.40
=
$2,400
Months in
a year
X
Monthly
Fee
=
Fixed
Utilities
12
X
$1,500
=
$18,000
*EXERCISE 6-19 (Continued)
Variable Costing
Labor:
Crate builders
$38,000
Material:
Wood
54,000
Variable Overhead:
Utilities
2,400
Nails
350
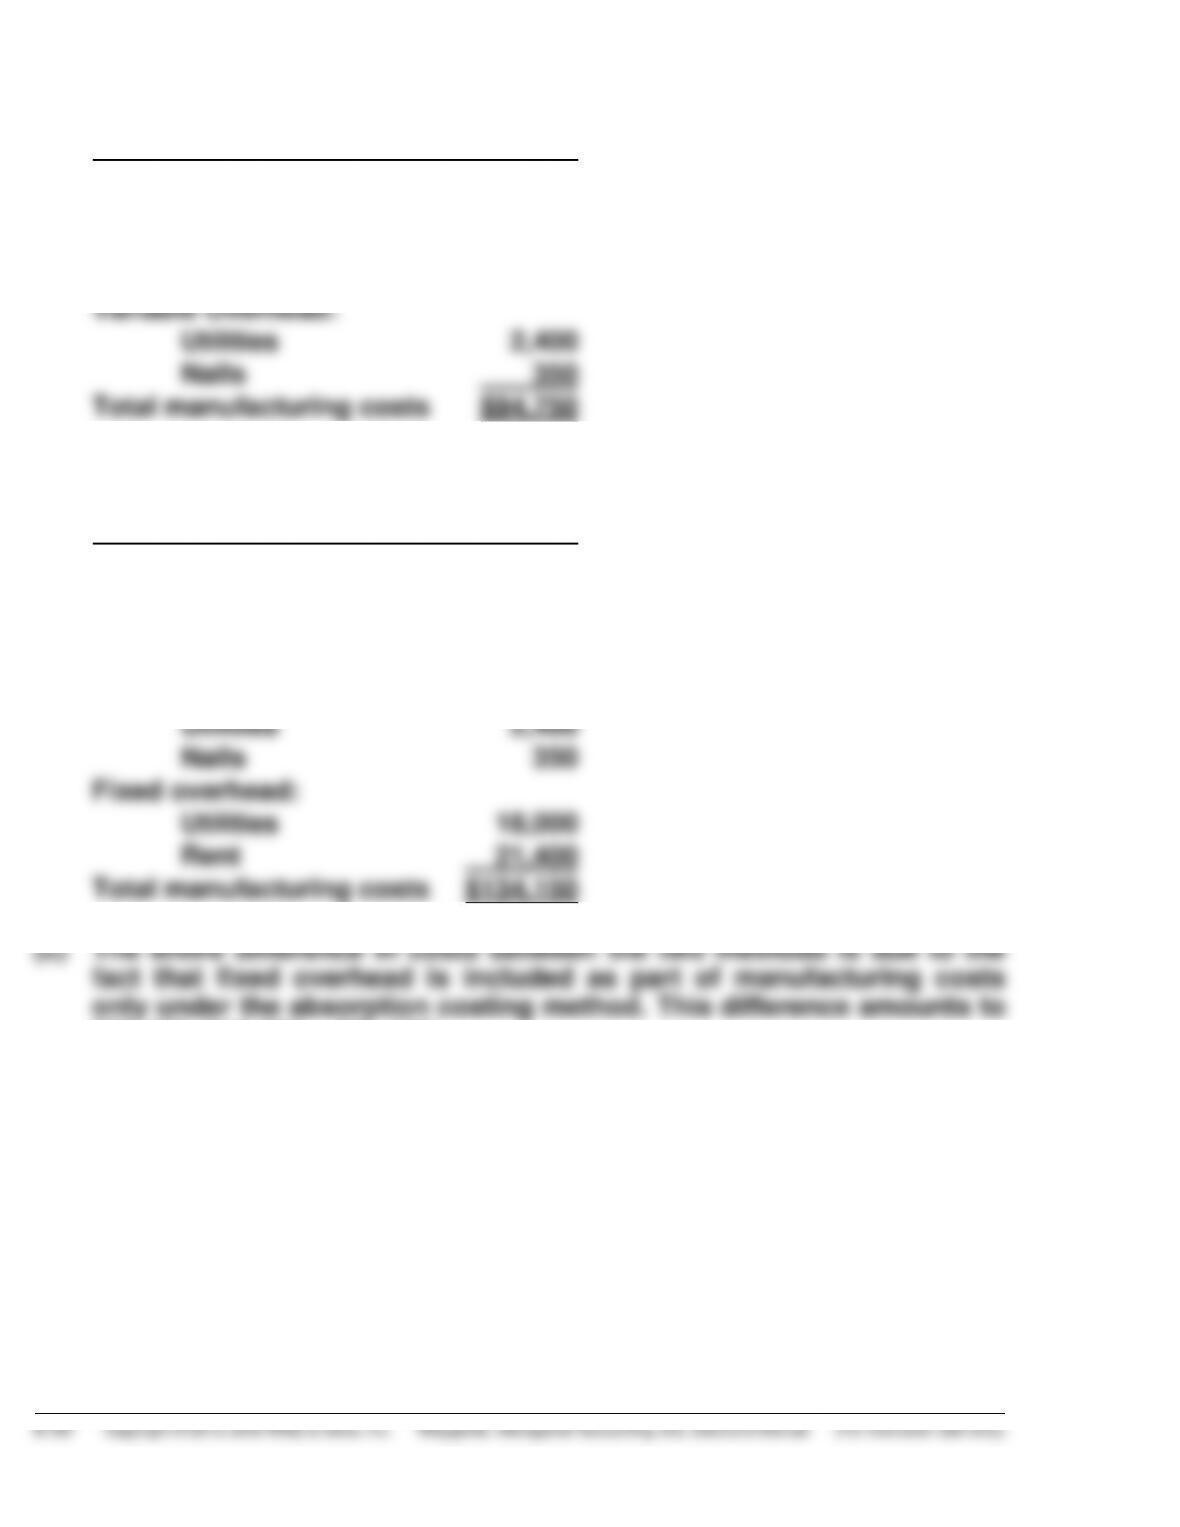
Total manufacturing costs
$94,750
(b)
Absorption Costing
Labor:
Crate builders
$ 38,000
Material:
Wood
54,000
Variable overhead:
Utilities
2,400
Nails
350
Fixed overhead:
Utilities
18,000
Rent
21,400
Total manufacturing costs
$134,150
$39,400 ($18,000 + $21,400).