CHAPTER 6
Cost-Volume-Profit Analysis: Additional Issues
ASSIGNMENT CLASSIFICATION TABLE
Learning Objectives
Questions
Brief
Exercises
Do It!
Exercises
A
Problems
B
Problems
1. Describe the essential features
of a cost-volume-profit income
statement.
1, 2, 3, 4
1, 2, 3,
4, 5, 6
1
1A, 2A
1B, 2B
2. Apply basic CVP concepts.
2, 4, 5, 6
1, 2, 3, 4,
5, 6
2
1, 2, 3,
4, 5
1A, 2A, 6A
1B, 2B, 6B
3. Explain the term sales mix and
its effects on break-even sales.
7, 8, 9
7, 8, 9, 10
3
6, 7, 8,
9, 10
4A
4B
4. Determine sales mix when a
company has limited resources.
10, 11
11, 15
4
11, 12, 13
3A
3B
5. Understand how operating
leverage affects profitability.
12, 13, 14,
15, 16
12, 13, 14
14, 15, 16
5A, 6A
5B, 6B
*6. Explain the difference between
absorption costing and variable
costing.
17
16, 17, 18
17, 18, 19
7A, 8A
7B, 8B
*7. Discuss net income effects
under absorption costing
versus variable costing.
19, 20,
21, 22
19
18
7A, 8A
7B, 8B
*8. Discuss the merits of absorption
versus variable costing for
management decision making.
18
8A
8B
ASSIGNMENT CHARACTERISTICS TABLE
Problem
Number
Description
Difficulty
Level
Time
Allotted (min.)
1A
Compute break-even point under alternative courses of
action.
Moderate
20–30
2A
Compute break-even point and margin of safety ratio, and
prepare a CVP income statement before and after changes
in business environment.
Moderate
20–30
3A
Determine sales mix with limited resources.
Simple
10–15
4A
Determine break-even sales under alternative sales
strategies and evaluate results.
Moderate
20–30
5A
Compute degree of operating leverage and evaluate
impact of operating leverage on financial results.
Moderate
20–30
6A
Determine contribution margin, break-even point, target
sales, and degree of operating leverage.
Moderate
20–30
*7A
Prepare income statements under absorption costing and
variable costing for a company with beginning inventory,
and reconcile differences.
Moderate
20–30
*8A
Prepare absorption and variable costing income statements
and reconcile differences between absorption and variable
costing income statements when sales level and production
level change. Discuss relative usefulness of absorption
costing versus variable costing.
Moderate
20–30
1B
Compute break-even point under alternative courses of
action.
Moderate
20–30
2B
Compute break-even point and margin of safety ratio, and
prepare a CVP income statement before and after changes
in business environment.
Moderate
20–30
3B
Determine sales mix with limited resources.
Simple
10–15
4B
Determine break-even sales under alternative sales
strategies and evaluate results.
Moderate
20–30
5B
Compute degree of operating leverage and evaluate
impact of operating leverage on financial results.
Moderate
20–30
6B
Determine contribution margin, break-even point, target
sales, and degree of operating leverage.
Moderate
20–30
*7B
Prepare income statements under absorption costing and
variable costing for a company with beginning inventory,
and reconcile differences.
Moderate
20–30
*8B
Prepare absorption and variable costing income statements
and reconcile differences between absorption and variable
costing income statements when sales level and production
level change. Discuss relative usefulness of absorption
costing versus variable costing.
Moderate
20–30
Copyright © 2012 John Wiley & Sons, Inc. Weygandt, Managerial Accounting, 6/e, Solutions Manual (For Instructor Use Only) 6-3
BLOOM’S TAXONOMY TABLE
Learning Objective
Knowledge
Comprehension
Application
Analysis
Synthesis
Evaluation
*1. Describe the essential features
of a cost-volume-profit income
statement.
Q6-1
Q6-3
Q6-2
Q6-4
BE6-2
BE6-3
BE6-4
BE6-5
BE6-6
DI6-1
P6–1A
P6–2A
P6–1B
P6–2B
BE6-1
P6–1A
P6–2A
P6–1B
P6–2B
*2. Apply basic CVP concepts.
Q6-2
Q6-4
Q6-5
Q6-6
BE6-2
BE6-3
BE6-4
BE6-5
BE6-6
DI6-2
E6-1
E6-2
E6-3
E6-4
E6-5
P6–1A
P6–2A
P6–4A
P6–6A
P6–1B
P6–2B
P6–4B
P6–6B
BE6-1
P6–1A
P6–2A
P6–6A
P6–1B
P6–2B
P6–6B
*3. Explain the term sales mix and
its effects on break-even sales.
Q6-7
Q6-8
Q6-8
Q6-9
BE6-7
BE6-8
BE6-9
BE6-10
DI6-3
E6-6
E6-7
E6-8
E6-9
E6–10
P6–4A
P6–4B
E6-6
E6-7
E6-8
P6–4A
P6–4B
*4. Determine sales mix when a
company has limited resources.
Q6–11
Q6–10
BE6-11
BE6-15
DI6-4
E6–11
E6–12
E6–13
P6–3A
P6–3B
E6–11
E6-12
E6–13
P6–3A
P6–3B
*5. Understand how operating
leverage affects profitability.
Q6–12
Q6–13
Q6–15
Q6–14
Q6–16
BE6-12
BE6-13
BE6-14
E6–14
E6–15
E6–16
P6–5A
P6-6A
P6–5B
E6–14
E6–15
E6–16
P6–5A
P6–6A
P6–5B
P6–6B
**6. Explain the difference between
absorption costing and
variable costing.
Q6–17
BE6-16
BE6-17
BE6-18
E6–17
E6–18
E6–19
P6–7A
P6–8A
P6–7B
P6–8B
E6–18
E6–19
P6–7A
P6–8A
P6–7B
P6–8B
*7. Discuss net income effects
under absorption costing
versus variable costing.
Q6–19
Q6–20
Q6-21
Q6–22
Q6–19
BE6-19
E6–18
P6–7A
P6–8A
P6–7B
P6–8B
P6–7A
P6–8A
P6–7B
P6–8B
**8. Discuss the merits of
absorption versus variable
costing for management
decision making.
Q6–18
P6–8A
P6–8B
Broadening Your Perspective
BYP6-7
BYP6-4
BYP6-1
BYP6-6
BYP6-3
ANSWERS TO QUESTIONS
1. CVP or cost-volume-profit analysis is the study of the effects of changes in costs and volume on
a company’s profit.
2. Managers use CVP analysis to make decisions involving break-even point, sales required to
resources, and operating leverage.
3. Both types of income statements report the same amount of net income. But the format used to
reach net income differs.
net income.
A CVP income statement’s format consists of:
net income.
4. The CVP income statement isolates variable costs from fixed costs while the traditional income
5. WHEAT COMPANY
CVP Income Statement
Sales ………………………………………………………………………………………….. $900,000
6. If the selling price is reduced but variable and fixed costs remain unchanged, the break-even point
will increase.
7. Sales mix is the relative percentage of each product sold when a company sells more than one
8. The 150,000-mile tire has a higher unit contribution margin, that is, each tire sold covers a larger
9. If a company has many products, the break-even point is calculated using sales information for
divisions or product lines, rather than individual products. The weighted-average contribution
product line at the break-even point, multiply the total break-even sales by the sales mix percentage
of each product line.
Questions Chapter 6 (Continued)
10. Contribution margin per unit of limited resource is determined by dividing the contribution margin
per unit of the product by the number of units of the limited resource required to produce the
product.
11. The theory of constraints is a specific approach used to identify and manage constraints to achieve
production bottlenecks or poorly trained workers.
12. Cost structure refers to the relative proportion of fixed costs versus variable costs that a company
13. Operating leverage refers to the extent to which a company’s net income reacts to a given change
14. Typically manual labor is considered a variable cost. Depreciation on factory equipment is a fixed
15. The degree of operating leverage is a measure of a company’s relative operating leverage. It is
16. Pine’s degree of operating leverage of 8 versus Fir’s measure of 4 tells us that Pine will
experience twice (8 ÷ 4) the increase (or decrease) in net income for a given increase
(decrease) in sales as Fir.
*18. (a) The rationale for variable costing centers on the purpose of fixed manufacturing costs, which
is to have productive facilities available for use. Since these costs are incurred whether a
company operates at zero or 100% capacity, it is argued that they should be expensed
when they are incurred. Variable costing is useful in product costing internally by management
generally accepted accounting principles.
*19. One way to compute the difference is as follows:
Ending inventory X Fixed manufacturing overhead cost per unit
8,500 X $5 = $42,500

Questions Chapter 6 (Continued)
*20. If production equals sales in any given period, the net incomes under both methods will be equal.
*21. If production is greater than sales, absorption costing net income will be greater than variable
costing net income. Absorption costing net income is higher because some of the fixed
manufacturing overhead costs will be deferred in the inventory account until the products are
sold.
SOLUTIONS TO BRIEF EXERCISES
BRIEF EXERCISE 6-1
1. (a) $70 = ($250 – $180)
(b) 28% ($70 ÷ $250)
BRIEF EXERCISE 6-2
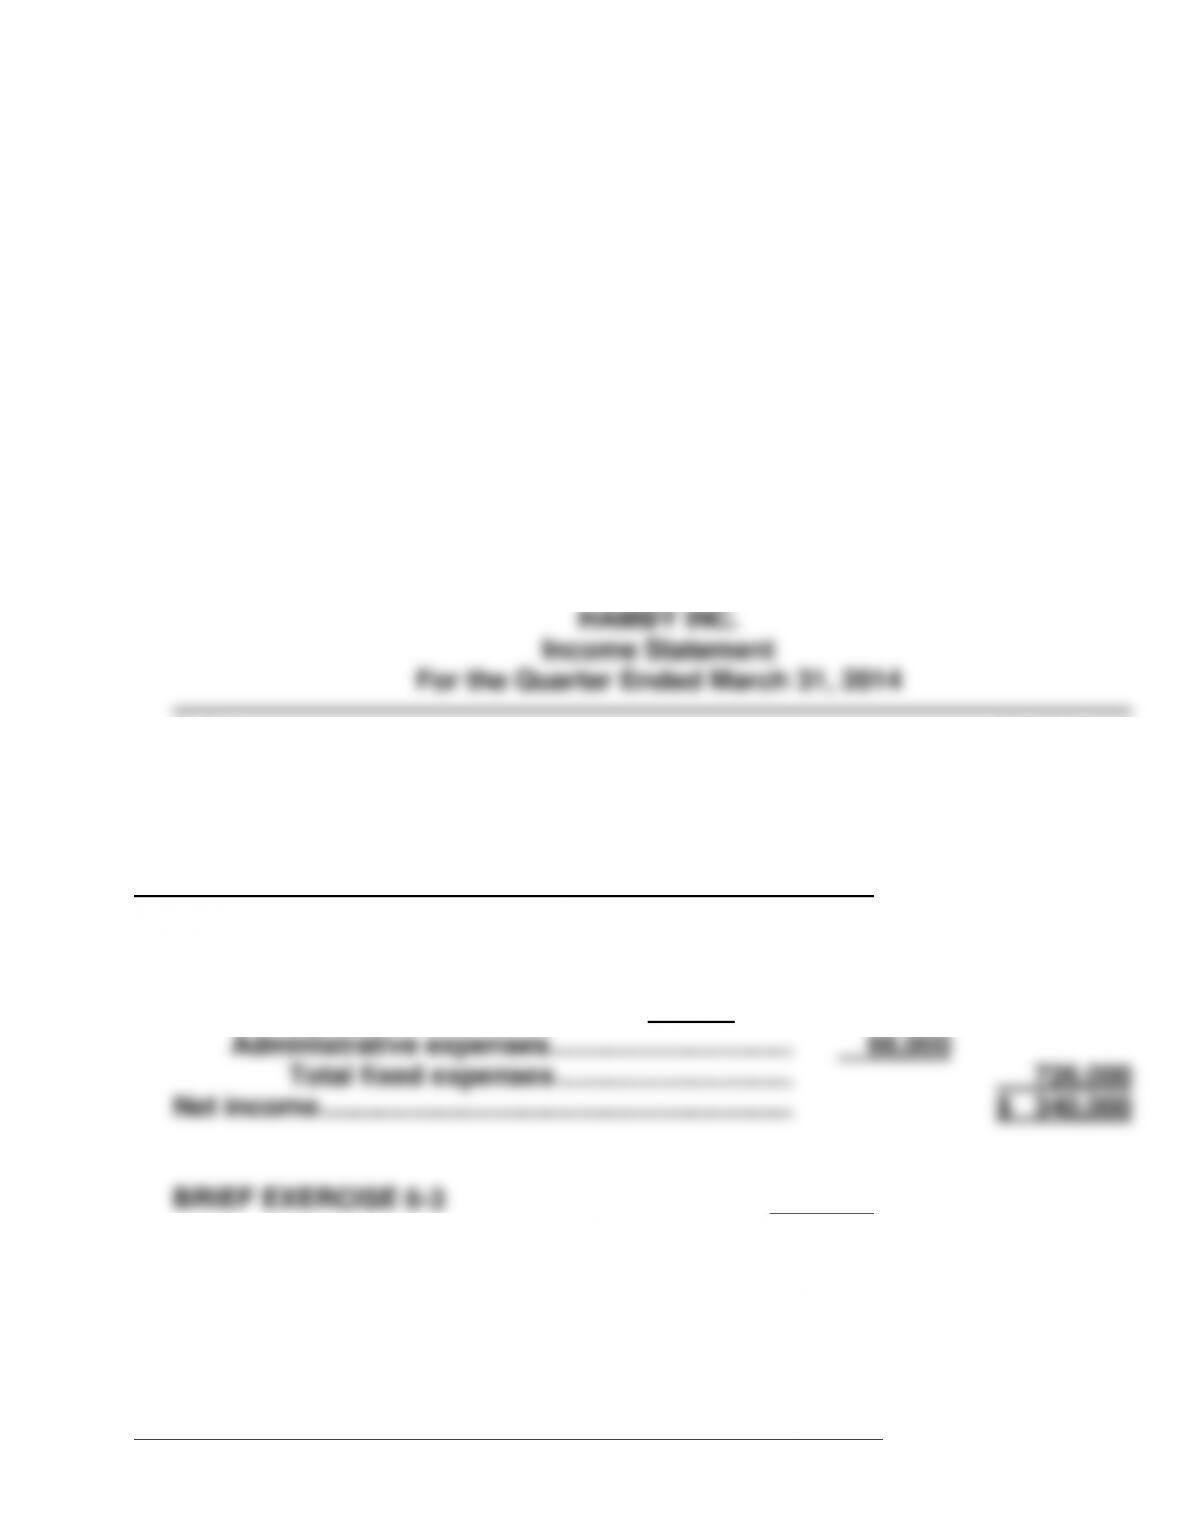
HAMBY INC.
Income Statement
For the Quarter Ended March 31, 2014
Sales ……………………………………………………………… $2,000,000
Variable expenses
Cost of goods sold ………………………………….. $760,000
Selling expenses……………………………………… 95,000
Administrative expenses ………………………….. 79,000
BRIEF EXERCISE 6-3

BRIEF EXERCISE 6-4
(a) $400Q = $250Q + $210,000 + $0
(b) Contribution margin per unit $150, or ($400 – $250)
BRIEF EXERCISE 6-5
BRIEF EXERCISE 6-6
Margin of safety = $1,200,000 – $960,000 = $240,000
Margin of safety ratio = $240,000 ÷ $1,200,000 = 20%
BRIEF EXERCISE 6-7
Model
Sales Mix
Percentage
Unit Contribution
Margin
Weighted-Average Unit
Contribution Margin
A12
B22
C124
60%
15%
25%
$10 ($50 – $40)
$30 ($100 – $70)
$100 ($400 – $300)
$ 6.00
4.50
25.00
$35.50
BRIEF EXERCISE 6-8
Total break-even = ($213,000 ÷ $35.50*) = 6,000 units
*Computed in BE 6-7
Sales Units
BRIEF EXERCISE 6-9
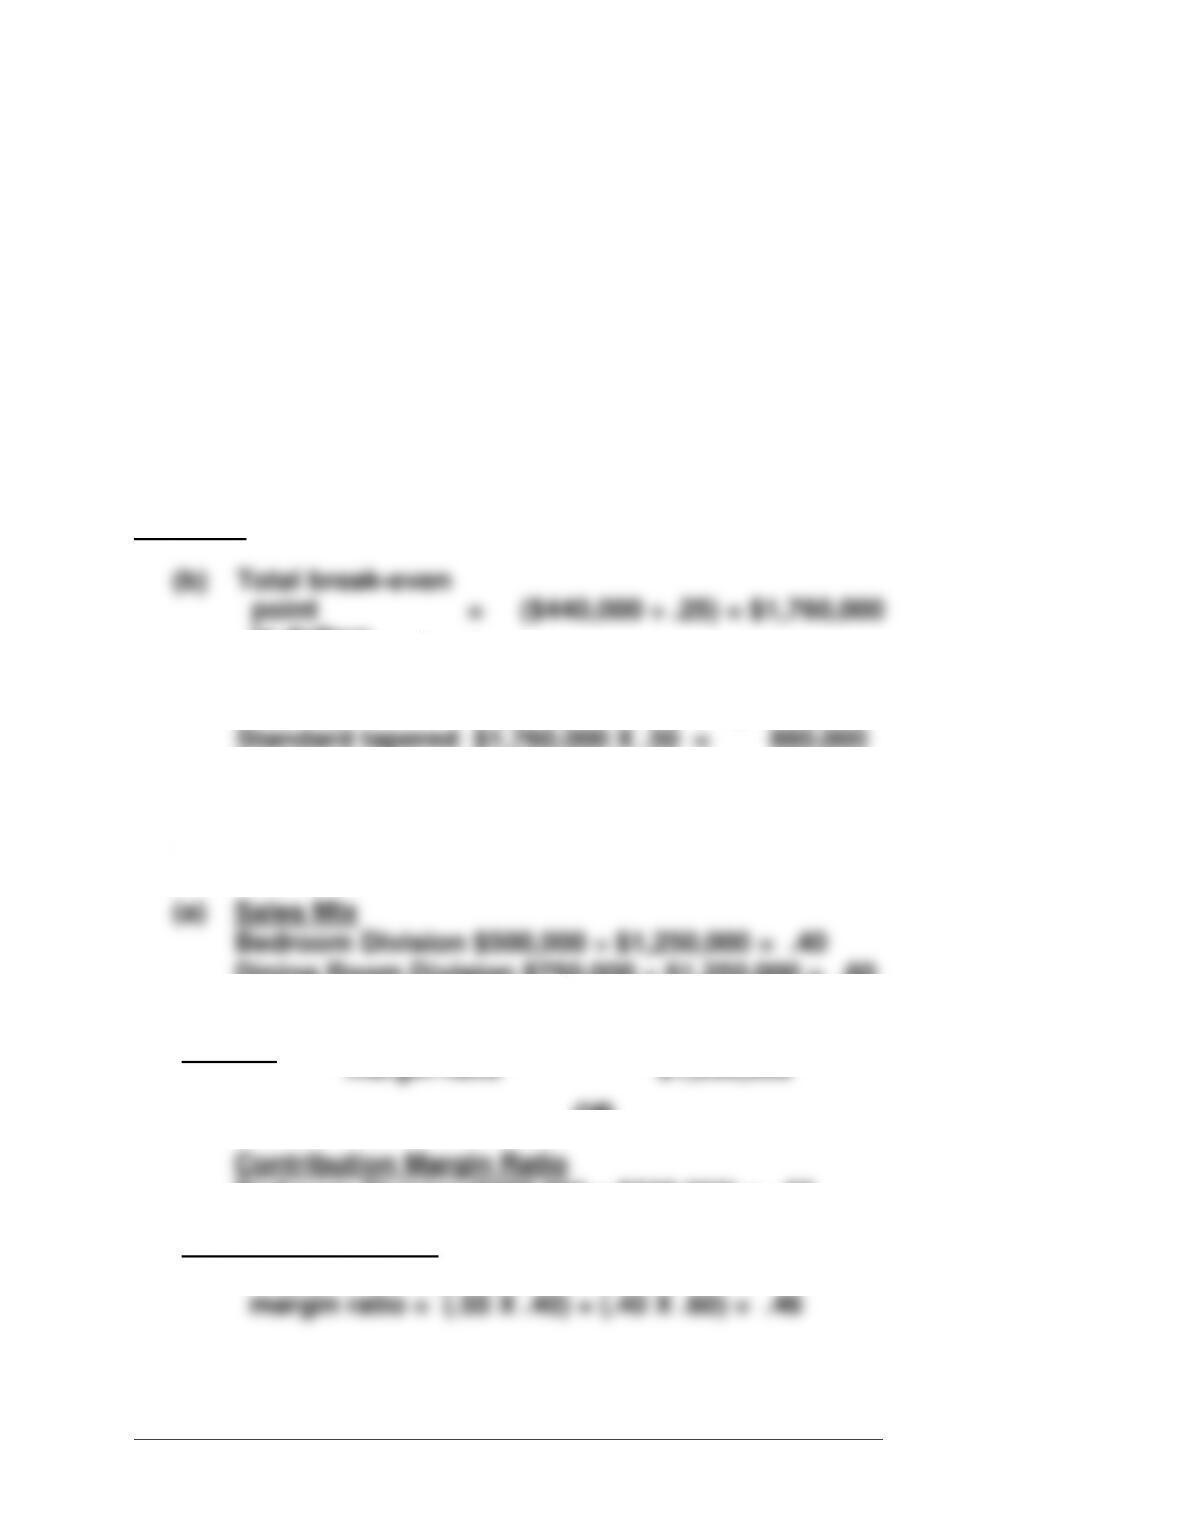
(a) Weighted-average
margin ratio
(b) Total break-even
point = ($440,000 ÷ .25) = $1,760,000
in dollars
BRIEF EXERCISE 6-10
(a) Sales Mix
(b)
Weight-average contribution
=
$575,000
= .46
margin ratio
$1,250,000
OR
Contribution Margin Ratio
Bedroom Division ($275,000 ÷ $500,000) = .55

BRIEF EXERCISE 6-11
Product A
Product B
Contribution margin per unit (a)
Machine hours required (b)
Contribution margin per unit of limited resource
[(a) ÷ (b)]
$12.0
2
$ 6
$15
3
$ 5
BRIEF EXERCISE 6-12
Degree of operating
leverage (old) = $200,000 ÷ $40,000 = 5
Degree of operating
leverage (new) = $240,000 ÷ $40,000 = 6
BRIEF EXERCISE 6-13
Break-even point in dollars:
Logan Co. Morgan Co.
$60,000 ÷ ($120,000 ÷ $200,000) $90,000 ÷ ($150,000 ÷ $200,000)
= $100,000 = $120,000
ratio of .75 ($150,000 ÷ $200,000) versus .60 ($120,000 ÷ $200,000), for Logan
BRIEF EXERCISE 6-14
Montana Corp. 1.6 = Contribution margin ÷ $50,000