CHAPTER 5
Cost-Volume-Profit
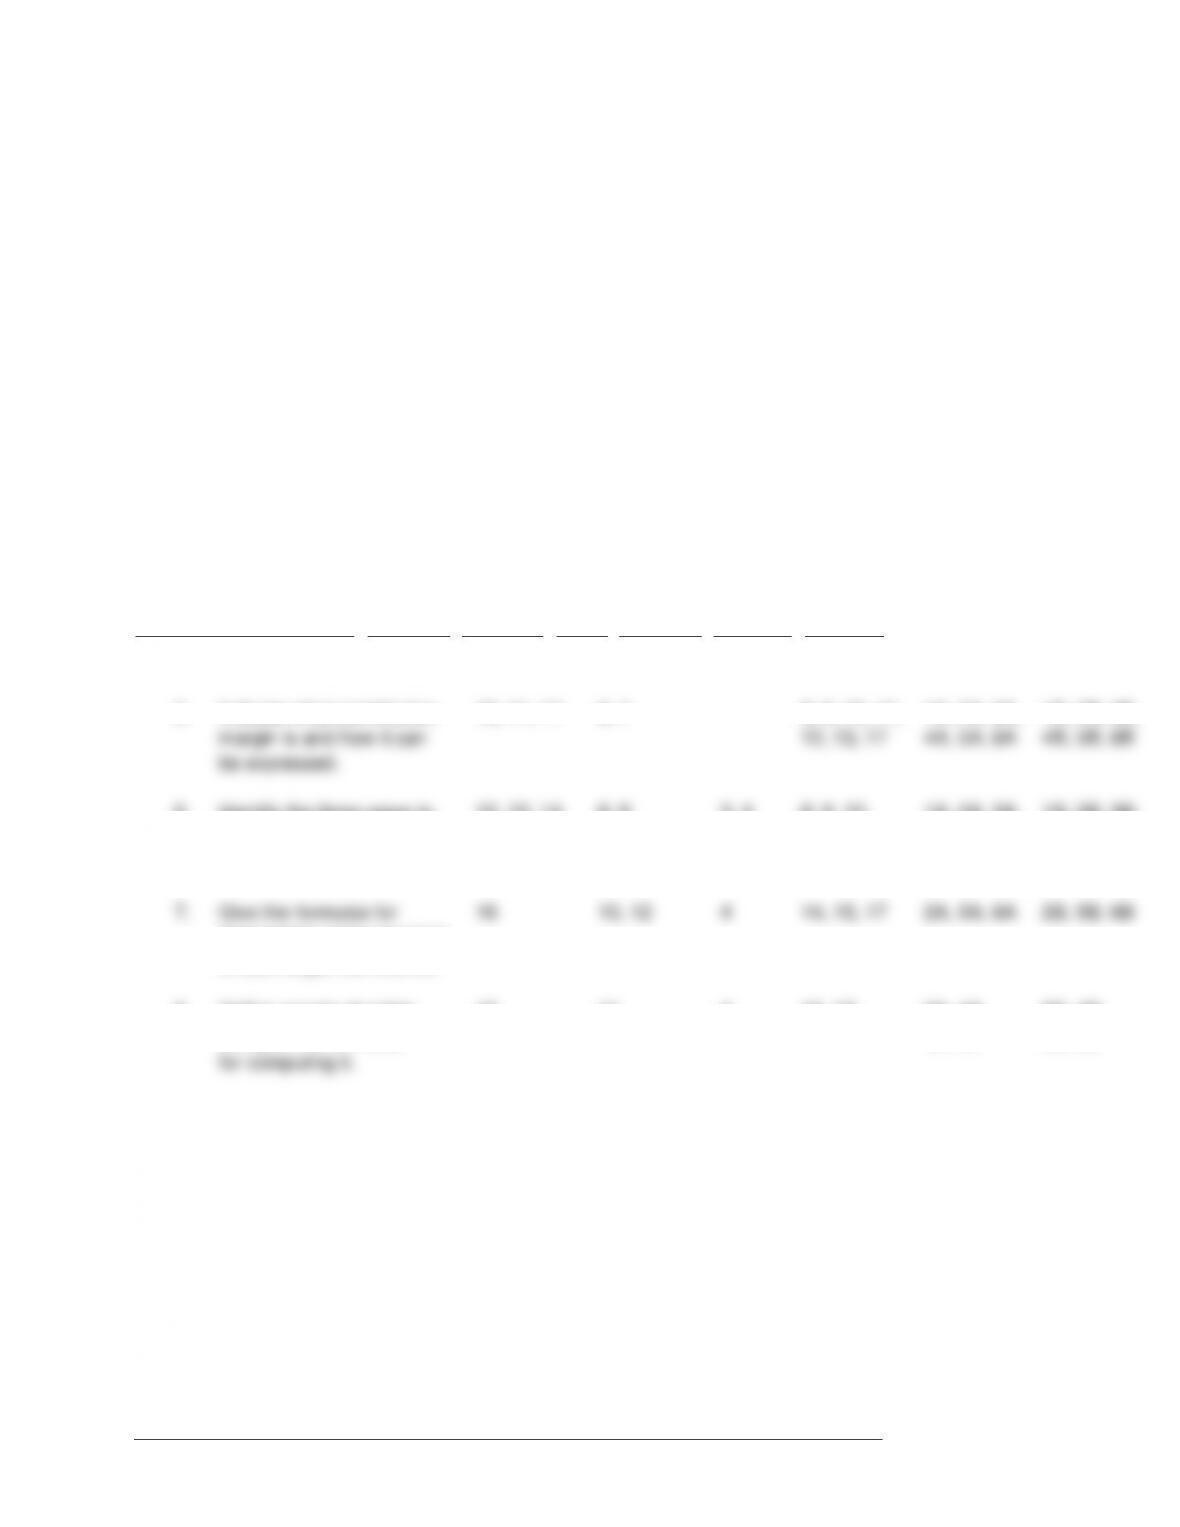
ASSIGNMENT CLASSIFICATION TABLE
Learning Objectives
Questions
Brief
Exercises
Do It!
Exercises
A
Problems
B
Problems
1. Distinguish between
variable and fixed costs.
1, 2, 3, 6
1
1
1, 2, 3, 4,
5, 6
1A, 6A
1B, 6B
2. Explain the significance
of the relevant range.
4, 5
2
2
3. Explain the concept of
mixed costs.
6, 7, 8
1, 3, 4, 5
1, 2
1, 3, 4,
5, 6
1A
1B
4. List the five components of
cost-volume-profit analysis.
9
7
5. Indicate what contribution
margin is and how it can
be expressed.
10, 11, 17
6, 7
8, 9, 10, 11,
12, 13, 17
1A, 2A, 3A,
4A, 5A, 6A
1B, 2B, 3B,
4B, 5B, 6B
6. Identify the three ways to
determine the break-even
point.
12, 13, 14
8, 9
3, 4
8, 9, 10,
11, 12, 13,
14, 16, 17
1A, 2A, 3A,
4A, 5A
1B, 2B, 3B,
4B, 5B
7. Give the formulas for
determining sales required
to earn target net income.
16
10, 12
4
14, 15, 17
2A, 5A, 6A
2B, 5B, 6B
8. Define margin of safety,
and give the formulas
for computing it.
15
11
4
16, 17
2A, 4A,
5A, 6A
2B, 4B,
5B, 6B
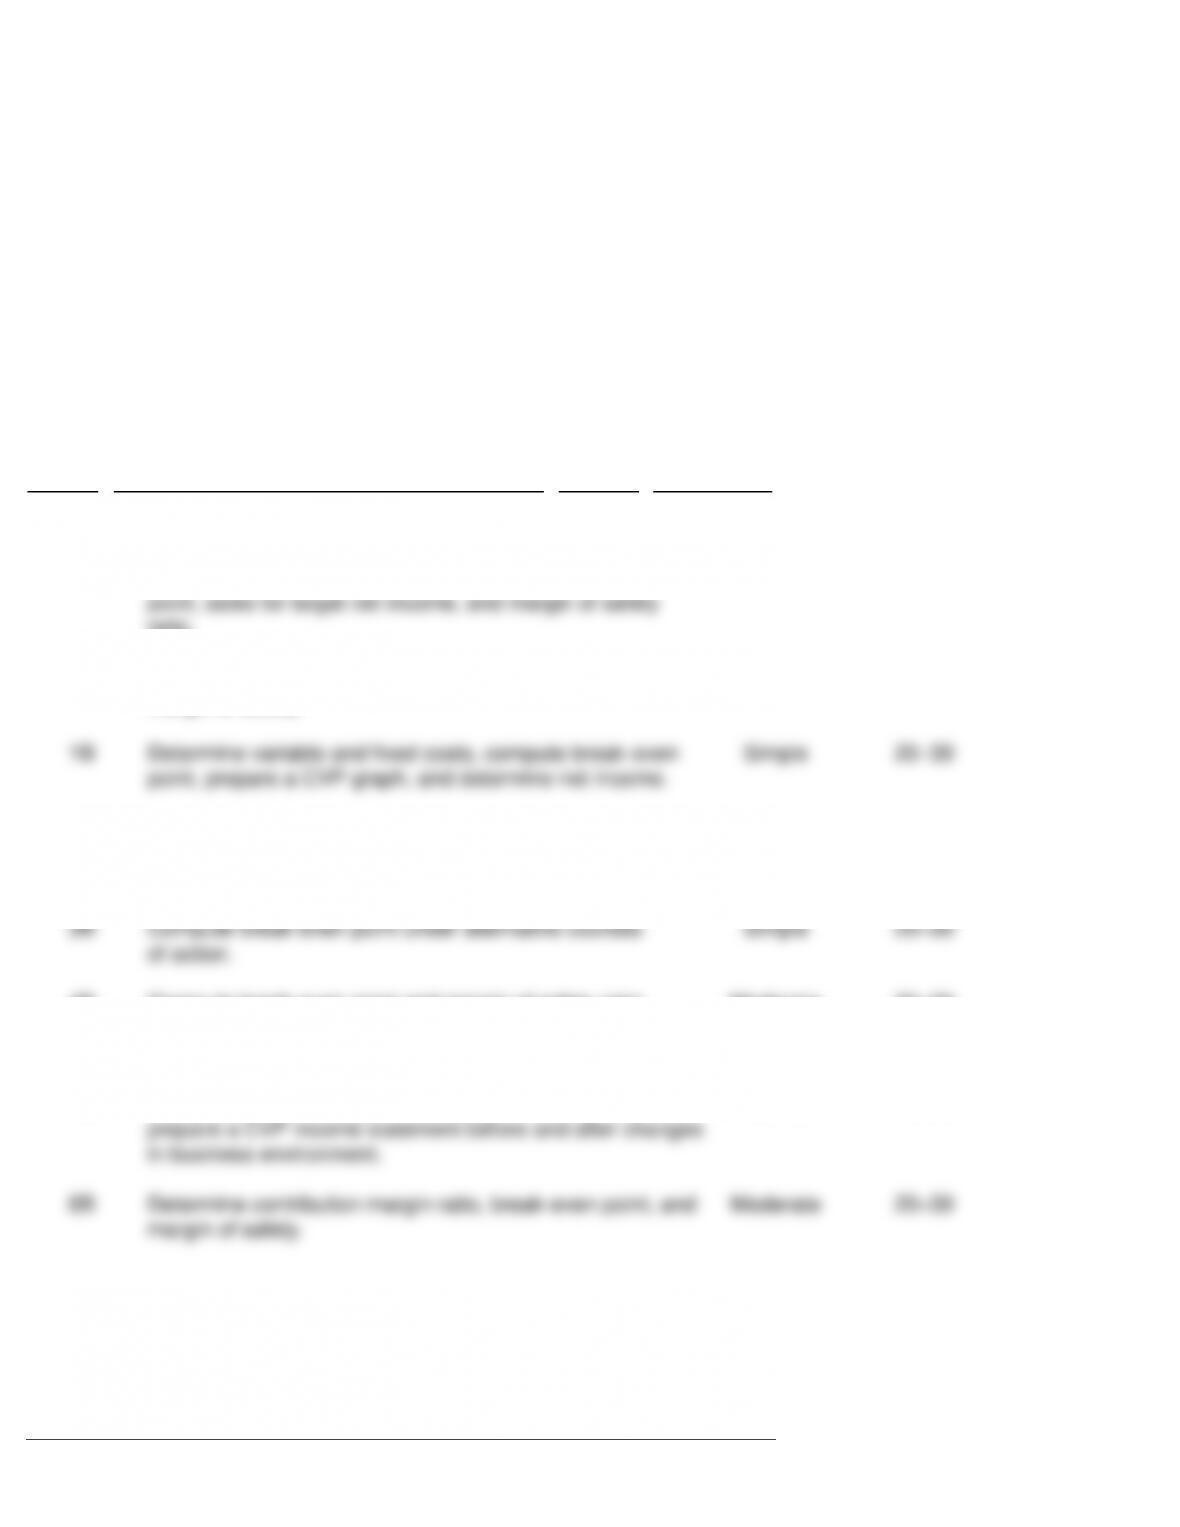
ASSIGNMENT CHARACTERISTICS TABLE
Problem
Number
Description
Difficulty
Level
Time
Allotted (min.)
1A
Determine variable and fixed costs, compute break-even
point, prepare a CVP graph, and determine net income.
Simple
20–30
2A
Prepare a CVP income statement, compute break-even
point, contribution margin ratio, margin of safety ratio,
and sales for target net income.
Moderate
30–40
3A
Compute break-even point under alternative courses
of action.
Simple
20–30
4A
Compute break-even point and margin of safety ratio,
and prepare a CVP income statement before and after
changes in business environment.
Moderate
20–30
5A
Compute contribution margin, fixed costs, break-even
point, sales for target net income, and margin of safety
ratio.
Moderate
20–30
6A
Determine contribution margin ratio, break-even point, and
margin of safety.
Moderate
20–30
1B
Determine variable and fixed costs, compute break-even
point, prepare a CVP graph, and determine net income.
Simple
20–30
2B
Prepare a CVP income statement, compute break-even
point, contribution margin ratio, margin of safety ratio,
and sales for target net income.
Moderate
30–40
3B
Compute break-even point under alternative courses
of action.
Simple
20–30
4B
Compute break-even point and margin of safety ratio,
and prepare a CVP income statement before and after
changes in business environment.
Moderate
20–30
5B
Compute break-even point and margin of safety ratio, and
prepare a CVP income statement before and after changes
in business environment.
Moderate
20–30
6B
Determine contribution margin ratio, break-even point, and
margin of safety.
Moderate
20–30
Copyright © 2012 John Wiley & Sons, Inc. Weygandt, Managerial Accounting, 6/e, Solutions Manual (For Instructor Use Only) 5-3
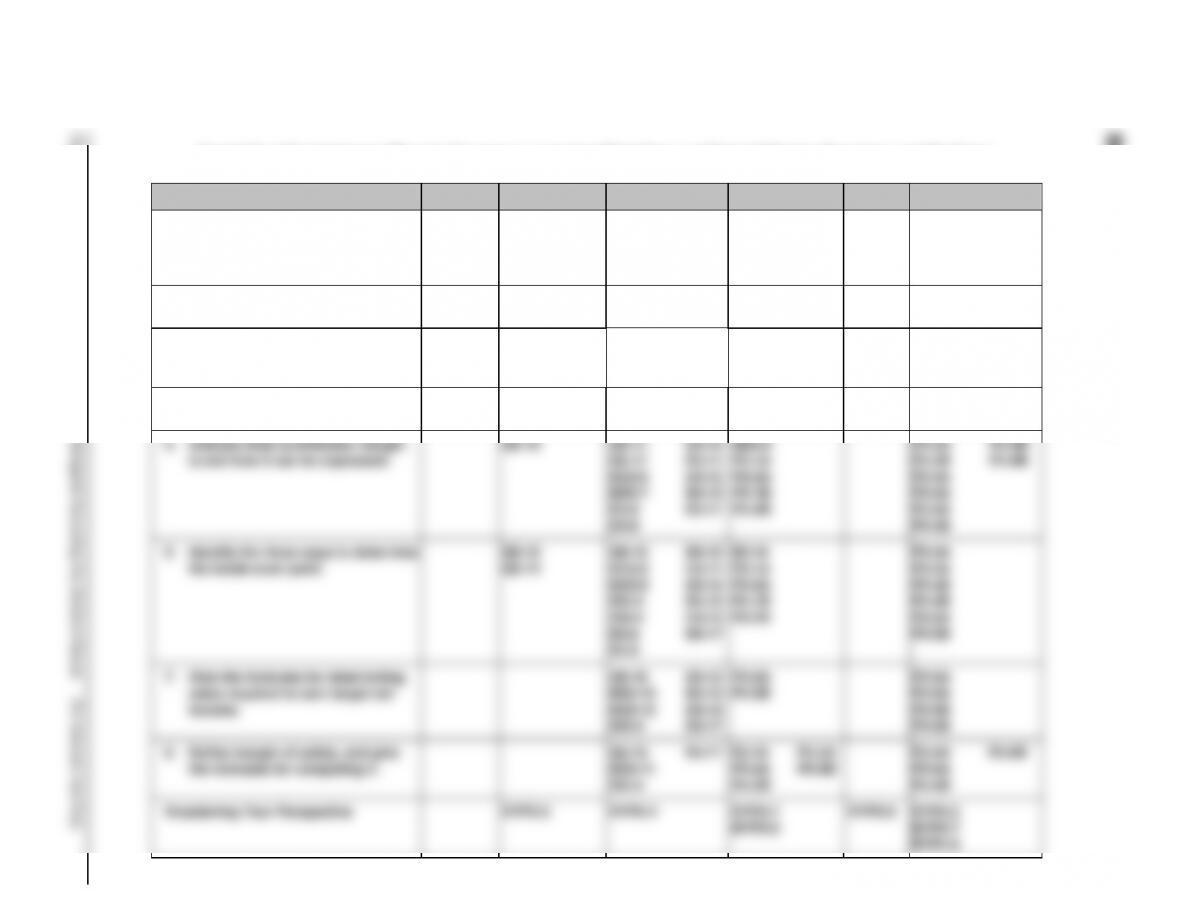
Correlation Chart between Bloom’s Taxonomy, Learning Objectives and End–of-Chapter Exercises and Problems
Learning Objective
Knowledge
Comprehension
Application
Analysis
Synthesis
Evaluation
* 1. Distinguish between variable and
fixed costs.
E5-4
Q5-1
Q5-2
Q5-3
Q5-6
BE5-1
E5-1
E5-2
DI5-1
E5-5
E5-3
E5-6
P5–1A
P5–1B
P5–6A
P5–6B
* 2. Explain the significance of the
relevant range.
Q5-4
Q5-5
E5-2
BE5-2
* 3. Explain the concept of mixed costs.
E5-4
E5-5
Q5-6
Q5-7
BE5-1
DI5-1
E5-1
Q5-8
BE5-4
BE5-5
DI5-2
E5-5
E5-6
BE5-3
E5-3
P5–1A
P5–1B
* 4. List the five components of
cost-volume-profit analysis.
E5-7
Q5-9
* 5. Indicate what contribution margin
is and how it can be expressed.
Q5–10
Q5–11
Q5–17
BE5-6
BE5-7
E5-8
E5-9
E5–10
E5–11
E5–12
E5–13
E5-17
BE5-6
P5–1A
P5–2A
P5–1B
P5–2B
P5–3A
P5–3B
P5–4A
P5–5A
P5–6A
P5–4B
P5–5B
P5–6B
* 6. Identify the three ways to determine
the break-even point.
Q5–12
Q5–14
Q5–13
BE5-8
BE5-9
DI5-3
DI5-4
E5-8
E5-9
E5–10
E5–11
E5–12
E5–13
E5–14
E5–17
E5–16
P5–1A
P5–2A
P5–1B
P5–2B
P5–3A
P5–4A
P5–3B
P5–4B
P5–5A
P5–5B
* 7. Give the formulas for determining
sales required to earn target net
income.
Q5–16
BE5-10
BE5-12
DI5-4
E5–12
E5–14
E5–15
E5–17
P5–2A
P5–2B
P5–5A
P5–6A
P5–5B
P5–6B
* 8. Define margin of safety, and give
the formulas for computing it.
Q5–15
BE5-11
DI5-4
E5–17
E5–16
P5–2A
P5–2B
P5–5A
P5–5B
P5–4A
P5–6A
P5–4B
P5–6B
Broadening Your Perspective
BYP5-6
BYP5-4
BYP5-1
BYP5-2
BYP5-5
BYP5-3
BYP5-7
BYP5-8
BLOOM’S TAXONOMY TABLE
ANSWERS TO QUESTIONS
1. (a) Cost behavior analysis is the study of how specific costs respond to changes in the level of activity
within a company.
between alternative courses of action.
2. (a) The activity index identifies the activity that causes changes in the behavior of costs. Once the
and proportionately with changes in the activity level. Variable costs per unit remain the
same at every level of activity.
3. Fixed costs remain the same in total regardless of changes in the activity level. In contrast, fixed
versa.
4. (a) The relevant range is the range of activity over which a company expects to operate during
the year.
remain linear within the relevant range.
5. This is true. Most companies operate within the relevant range. Within this range, it is possible to
6. Apartment rent is fixed because the cost per month remains the same regardless of how much Adam
7. For CVP analysis, mixed costs must be classified into their fixed and variable elements. One approach
8. Variable cost per unit is $1.30, or [($165,000 – $100,000) ÷ (90,000 – 40,000)]. At any level of activity,
9. No. Only two of the basic components of cost-volume-profit (CVP) analysis, unit selling prices and
10. There is no truth in Faye’s statement. Contribution margin is sales less variable costs. It is the
11. Contribution margin is $14 ($40 – $26). The contribution margin ratio is 35% ($14 ÷ $40).

Questions Chapter 5 (Continued)
12. Disagree. Knowledge of the break-even point is useful to management in deciding whether to introduce
13. $26,000 ÷ 25% = $104,000
14. (a) The break-even point involves the plotting of three lines over the full range of activity: the total
horizontal axis. The break-even point in sales dollars is obtained by drawing a horizontal line from
the break-even point to the vertical axis.
15. Margin of safety is the difference between actual or expected sales and sales at the break-even
16. At break-even sales, the contribution margin is equal to the fixed costs. The contribution margin
ratio is:
$180,000
$500,000
= 36%
$180,000 + $90,000
.36
= $750,000
17. PACE COMPANY
CVP Income Statement
Sales ……………………………………………………………………………………. $900,000
Variable expenses
Cost of goods sold ($600,000 X .70) …………………………………… $420,000
SOLUTIONS TO BRIEF EXERCISES
BRIEF EXERCISE 5-1
Indirect labor is a variable cost because it increases in total directly and
proportionately with the change in the activity level.
BRIEF EXERCISE 5-2
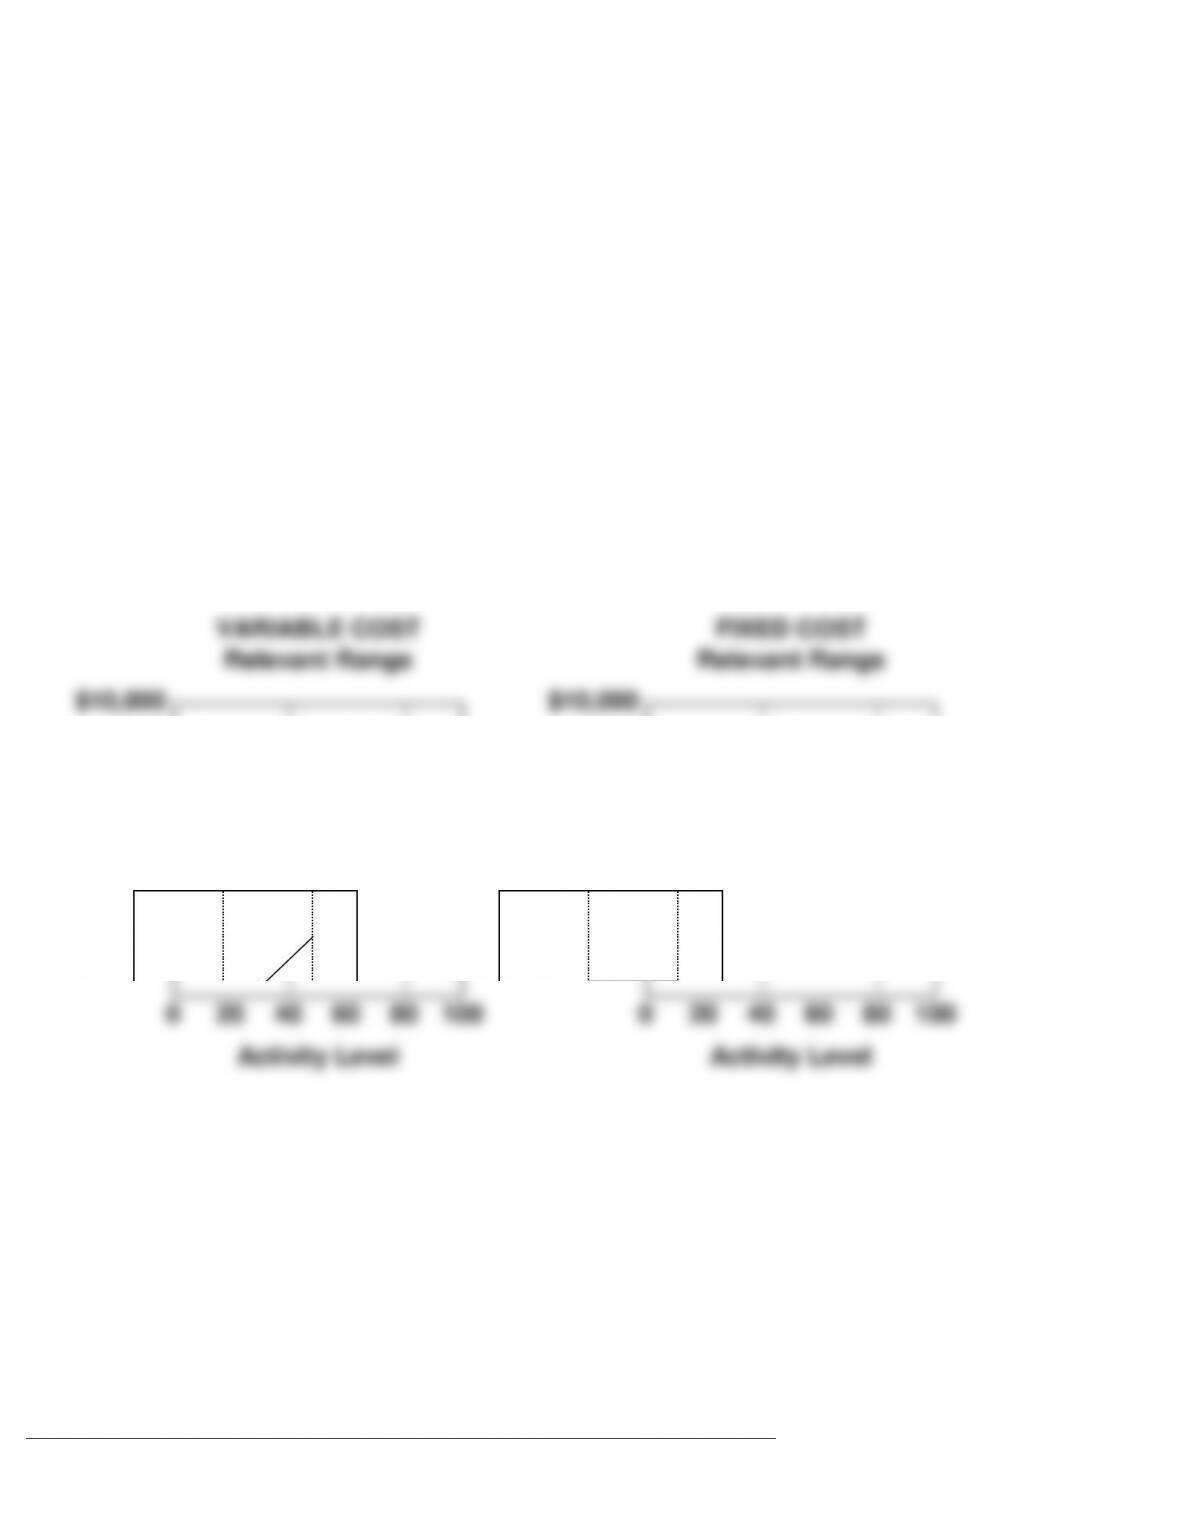
VARIABLE COST
Relevant Range
FIXED COST
Relevant Range
$10,000
$10,000
8,000
8,000
6,000
6,000
4,000
4,000
2,000
2,000
0
20
40
60
80
100
0
20
40
60
80
100
Activity Level
Activity Level
BRIEF EXERCISE 5-3
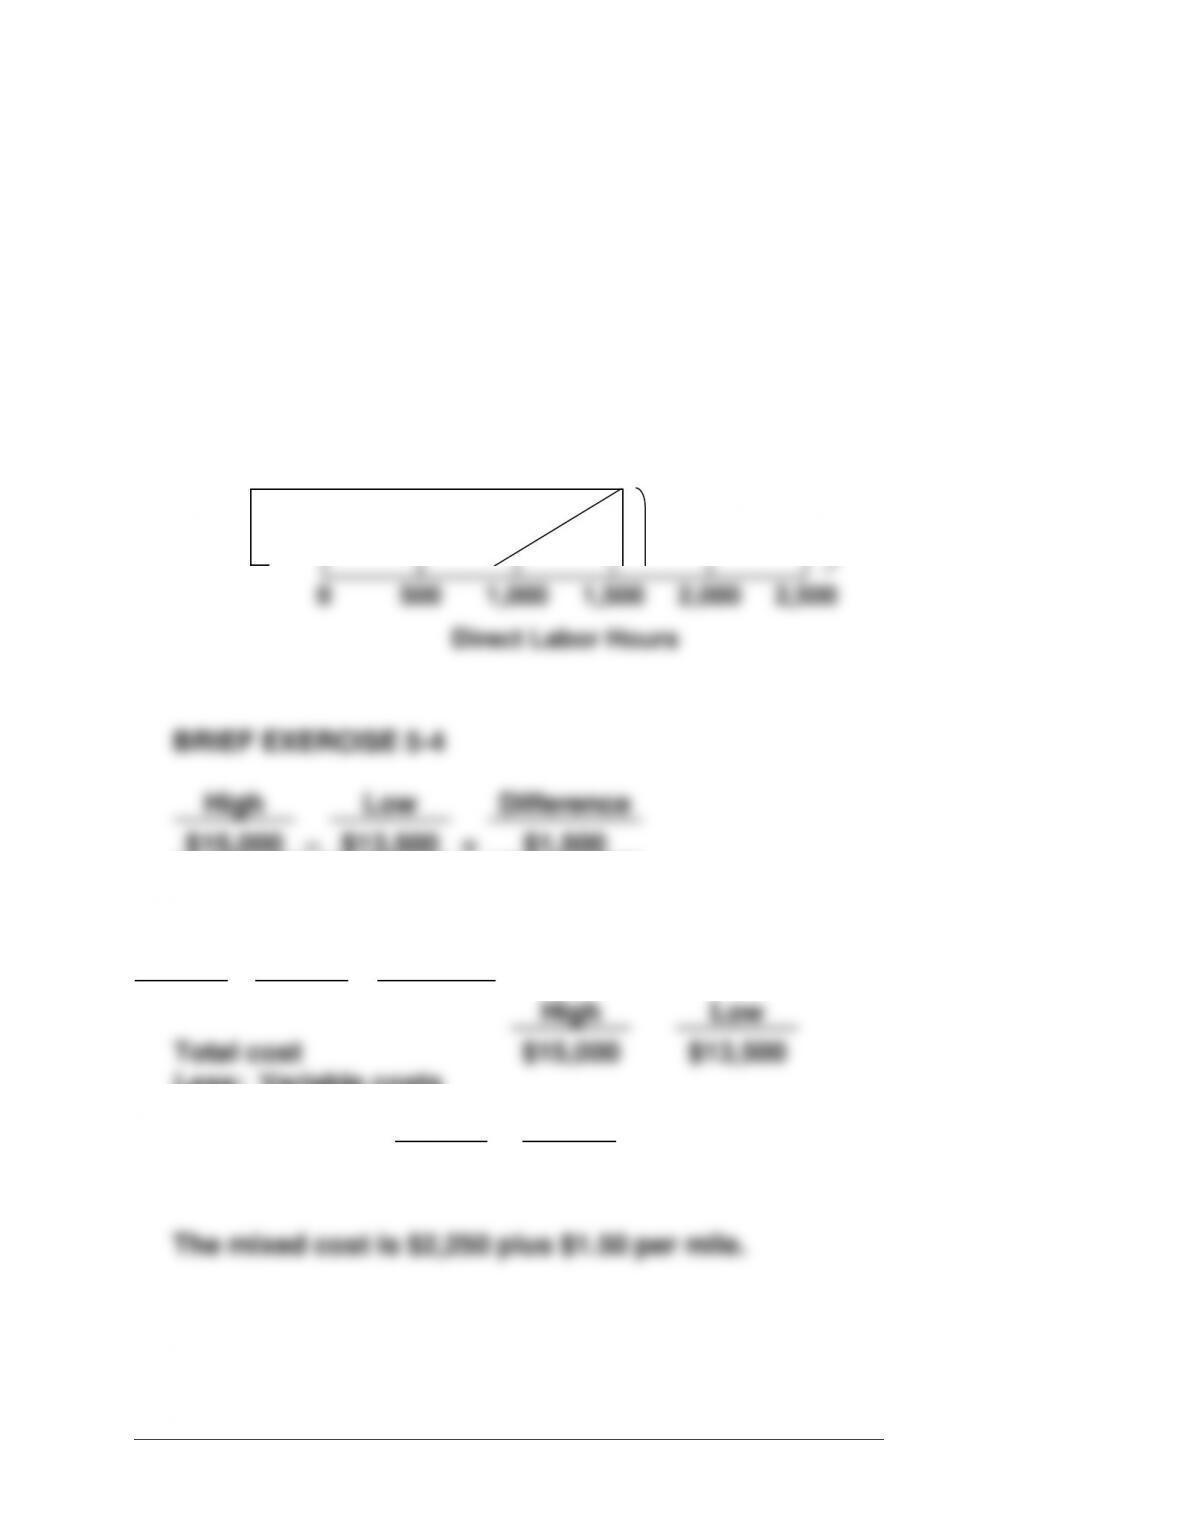
$60,000
COST
Total Cost Line
45,000
30,000
Variable Cost Element
15,000
Fixed Cost Element
0
500
1,000
1,500
2,000
2,500
Direct Labor Hours
BRIEF EXERCISE 5-4
High
Low
Difference
$15,000
–
$13,500
=
$1,500
8,500
–
7,500
=
1,000
$1,500 ÷ 1,000 = $1.50—Variable cost per mile.
High
Low
Total cost
Less: Variable costs
8,500 X $1.50
7,500 X $1.50
Total fixed costs
$15,000
12,750
$ 2,250
$13,500
11,250
$ 2,250
The mixed cost is $2,250 plus $1.50 per mile.

BRIEF EXERCISE 5-5
High
Low
Difference
$66,100
–
$32,000
=
$34,100
40,000
–
18,000
=
22,000
$34,100 ÷ 22,000 = $1.55 per unit.
Activity Level
High
Low
Total cost
Less: Variable costs
40,000 X $1.55
18,000 X $1.55
Total fixed costs
$66,100
62,000
000,000
$ 4,100
$32,000
27,900
$ 4,100
BRIEF EXERCISE 5-6
1. (a) $288 = ($640 – $352)
(b) 45% ($288 ÷ $640)
BRIEF EXERCISE 5-7
RADIAL INC.
CVP Income Statement
For the Quarter Ended March 31, 2014
Sales ………………………………………………………………………. $2,400,000
Variable costs ($920,000 + $70,000 + $86,000) …………… 1,076,000
BRIEF EXERCISE 5-8
(a) $520Q – $286Q – $163,800 = $0
(b) Contribution margin per unit $234, or ($520 – $286)
BRIEF EXERCISE 5-9
Contribution margin ratio = [($300,000 – $180,000) ÷ $300,000] = 40%
BRIEF EXERCISE 5-10
$1 = .30.
Required sales in dollars = ($195,000 + $75,000) ÷ .30 = $900,000
BRIEF EXERCISE 5-11
Margin of safety = $1,000,000 – $840,000 = $160,000
BRIEF EXERCISE 5-12
Contribution margin per unit $1.60 is ($6.00 – $4.40)
SOLUTIONS FOR DO IT! REVIEW EXERCISES
DO IT! 5-1
Fixed costs: Property taxes and depreciation.
DO IT! 5-2
(a) Variable cost: ($18,580 – $16,200) ÷ (10,500 – 8,800) = $1.40 per unit
(b) Total cost to produce 9,200 units: $3,880 + ($1.40 X 9,200) = $16,760
DO IT! 5-3
(b) The contribution margin per unit is $80 ($250 – $170). The formula
DO IT! 5-4
$12 = $30 – $18
CM ratio = CM per unit/Unit selling price