PROBLEM 3-2A
(a)
Physical units
Units to be accounted for
Work in process, June 1
Started into production
Total units
Units accounted for
Transferred out
Work in process, June 30
Total units
0
22,000
22,000
20,000
2,000
22,000
(b)
Equivalent units
Materials
Conversion Costs
Units transferred out
Work in process, June 30
2,000 X 100%
2,000 X 40%
Total equivalent units
20,000
2,000
22,000
20,000
800
20,800
(c)
Unit Costs
Materials
Conversion costs
Total unit cost
$9.00 ($198,000 ÷ 22,000)
$8.00 ($166,400* ÷ 20,800)
$17.00 ($9.00 + $8.00)
*$53,600 + $112,800
(d) Costs accounted for
Transferred out (20,000 X $17.00) $340,000
Work in process, June 30
PROBLEM 3-2A (Continued)
(e) ROSENTHAL COMPANY
Molding Department
Production Cost Report
For the Month Ended June 30, 2014
Equivalent Units
Quantities
Physical
Units
Materials
Conversion
Costs
(Step 1)
(Step 2)
Units to be accounted for
Work in process, June 1
Started into production
Total units
Units accounted for
Transferred out
0
22,000
22,000
20,000
20,000
20,000
Work in process, June 30
2,000
2,000
800
(2,000 X 40%)
Total units
22,000
22,000
20,800
Costs
Materials
Conversion
Costs
Total
Unit costs (Step 3)
Total cost
Equivalent units
Unit costs (a) ÷ (b)
Costs to be accounted for
Work in process, June 1
Started into production
Total costs
(a)
(b)
$198,000
22,000
$9.00
$166,400
20,800
$8.00
$364,400
$17.00
$ 0
364,400
$364,400
Cost Reconciliation Schedule (Step 4)
Costs accounted for
Transferred out (20,000 X $17.00)
Work in process, June 30
Materials (2,000 X $9.00)
Conversion costs (800 X $8.00)
Total costs
$18,000
6,400
$340,000
24,400
$364,400
PROBLEM 3-3A
(a) (1) Physical units
T12
Tables
C10
Chairs
Units to be accounted for
Work in process, July 1
Started into production
Total units
Units accounted for
Transferred out
Work in process, July 31
Total units
0
19,000
19,000
16,000
3,000
19,000
0
16,000
16,000
15,500
500
16,000
(2) Equivalent units
T12 Tables
Materials
Conversion
Costs
Units transferred out
Work in process, July 31
(3,000 X 100%)
(3,000 X 60%)
Total equivalent units
16,000
3,000
19,000
16,000
1,800
17,800
C10 Chairs
Materials
Conversion
Costs
Units transferred out
Work in process, July 31
(500 X 100%)
(500 X 80%)
16,000
15,500
500
15,500
400
PROBLEM 3-3A (Continued)
(3) Unit costs
T12
Tables
C10
Chairs
Materials ($380,000 ÷ 19,000)
($288,000 ÷ 16,000)
Conversion costs ($338,200(a) ÷ 17,800)
($206,700(b) ÷ 15,900)
Total
$20
19
$39
$18
13
$31
(a)$234,200 + $104,000
(b)$110,000 + $96,700
(4) T12 Tables
Costs accounted for
Transferred out (16,000 X $39) $624,000
Work in process
C10 Chairs
Costs accounted for
Transferred out (15,500 X $31) $480,500
Work in process
PROBLEM 3-3A (Continued)
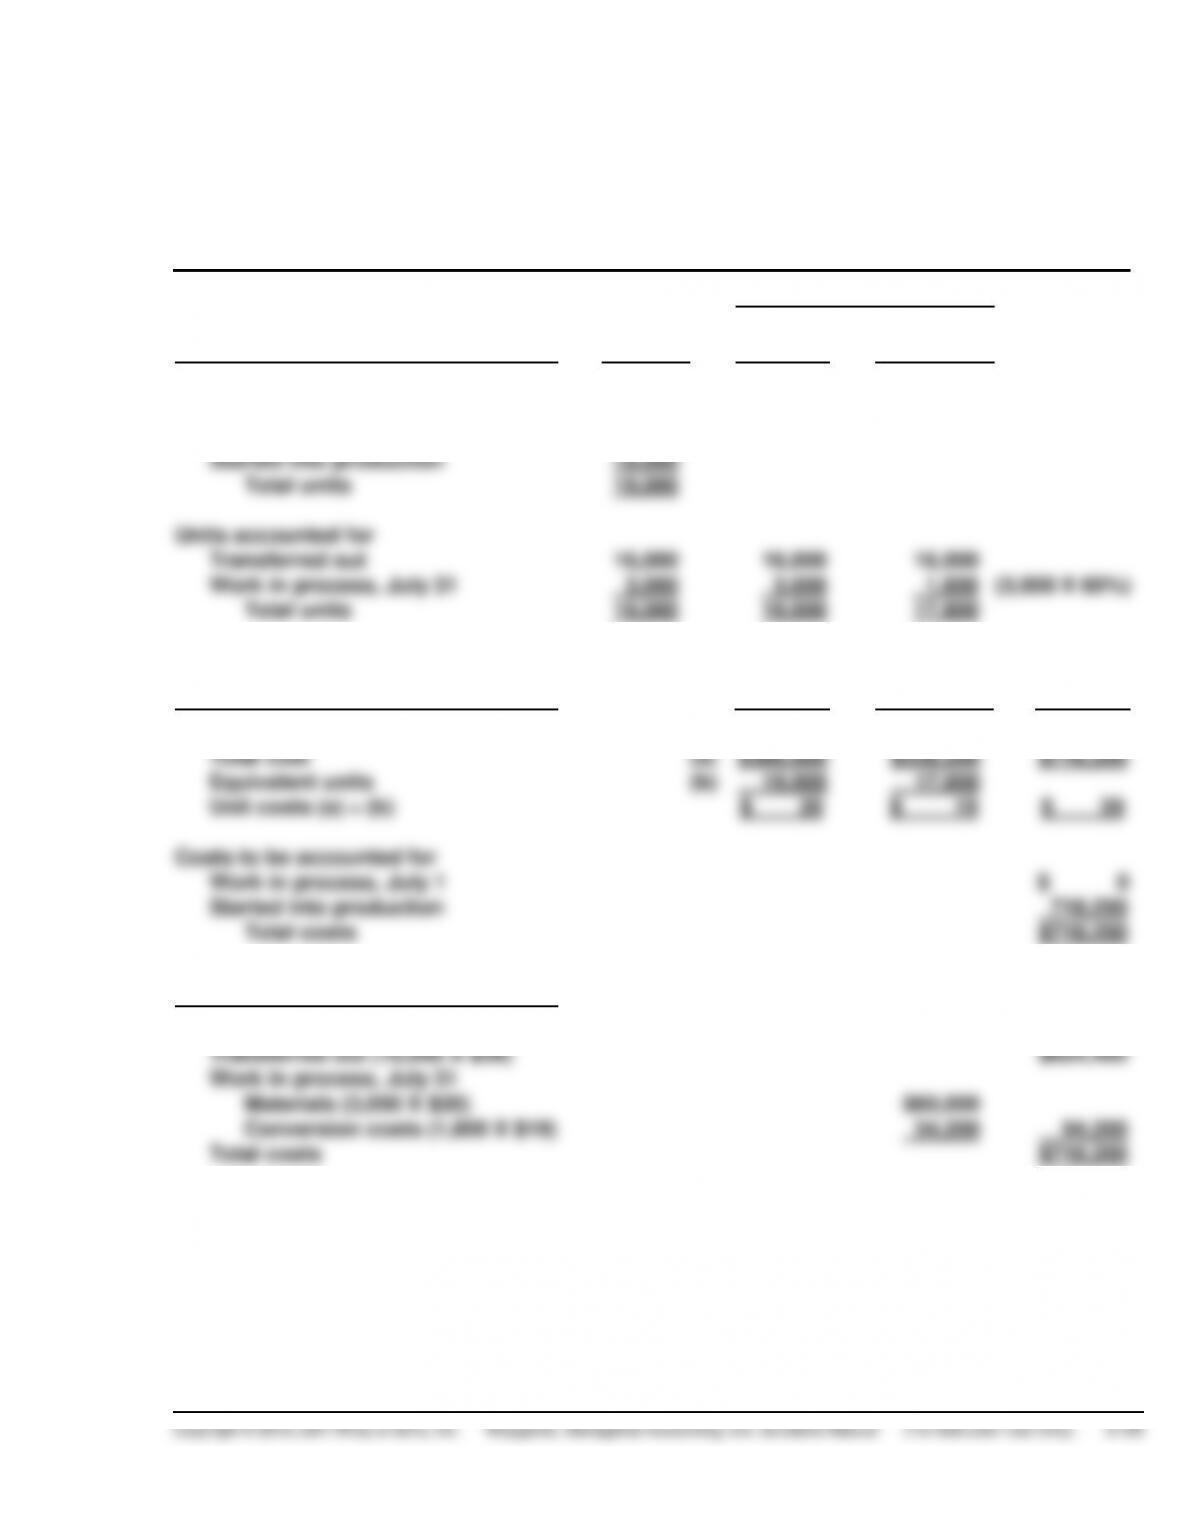
(b) SEAGREN INDUSTRIES INC.
Cutting Department—Plant 1
Production Cost Report
For the Month Ended July 31, 2014
Equivalent Units
Quantities
Physical
Units
Materials
Conversion
Costs
(Step 1)
(Step 2)
Units to be accounted for
Work in process, July 1
Started into production
Total units
Units accounted for
Transferred out
0
19,000
19,000
16,000
16,000
16,000
Work in process, July 31
3,000
3,000
1,800
(3,000 X 60%)
Total units
19,000
19,000
17,800
Costs
Materials
Conversion
Costs
Total
Unit costs (Step 3)
Total cost
Equivalent units
Unit costs (a) ÷ (b)
Costs to be accounted for
Work in process, July 1
Started into production
Total costs
(a)
(b)
$380,000
19,000
$ 20
$338,200
17,800
$ 19
$718,200
$ 39
$ 0
718,200
$718,200
Cost Reconciliation Schedule (Step 4)
Costs accounted for
Transferred out (16,000 X $39)
Work in process, July 31
Materials (3,000 X $20)
Conversion costs (1,800 X $19)
Total costs
$60,000
34,200
$624,400
94,200
$718,200
PROBLEM 3-4A
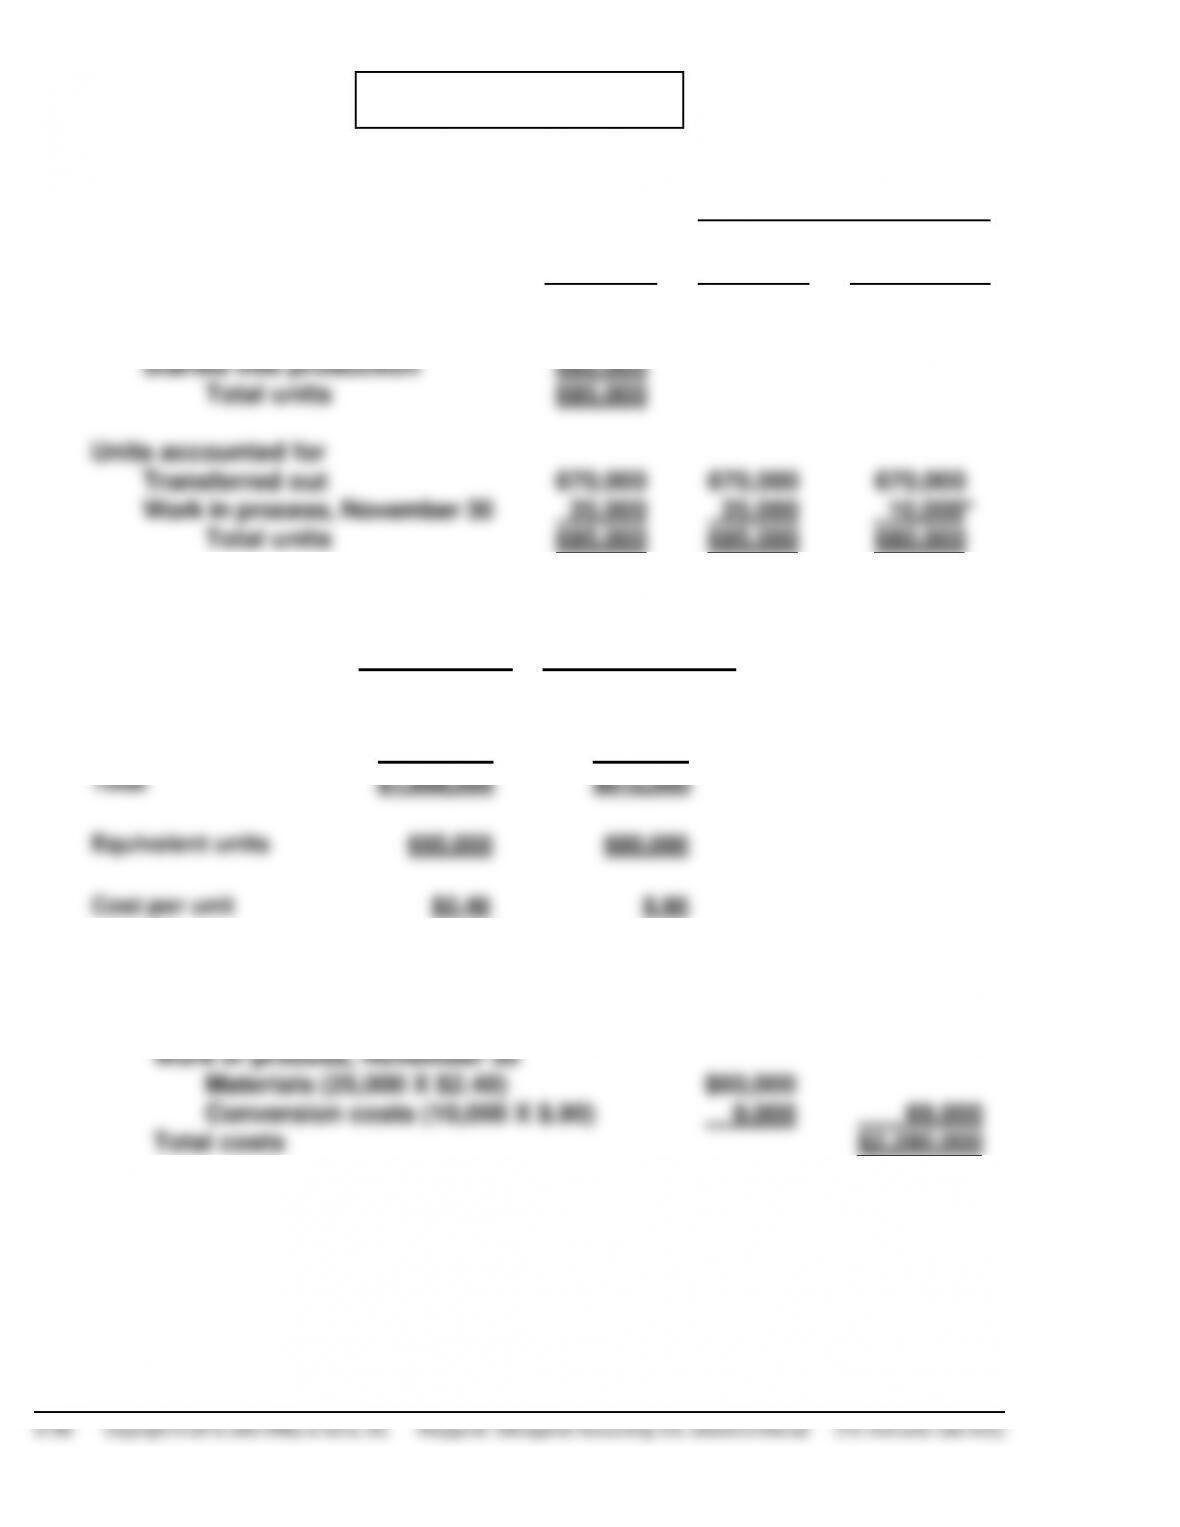
(a)
Equivalent Units
Physical
Units
Materials
Conversion
Costs
Units to be accounted for
Work in process, November 1
Started into production
Total units
Units accounted for
Transferred out
Work in process, November 30
Total units
35,000
660,000
695,000
670,000
25,000
695,000
670,000
25,000
695,000
670,000
10,000*
680,000
*25,000 X 40%
Beginning work in
process
Added during month
Total
Equivalent units
Cost per unit
Materials cost
$ 79,000
1,589,000
$1,668,000
695,000
$2.40
Conversion costs
$ 48,150
563,850
$612,000
680,000
$.90
($225,920 + $337,930)
(b)
Costs accounted for
Transferred out (670,000 X $3.30)
Work in process, November 30
Materials (25,000 X $2.40)
Conversion costs (10,000 X $.90)
Total costs
$60,000
9,000
$2,211,000
69,000
$2,280,000
PROBLEM 3-4A (Continued)
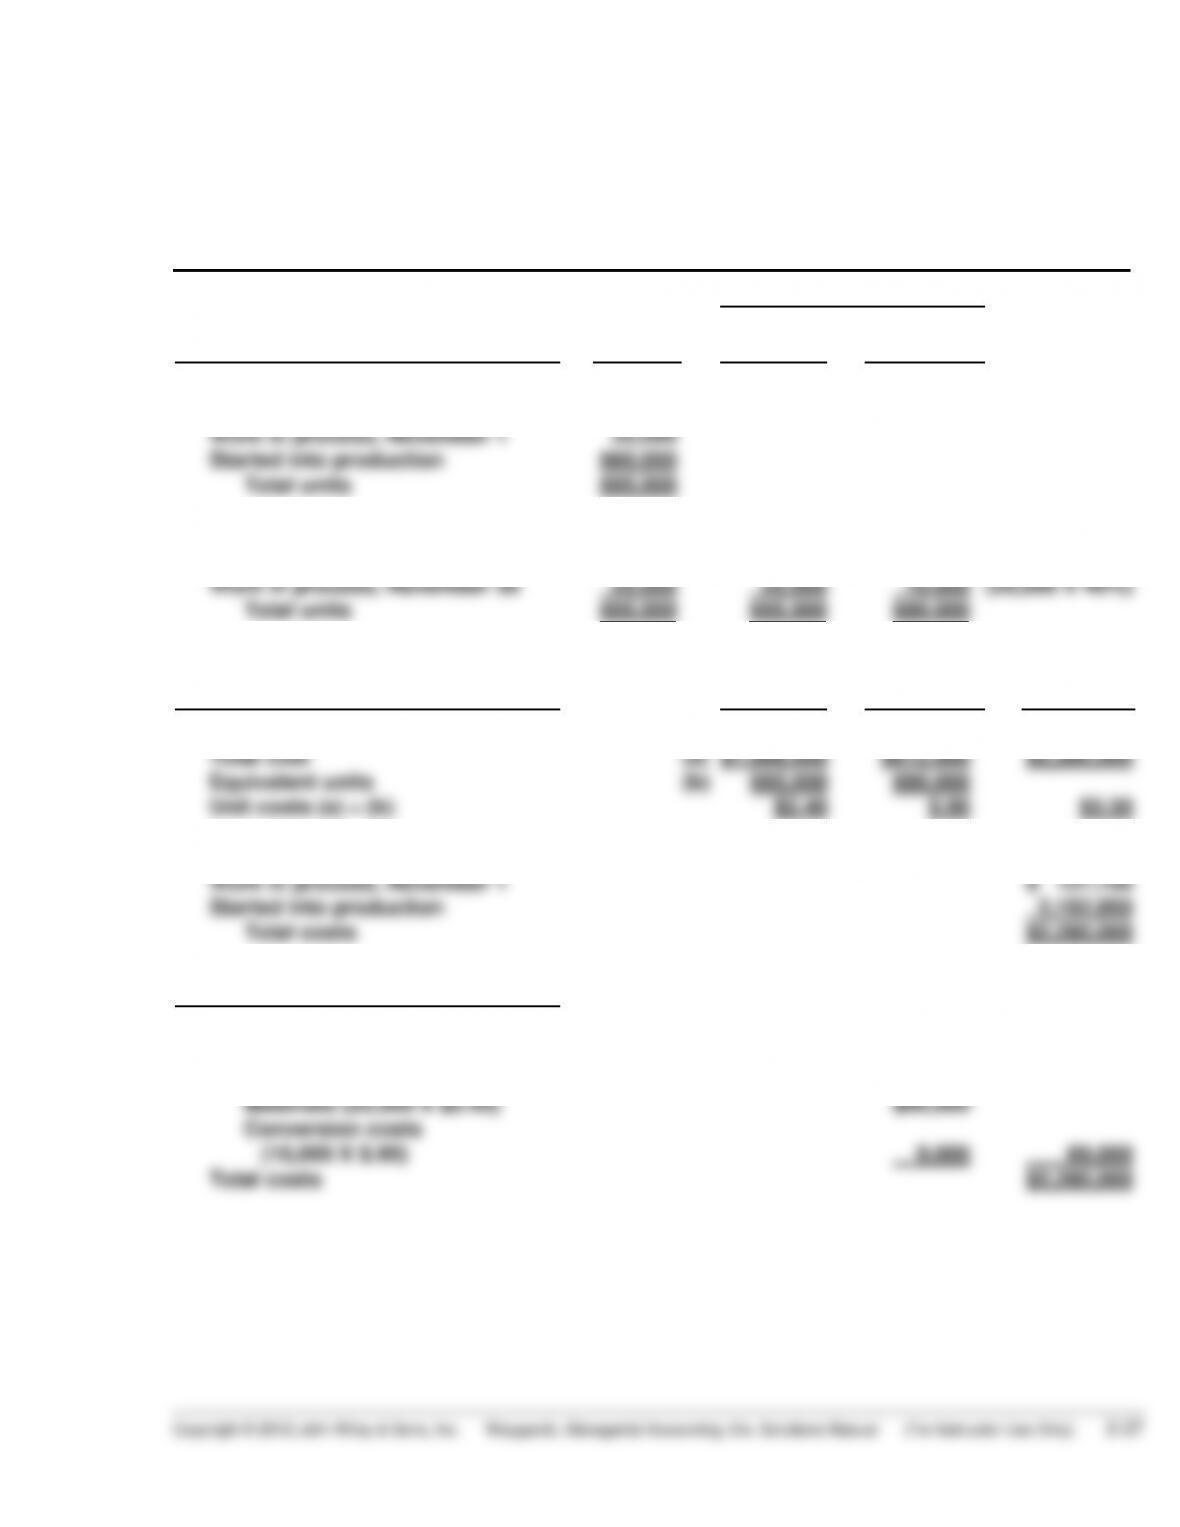
(c) RIVERA COMPANY
Assembly Department
Production Cost Report
For the Month Ended November 30, 2014
Equivalent Units
Quantities
Physical
Units
Materials
Conversion
Costs
(Step 1)
(Step 2)
Units to be accounted for
Work in process, November 1
Started into production
Total units
Units accounted for
Transferred out
35,000
660,000
695,000
670,000
670,000
670,000
Work in process, November 30
25,000
25,000
10,000
(25,000 X 40%)
Total units
695,000
695,000
680,000
Costs
Materials
Conversion
Costs
Total
Unit costs (Step 3)
Total cost
Equivalent units
Unit costs (a) ÷ (b)
Costs to be accounted for
Work in process, November 1
Started into production
Total costs
(a)
(b)
$1,668,000
695,000
$2.40
$612,000
680,000
$.90
$2,280,000
$3.30
$ 127,150
2,152,850
$2,280,000
Cost Reconciliation Schedule (Step 4)
Costs accounted for
Transferred out (670,000 X $3.30)
Work in process, November 30
Materials (25,000 X $2.40)
Conversion costs
(10,000 X $.90)
Total costs
$60,000
9,000
$2,211,000
69,000
$2,280,000
PROBLEM 3-5A
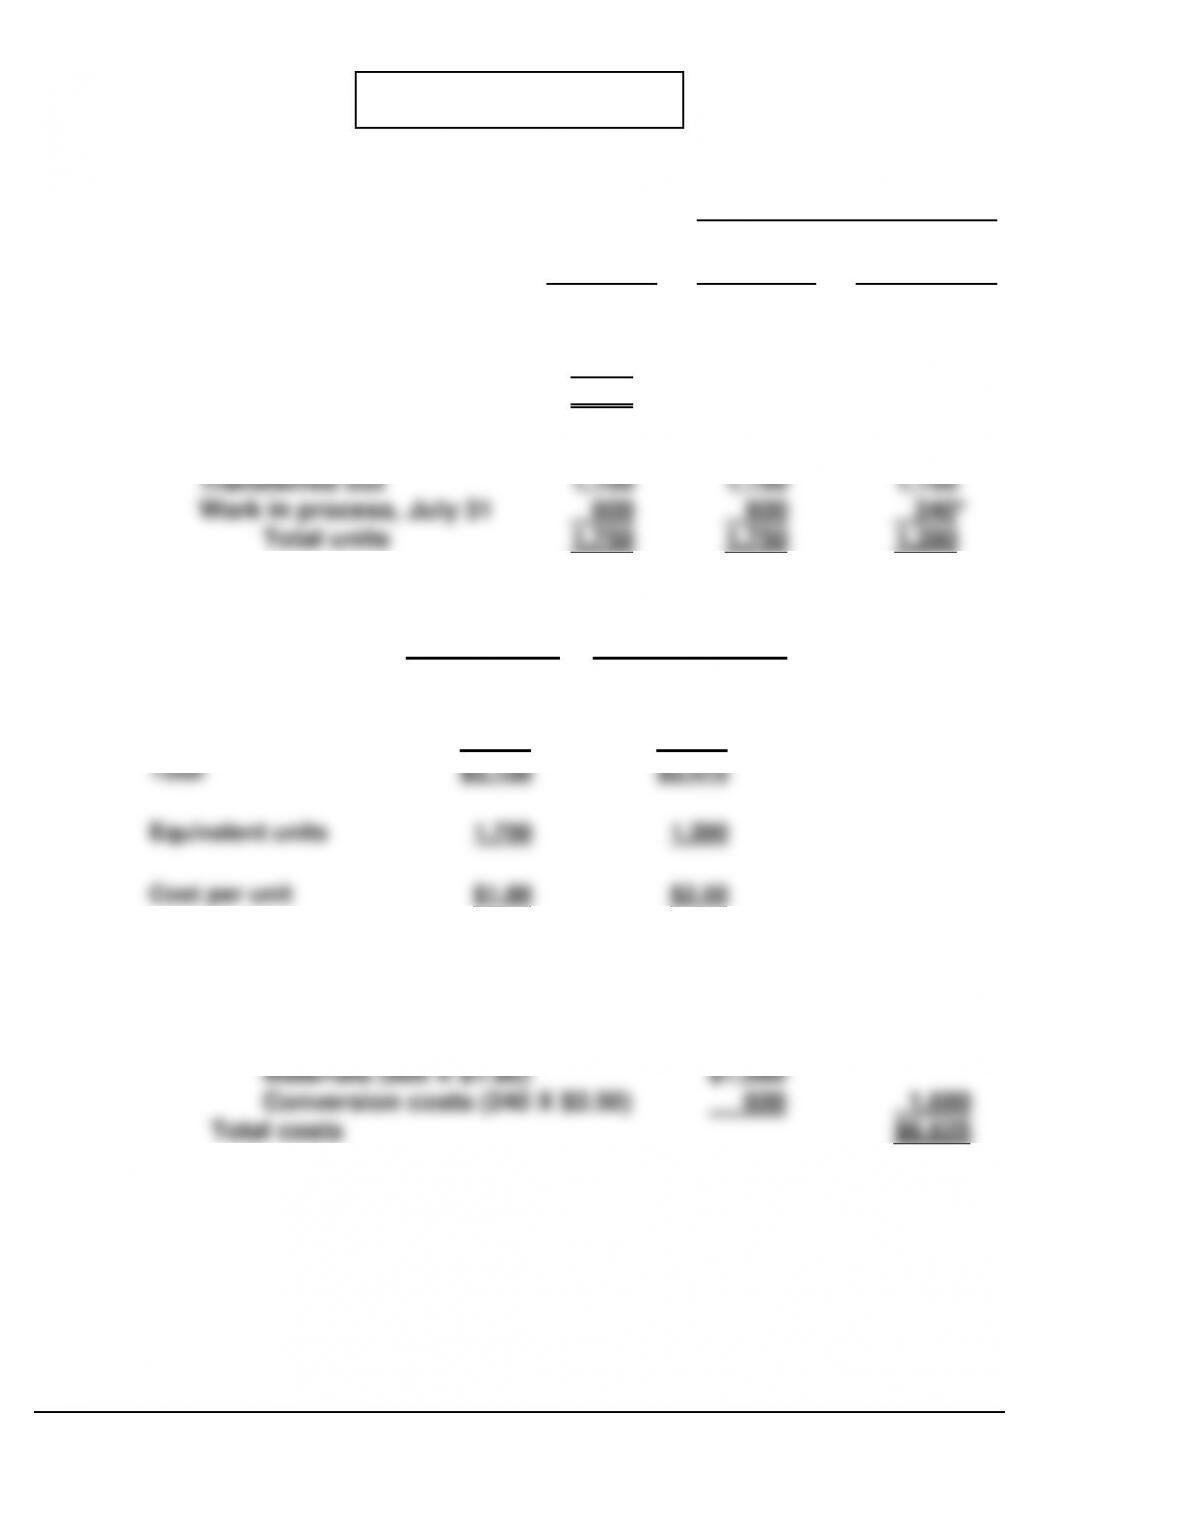
(a)
(1)
Equivalent Units
Physical
Units
Materials
Conversion
Costs
Units to be accounted for
Work in process, July 1
Started into production
Total units
Units accounted for
Transferred out
Work in process, July 31
Total units
500
1,250
1,750
1,150
600
1,750
1,150
600
1,750
1,150
240*
1,390
*600 X 40%
(2)
Beginning work
in process
Added during month
Total
Equivalent units
Cost per unit
Materials cost
$ 750
2,400
$3,150
1,750
$1.80
Conversion costs
$ 600
2,875
$3,475
1,390
$2.50
($1,580 + $1,295)
(3)
Costs accounted for
Transferred out (1,150 X $4.30)
Work in process, July 31
Materials (600 X $1.80)
Conversion costs (240 X $2.50)
Total costs
$1,080
600
$4,945
1,680
$6,625
PROBLEM 3-5A (Continued)
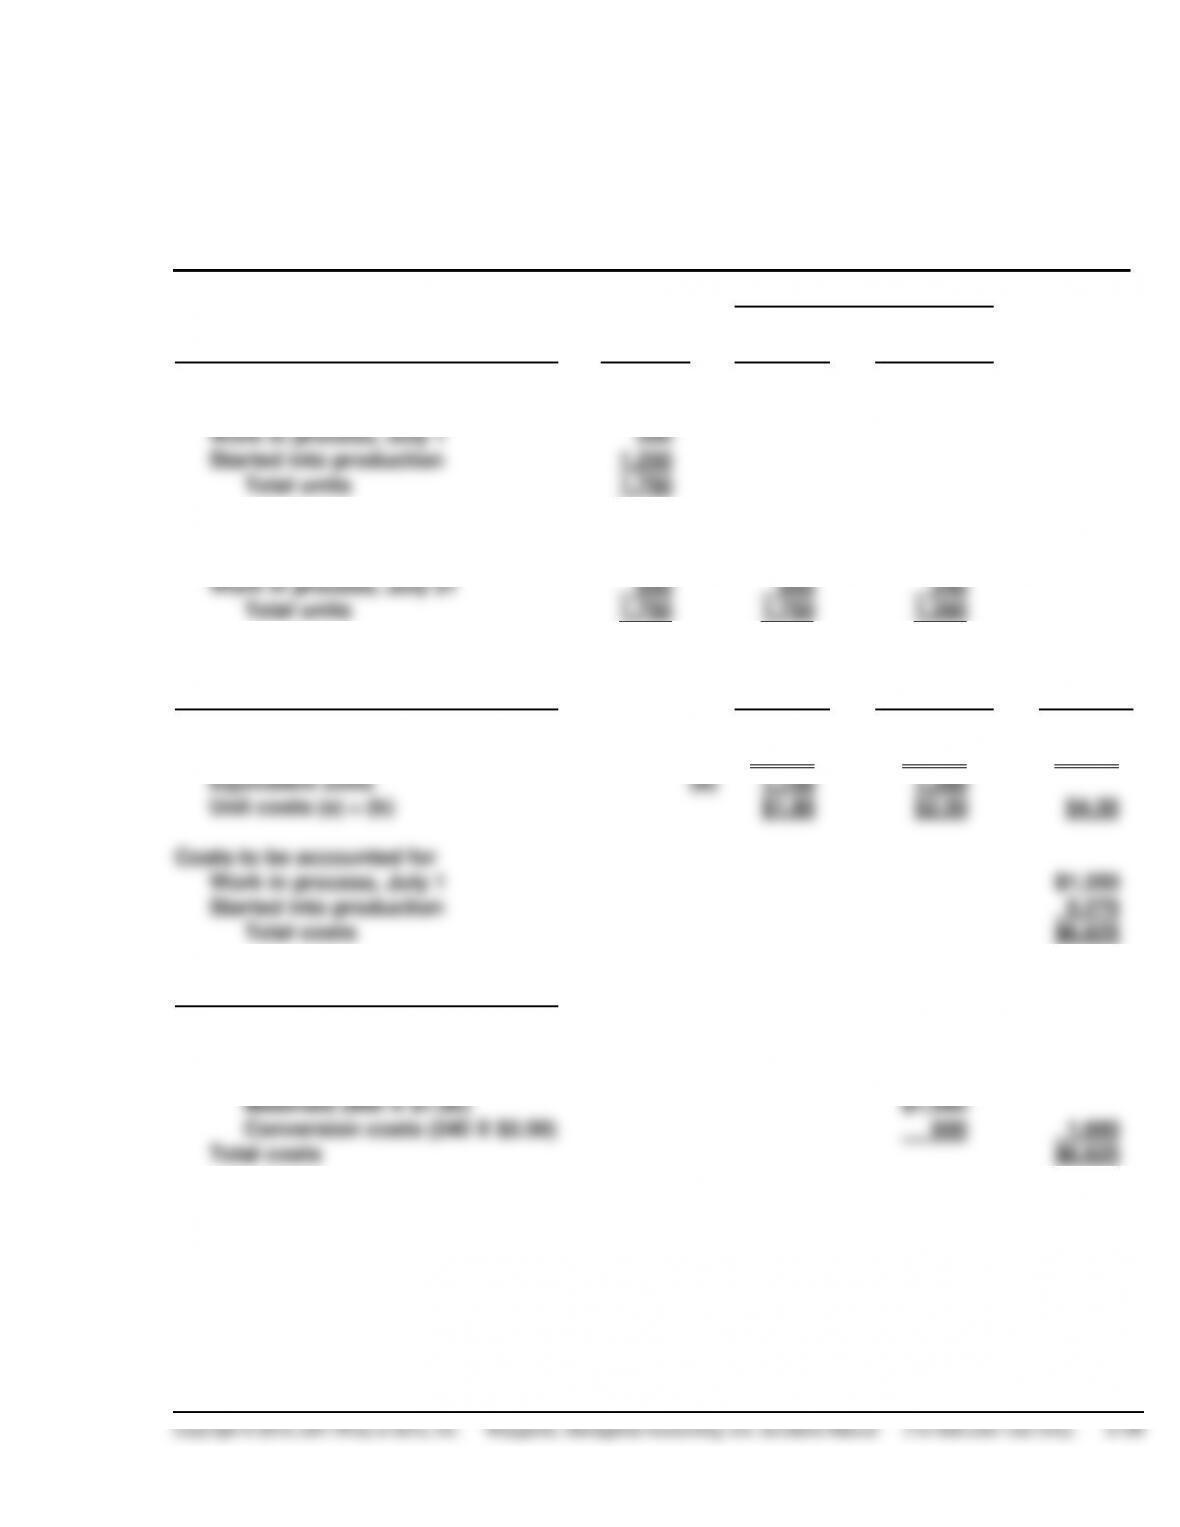
(b) MORSE COMPANY
Basketball Department
Production Cost Report
For the Month Ended July 31, 2014
Equivalent Units
Quantities
Physical
Units
Materials
Conversion
Costs
(Step 1)
(Step 2)
Units to be accounted for
Work in process, July 1
Started into production
Total units
Units accounted for
Transferred out
500
1,250
1,750
1,150
1,150
1,150
Work in process, July 31
600
600
240
Total units
1,750
1,750
1,390
Costs
Materials
Conversion
Costs
Total
Unit costs (Step 3)
Costs in July
Equivalent units
Unit costs (a) ÷ (b)
Costs to be accounted for
Work in process, July 1
Started into production
Total costs
(a)
(b)
$3,150
1,750
$1.80
$3,475
1,390
$2.50
$6,625
$4.30
$1,350
5,275
$6,625
Cost Reconciliation Schedule (Step 4)
Costs accounted for
Transferred out (1,150 X $4.30)
Work in process, July 31
Materials (600 X $1.80)
Conversion costs (240 X $2.50)
Total costs
$1,080
600
$4,945
1,680
$6,625
PROBLEM 3-6A
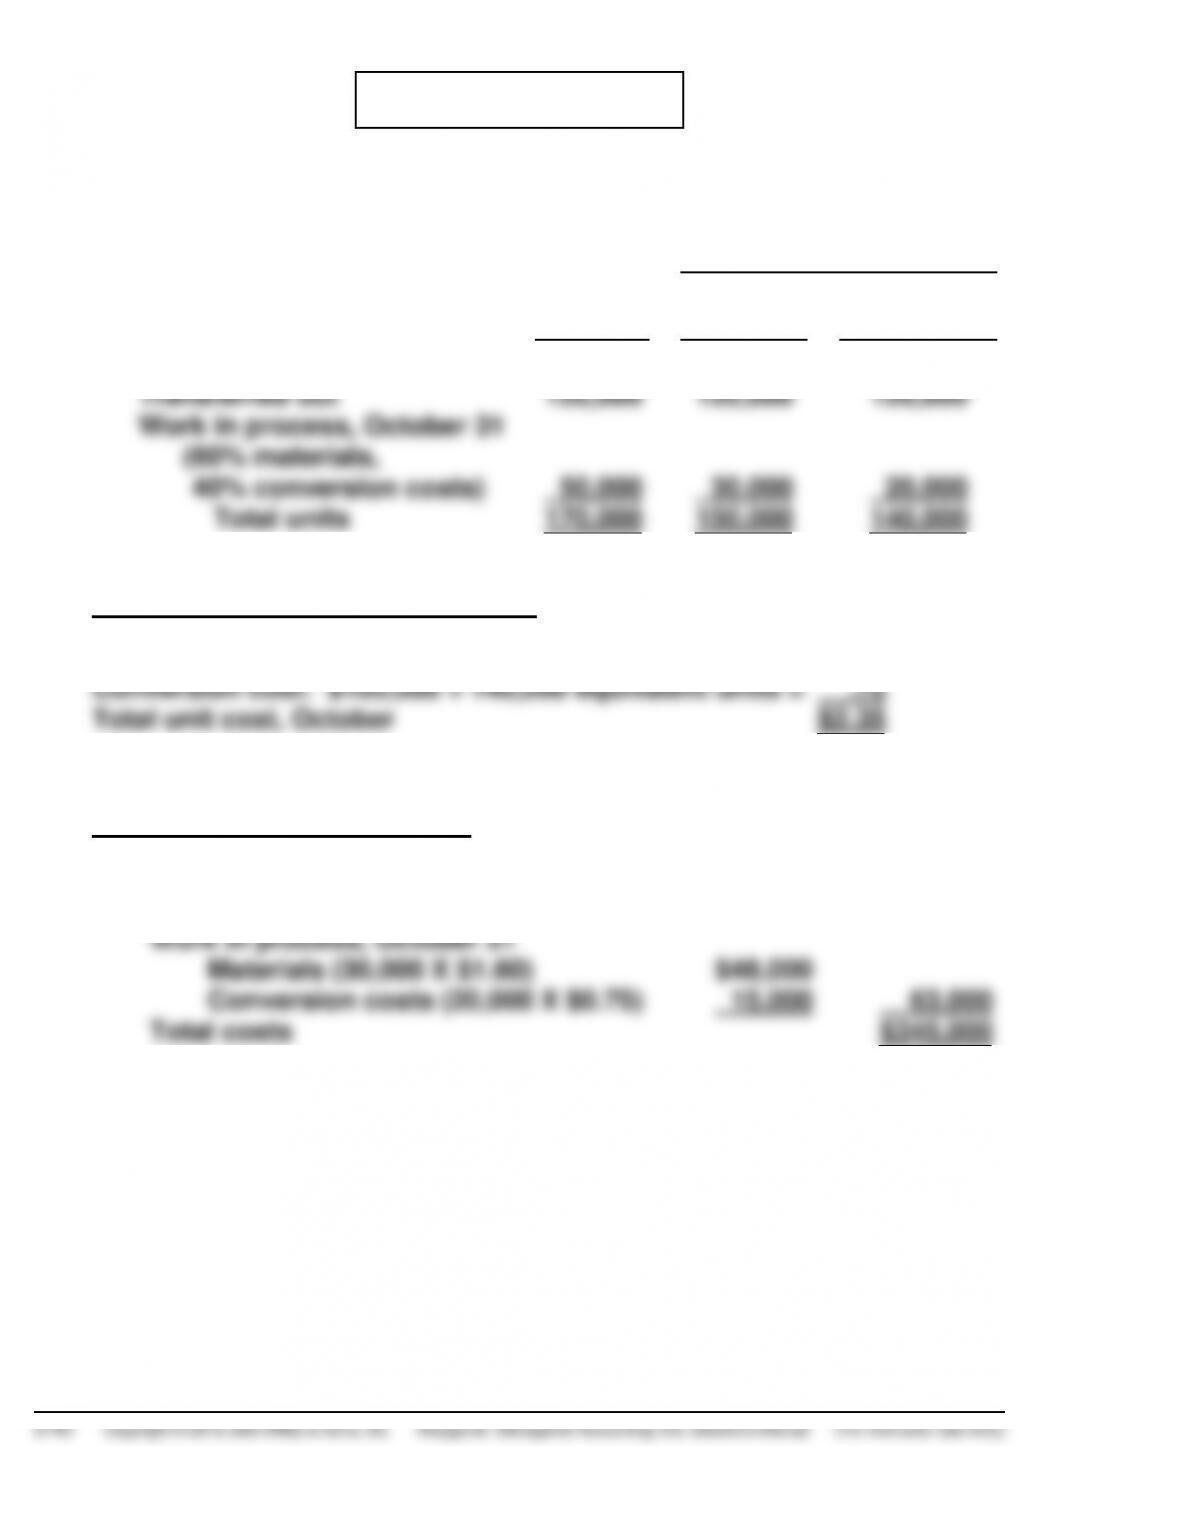
(a) Computation of equivalent units:
Equivalent Units
Physical
Units
Materials
Conversion
Costs
Units accounted for
Transferred out
Work in process, October 31
(60% materials,
(40% conversion costs)
Total units
120,000
50,000
170,000
120,000
30,000
150,000
120,000
20,000
140,000
Computation of October unit costs
Materials: $240,000 ÷ 150,000 equivalent units = $1.60
(b) Cost Reconciliation Schedule
Costs accounted for
Transferred out (120,000 X $2.35) $282,000