
PROBLEM 10-2B (Continued)
(b) GONZALEZ COMPANY
Assembly Department
Manufacturing Overhead Budget Report (Flexible)
For the Month Ended July 31, 2014
Difference
Direct labor hours (DLH)
Variable costs
Indirect labor ($1.00)
Indirect materials ($0.50)
Utilities ($0.30)
Maintenance ($0.20)
Total variable
costs ($2.00)
Fixed costs
Supervision
Depreciation
Insurance and taxes
Total fixed costs
Total costs
Budget at
27,500 DLH
$27,500
13,750
8,250
5,500
55,000
12,000
8,000
5,000
25,000
$80,000
Actual Costs
27,500 DLH
$26,000
11,350
8,050
5,400
50,800
12,000
8,000
5,000
25,000
$75,800
Favorable F
Unfavorable U
$1,500 F
2,400 F
200 F
100 F
4,200 F
0 F
0 F
0 F
0 F
$4,200 F
(c) Based on the above budget report, control over costs was effective.
PROBLEM 10-2B (Continued)
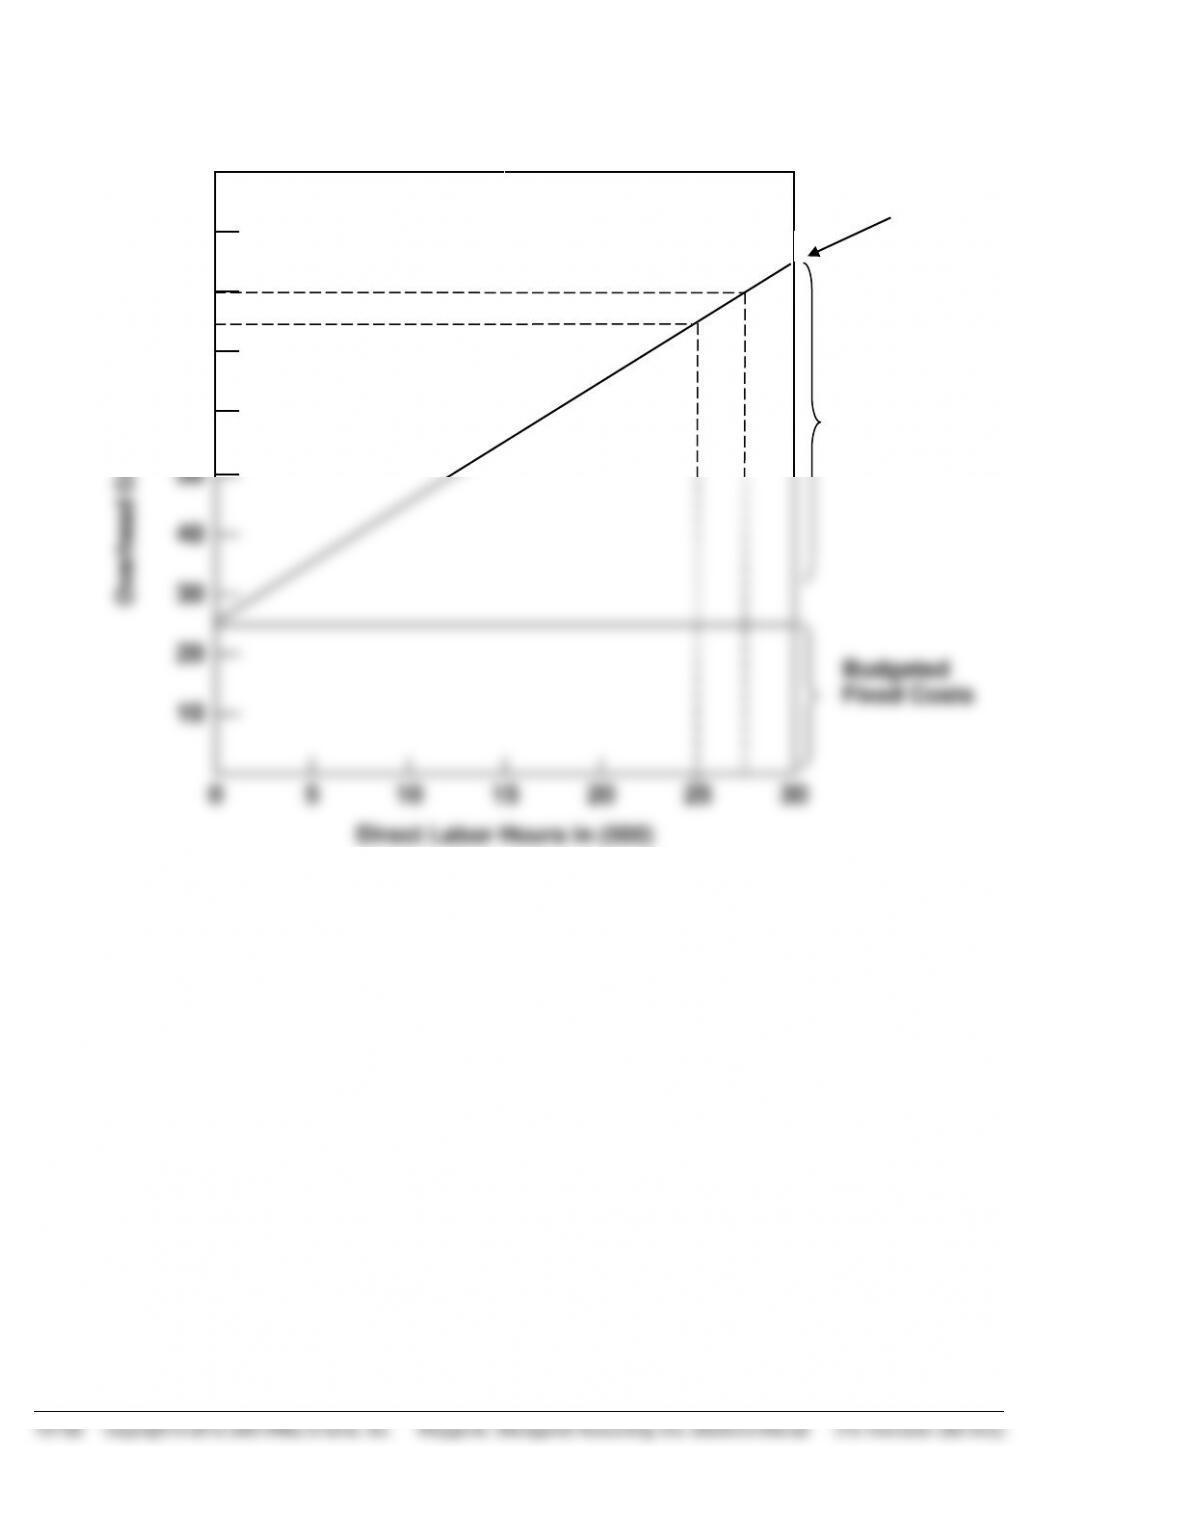
(e)
$100
Total
Budgeted
Cost Line
Overhead Costs in (000)
90
80
70
Budgeted
Variable
Costs
60
50
40
30
20
Budgeted
Fixed Costs
10
0
5
10
15
20
25
30
Direct Labor Hours in (000)

PROBLEM 10-3B
(a) The formula is fixed costs $21,000 plus total variable costs of $2.60 per
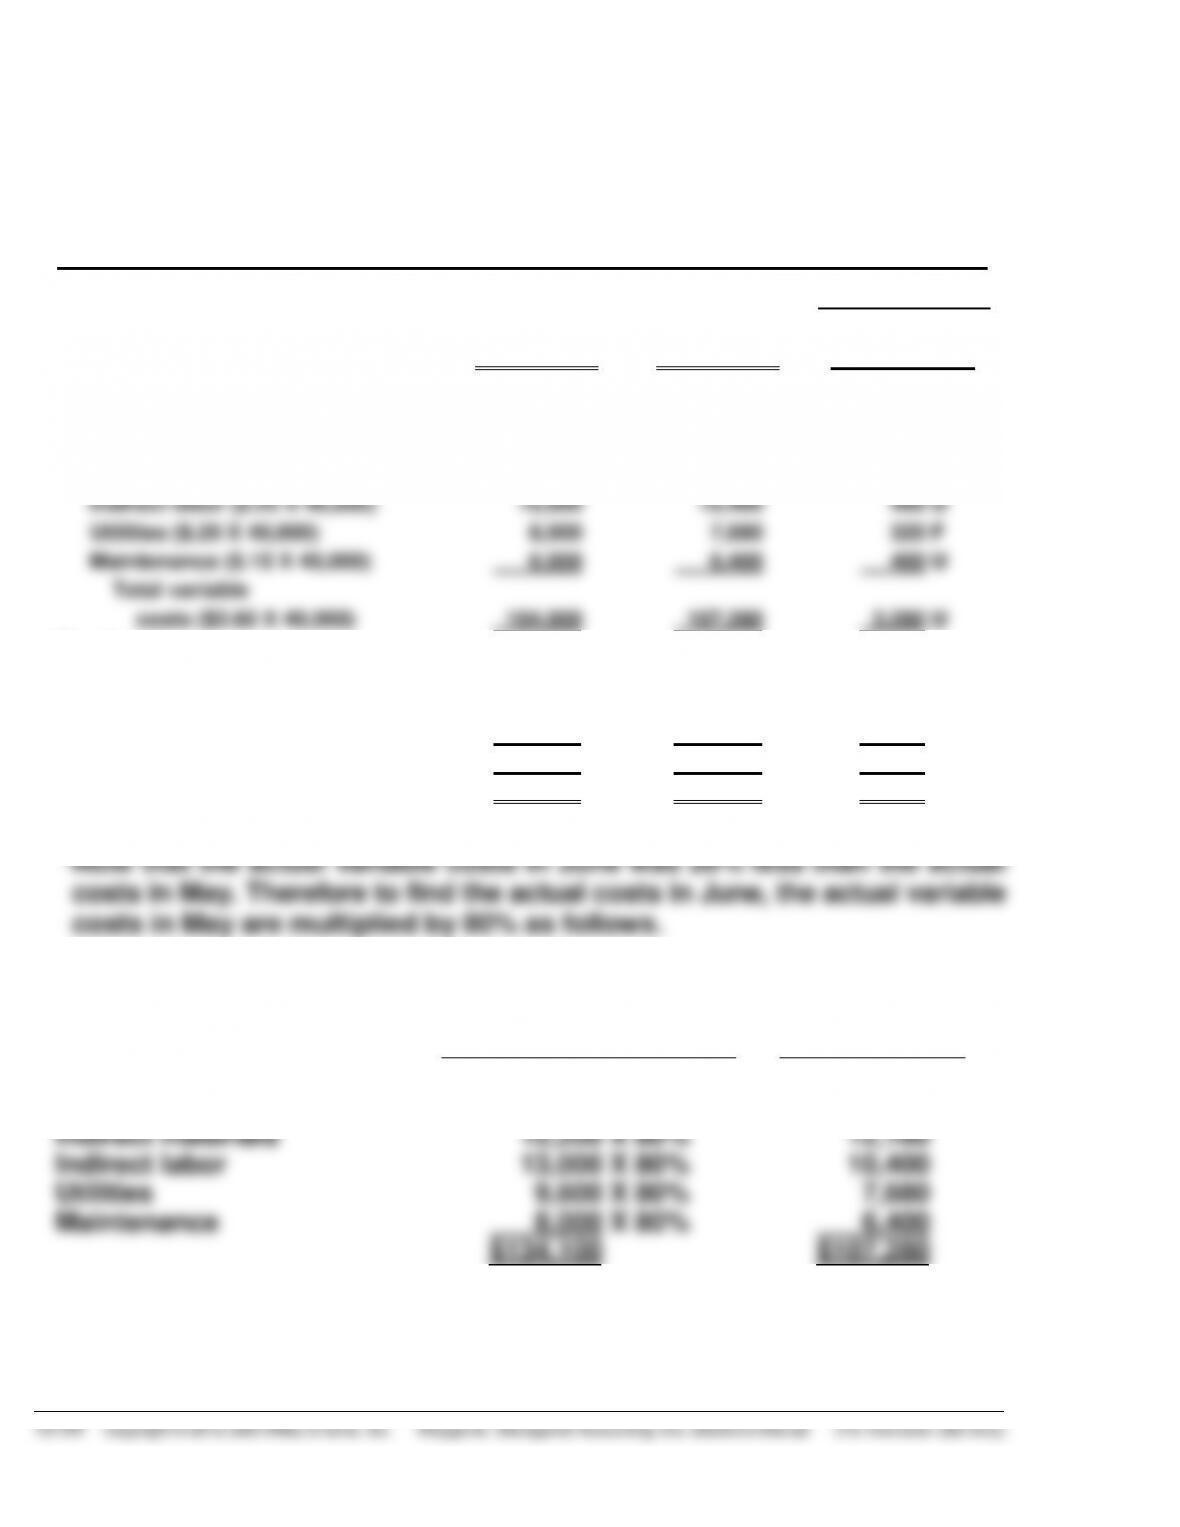
(b) HARDESTY COMPANY
Packaging Department
Budget Report (Flexible)
For the Month Ended May 31, 2014
Difference
Units
Variable costs*
Direct materials ($.80 X 55,000)
Direct labor ($.90 X 55,000)
Indirect materials ($.30 X 55,000)
Indirect labor ($.25 X 55,000)
Utilities ($.20 X 55,000)
Maintenance ($.15 X 55,000)
Total variable
costs ($2.60 X 55,000)
Fixed costs
Rent
Supervision
Depreciation
Total fixed costs
Total costs
Budget at
55,000 Units
$ 44,000
49,500
16,500
13,750
11,000
8,250
143,000
10,000
7,000
4,000
21,000
$164,000
Actual Costs
55,000 Units
$ 41,000
47,300
15,200
13,000
9,600
8,000
134,100
10,000
7,000
4,000
21,000
$155,100
Favorable F
Unfavorable U
$3,000 F
2,200 F
1,300 F
750 F
1,400 F
250 F
8,900 F
0 F
0 F
0 F
0 F
$8,900 F
PROBLEM 10-3B (Continued)
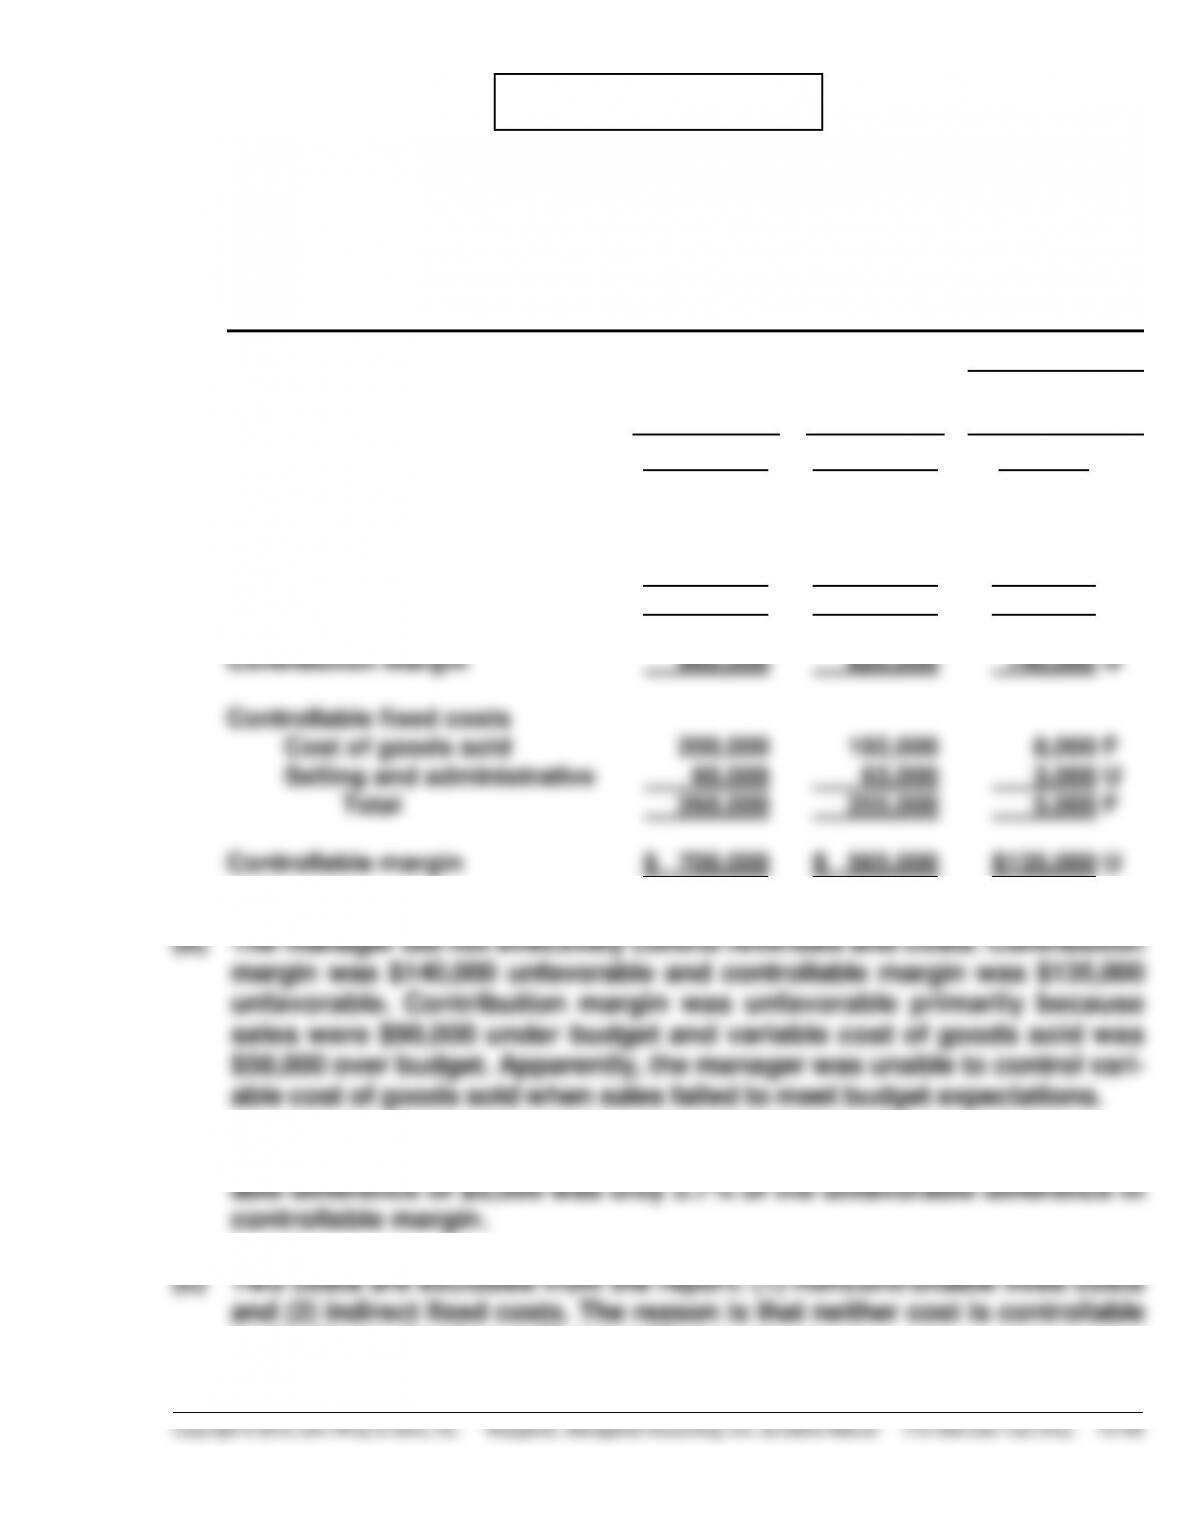
(c) HARDESTY COMPANY
Packaging Department
Budget Report (Flexible)
For the Month Ended June 30, 2014
Difference
Units
Variable costs
Direct materials ($.80 X 40,000)
Direct labor ($.90 X 40,000)
Indirect materials ($.30 X 40,000)
Indirect labor ($.25 X 40,000)
Utilities ($.20 X 40,000)
Maintenance ($.15 X 40,000)
Total variable
costs ($2.60 X 40,000)
Fixed costs
Rent
Supervision
Depreciation
Total fixed costs
Total costs
Budget at
40,000 Units
$ 32,000
36,000
12,000
10,000
8,000
6,000
104,000
10,000
7,000
4,000
21,000
$125,000
Actual Costs
40,000 Units
$ 32,800*
37,840
12,160
10,400
7,680
6,400
107,280
10,000
7,000
4,000
21,000
$128,280
Favorable F
Unfavorable U
$ 800 U
1,840 U
160 U
400 U
320 F
400 U
3,280 U
0 U
0 U
0 U
0 U
$3,280 U
May
June
PROBLEM 10-4B
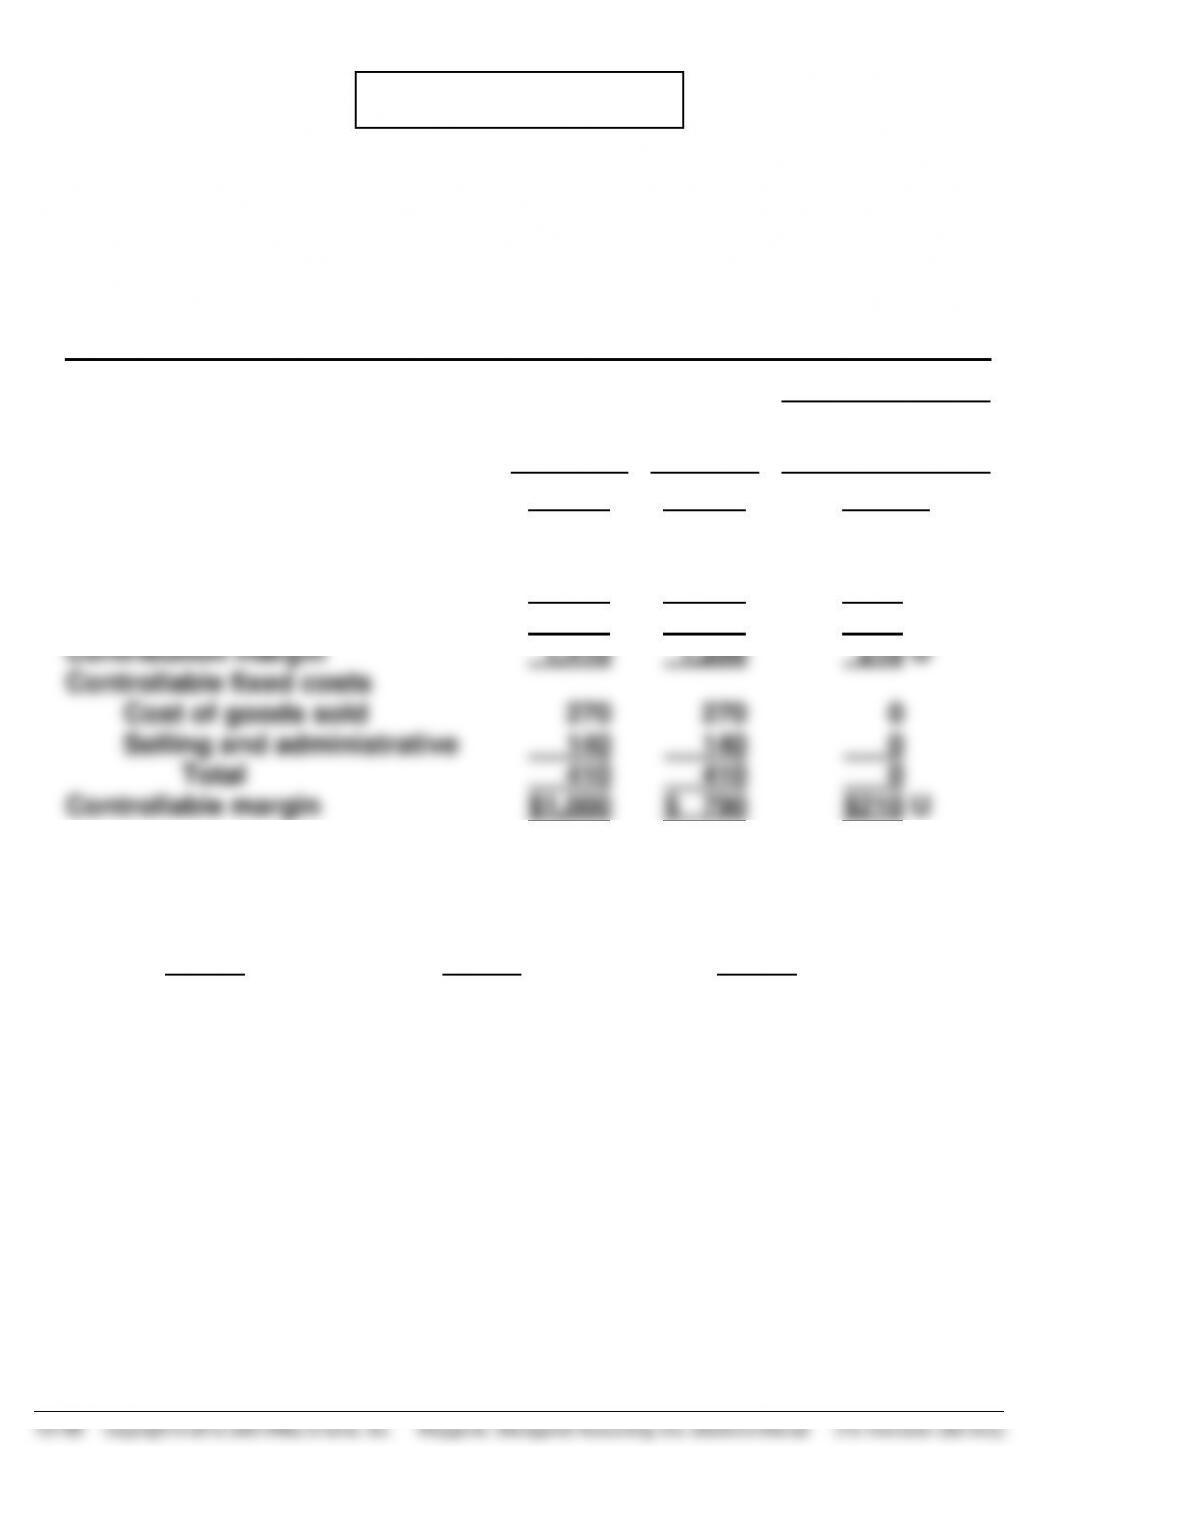
(a) GUZMAN INC.
Home Appliance Division
Responsibility Report
For the Year Ended December 31, 2014
Difference
Budget
Actual
Favorable F
Unfavorable U
Sales
Variable costs
Cost of goods sold
Selling and administrative
Total
Contribution margin
Controllable fixed costs
Cost of goods sold
Selling and administrative
Total
Controllable margin
$2,400,000
1,200,000
240,000
1,440,000
960,000
200,000
60,000
260,000
$ 700,000
$2,310,000
1,258,000
232,000
1,490,000
820,000
192,000
63,000
255,000
$ 565,000
$90,000 U
58,000 U
8,000 F
50,000 U
140,000 U
8,000 F
3,000 U
5,000 F
$135,000 U
PROBLEM 10-5B
(a) STRAUSS COMPANY
Lawnmower Division
Responsibility Performance Report
For the Year Ended December 31, 2014
(in thousands of dollars)
Difference
Budget
Actual
Favorable F
Unfavorable U
Sales
Variable costs
Cost of goods sold
Selling and administrative
Total
Contribution margin
Controllable fixed costs
Cost of goods sold
Selling and administrative
Total
Controllable margin
ROI
$3,050
1,300
340
1,640
1,410
270
140
410
$1,000
20%
(1)
$2,900
1,400
300
1,700
1,200
270
140
410
$ 790
15.8%
(2)
$150 U
100 U
40 F
60 U
210 U
0 U
0 U
0 U
$210 U
4.2% U
(3)
(1)
$1,000
$5,000
(2)
$790
$5,000
(3)
$210
$5,000
PROBLEM 10-5B (Continued)
(b) The performance of the manager of the Lawnmower Division was below
budget expectations for the year. The item that top management would
likely investigate first is the reason why sales were $150,000 below
budget. Next, inquiry would be made as to the reason variable cost of
(c) 1. [$790,000 + ($1,400,000 X 20%)] ÷ $5,000,000 = 21.4%.
PROBLEM 10-6B
(a) No. 1
To Cutting Department Manager—Phoenix Division Month: January
Controllable Costs:
Budget
Actual
Fav/Unfav
Indirect labor
Indirect materials
Maintenance
Utilities
Supervision
Total
$ 90,000
61,000
25,000
20,000
28,000
$224,000
$ 95,000
62,700
27,400
25,200
31,000
$241,300
$ 5,000 U
1,700 U
2,400 U
5,200 U
3,000 U
$17,300 U
No. 2
To Division Production Manager—Phoenix Month: January
Controllable Costs:
Budget
Actual
Fav/Unfav
Phoenix Division
Departments:
Cutting
Shaping
Finishing
Total
$ 70,000
224,000
177,000
245,000
$716,000
$ 73,100
241,300
190,000
250,000
$754,400
$ 3,100 U
17,300 U
13,000 U
5,000 U
$38,400 U
No. 3
To Vice-President—Production Month: January
Controllable Costs:
Budget
Actual
Fav/Unfav
V-P Production
Divisions:
Phoenix
San Francisco
Tulsa
Total
$ 70,000
716,000
715,000
750,000
$2,251,000
$ 72,000
754,400
724,000
760,000
$2,310,400
$ 2,000 U
38,400 U
9,000 U
10,000 U
$59,400 U
PROBLEM 10-6B (Continued)
No. 4
To President Month: January
Controllable Costs:
Budget
Actual
Fav/Unfav
President
Vice-Presidents:
Production
Marketing
Finance
Total
$ 91,300
2,251,000
160,000
120,000
$2,622,300
$ 94,200
2,310,400
167,200
125,000
$2,696,800
$ 2,900 U
59,400 U
7,200 U
5,000 U
$74,500 U
2. At the division manager level, the rankings were: (1) San Francisco,
(2) Tulsa, and (3) Phoenix.
3. Rankings in terms of dollars may be somewhat misleading in this
(3) marketing, 4.5% U.
*PROBLEM 10-7B
(a) 1. ROI = Controllable Margin ÷ Average Operating Assets
ROI = $1,500,000 ÷ $7,500,000
ROI = 20%
2. Residual Income = Controllable Margin – (Minimum Rate of
Return X Average Operating Assets)
minimum rate of return.
If management of the division had used ROI as the performance
measure, the decision would be to reject the project because the ROI