Chapter 9 281
42. a.
Ducks
Ducklings
Sales
$ 24.00
$12.00
Variable costs
(12.00)
(8.00)
Contribution margin
$ 12.00
$ 4.00
Mix
× 1
× 5
Total contribution margin
$ 12.00
$20.00
Ducks: 750 × 1 = 750 per month
Ducklings: 750 × 5 = 3,750 per month
c. Target profit is $96,000 × 12 = $1,152,000
($288,000 + $1,152,000) ÷ $32 = 45,000 bags per year or 3,750 bags a month.
d.
Ducks
Ducklings
Sales
$ 24.00
$12.00
Variable costs
(12.00)
(8.00)
Contribution margin
$ 12.00
$ 4.00
Mix
× 1
× 9
Total contribution margin
$ 12.00
$36.00
Target profit after tax is $31,680.
Pre-tax profit is $31,680 ÷ (1 0.40) = $52,800 monthly or $633,600 per year.
Units
Revenue
Ducks (19,200 × $24)
19,200
$ 460,800
Ducklings (19,200 × 9 × $12)
172,800
2,073,600
Total
$2,534,400
e. [$288,000 + ($8,500 × 12)] ÷ [$12 + ($8 × 5)]
($288,000 + $102,000) ÷ $52 = 7,500
43. a. and b.
Total variable costs:
Reindeer
Snowmen
Flamingos
Variable product cost
$12.00
$15.00
$25.00
Variable selling expenses
6.00
4.50
8.00
Variable administrative exp.
3.00
5.50
6.00
Total
$21.00
$25.00
$39.00
282 Chapter 9
accessible website, in whole or in part.
Reindeer
Snowmen
Flamingos
Sales
$ 40.00
$ 35.00
$ 60.00
Variable costs
(21.00)
(25.00)
(39.00)
Contribution margin
$ 19.00
$ 10.00
$ 21.00
Mix
× 1
× 2
× 4
Total contribution margin
$ 19.00
$ 20.00
$ 84.00
Units Sold
Revenues
Reindeer (5,286 × $40.00)
5,286
$ 211,440
Snowmen (5,286 × 2 × $35.00)
10,572
370,020
Flamingos (5,286 × 4 × $60.00)
21,144
1,268,640
Total
$1,850,100
c. Units = ($650,178 + $250,428) ÷ $123 = 7,322 bags
Units Sold
Revenues
Reindeer (7,322 × $40.00)
7,322
$ 292,880
Snowmen (7,322 × 2 × $35.00)
14,644
512,540
Flamingos (7,322 × 4 × $60.00)
29,288
1,757,280
Total
$2,562,700
d. Pre-tax profit = $155,718 ÷ (1 0.40) = $259,530
Break-even in units = ($650,178 + $259,530) ÷ $123 = 7,396 bags
Units Sold
Revenues
Reindeer (7,396 × $40.00)
7,396
$ 295,840
Snowmen (7,396 × 2 × $35.00)
14,792
517,720
Flamingos (7,396 × 4 × $60.00)
29,584
1,775,040
Total
$2,588,600
e. MS bags = 7,396 bags 5,286 bags = 2,110 bags
44. a. and b.
Total variable costs:
Oak
Hickory
Cherry
Direct material
$10.40
$6.50
$17.60
Direct labor
3.60
0.80
12.80
Variable overhead
2.00
0.30
3.50
Variable selling
1.00
0.50
4.00
Variable administrative
0.40
0.20
0.60
Total
$17.40
$8.30
$38.50
Chapter 9 283
Determination of sales ratio:
Sales in Yards
% of Sales
Per “Bag”*
Oak
9,000
10.34
3
Hickory
72,000
82.76
24
Cherry
6,000
6.90
2
Total
87,000
100.00
29
*The content per bag is determined by dividing the sales in yards by 3,000.
Oak
Hickory
Cherry
Sales
$ 32.80
$16.00
$ 50.00
Variable costs
(17.40)
(8.30)
(38.50)
Contribution margin
$ 15.40
$ 7.70
$ 11.50
Contribution Margin
Sales
Oak
$15.40 × 3 = $ 46.20
$32.80 × 3 = $ 98.40
Hickory
$7.70 × 24 = 184.80
$16.00 × 24 = 384.00
Cherry
$11.50 × 2 = 23.00
$50.00 × 2 = 100.00
Total
$254.00
$582.40
Break-even point in units = $1,200,000 ÷ $254 = 4,724.409 or 4,725 bags
Oak: 4,725 × 3 = 14,175 square yards
c. ($1,200,000 + $800,000) ÷ $254 = 7,875 bags (rounded)
Yards
Revenue
Oak:
7,875 × 3 = 23,625 × $32.80 =
$ 774,900
Hickory:
7,875 × 24 = 189,000 × 16.00 =
3,024,000
Cherry:
7,875 × 2 = 15,750 × 50.00 =
787,500
Total
$4,586,400
d.
Revenue per bag:
Oak ($32.80 × 3)
$ 98.40
Hickory ($16.00 × 24)
384.00
Cherry ($50.00 × 2)
100.00
Total
$ 582.40
Contribution margin ratio = $254 ÷ $582.40 = 43.6%
e. Break-even point in dollars = $1,200,000 ÷ 0.436 = $2,752,294
284 Chapter 9
45. a.
Fixed costs:
Depreciation
$160,000
Labor
320,000
Utilities
158,000
Miscellaneous
100,000
Total
$738,000
Variable costs:
Coaches
Players
Labor
$ 5.00
$ 5.00
Utilities
1.00
1.00
Miscellaneous
6.00
6.00
Food
40.00
15.00
Total
$52.00
$27.00
Total fixed costs
$ 738,000
Total variable costs
Coaches: (10 × $52.00 × 360 × 80%)
$149,760
Players: (50 × $27.00 × 360 × 80%)
388,800
538,560
Desired profit
240,000
Total required revenue
$1,516,560
Guest days:
Coaches: 10 × 360 × 80% =
2,880
Players: 50 × 360 × 80% =
14,400
Total
17,280
Required charge per guest day: $1,516,560 ÷ 17,280 = $87.76 (rounded)
b. (1)
Coaches
Players
Sales price per day
$240.00
$200.00
Variable costs
52.00
27.00
Contribution margin
$188.00
$173.00
Break-even in bags = $738,000 ÷ $880 per bag = 839 (rounded) bags,
which represents 839 coach-days and 3,356 player-days.
(2) ($738,000 + $400,000) ÷ $880 per bag = 1,293 (rounded) bags, which rep-
(3) {$738,000 + [$400,000 ÷ (1 0.35)]} ÷ $880 per bag = 1,538 (rounded)
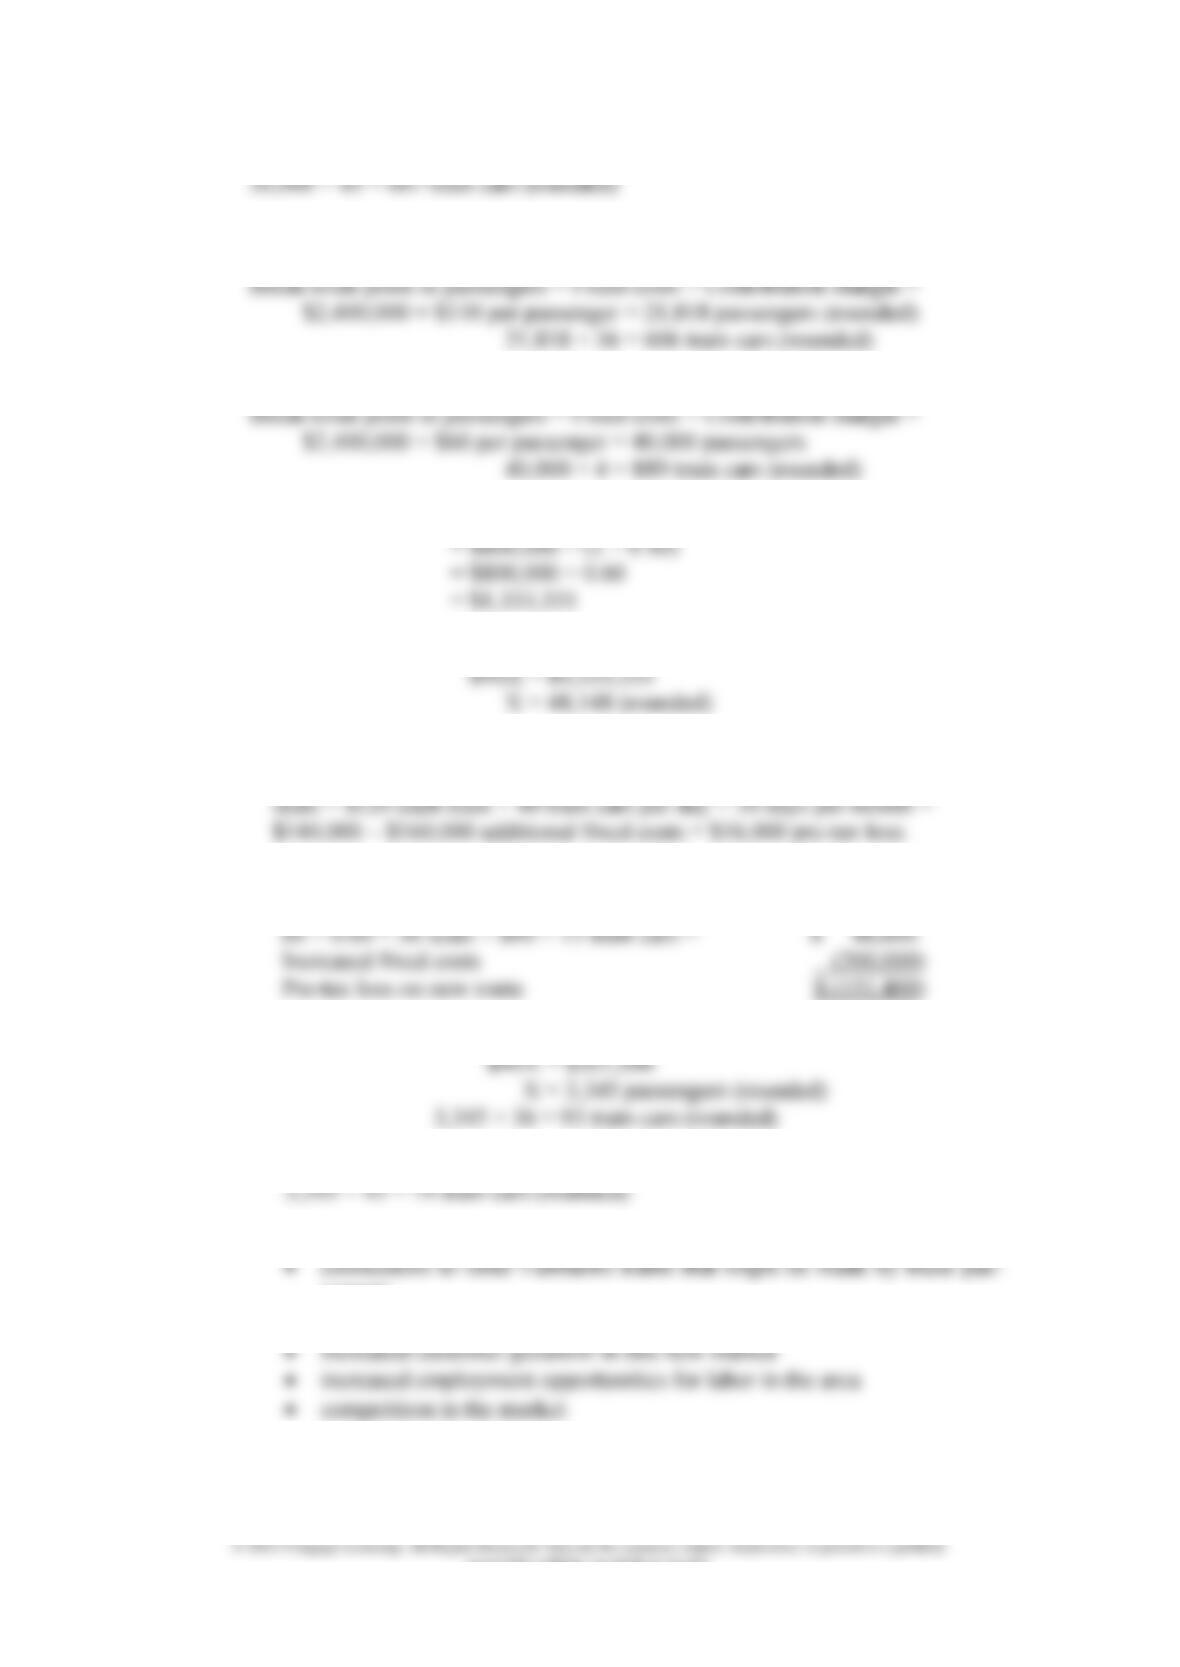
46. a. Contribution margin = $140 $60 = $80 per passenger
Break-even point in passengers = Fixed costs ÷ Contribution margin =
Chapter 9 285
accessible website, in whole or in part.
b. 60 × 0.75 = 45 seats per train car
c. CM = $170 $60 = $110 per passenger
60 × 0.60 = 36 filled seats
d. Contribution margin = $140 $80 = $60 per passenger
e. After-tax income
= $800,000 ÷ (1 Tax rate)
= $800,000 ÷ (1 0.40)
= $800,000 ÷ 0.60
= $1,333,333
$160X $3,000,000 $70X = $1,333,333
f. Number of discounted seats = 60 × 0.05 = 3 seats
Contribution margin for discounted fares = $100 $60 = $40 × 3 discounted
g. (1) No.
Contribution margin = $150 $60 = $90 per passenger
60 × 0.60 = 36 seats × $90 × 15 train cars =
$ 48,600
Increased fixed costs
(200,000)
Pre-tax loss on new route
$ (151,400)
(2) $150X $60X $200,000 = $101,000
(3) 60 × 0.75 = 45 seats filled
(4) Fairbanks should consider such things as:
sengers
long-range potential for increased load factors
286 Chapter 9
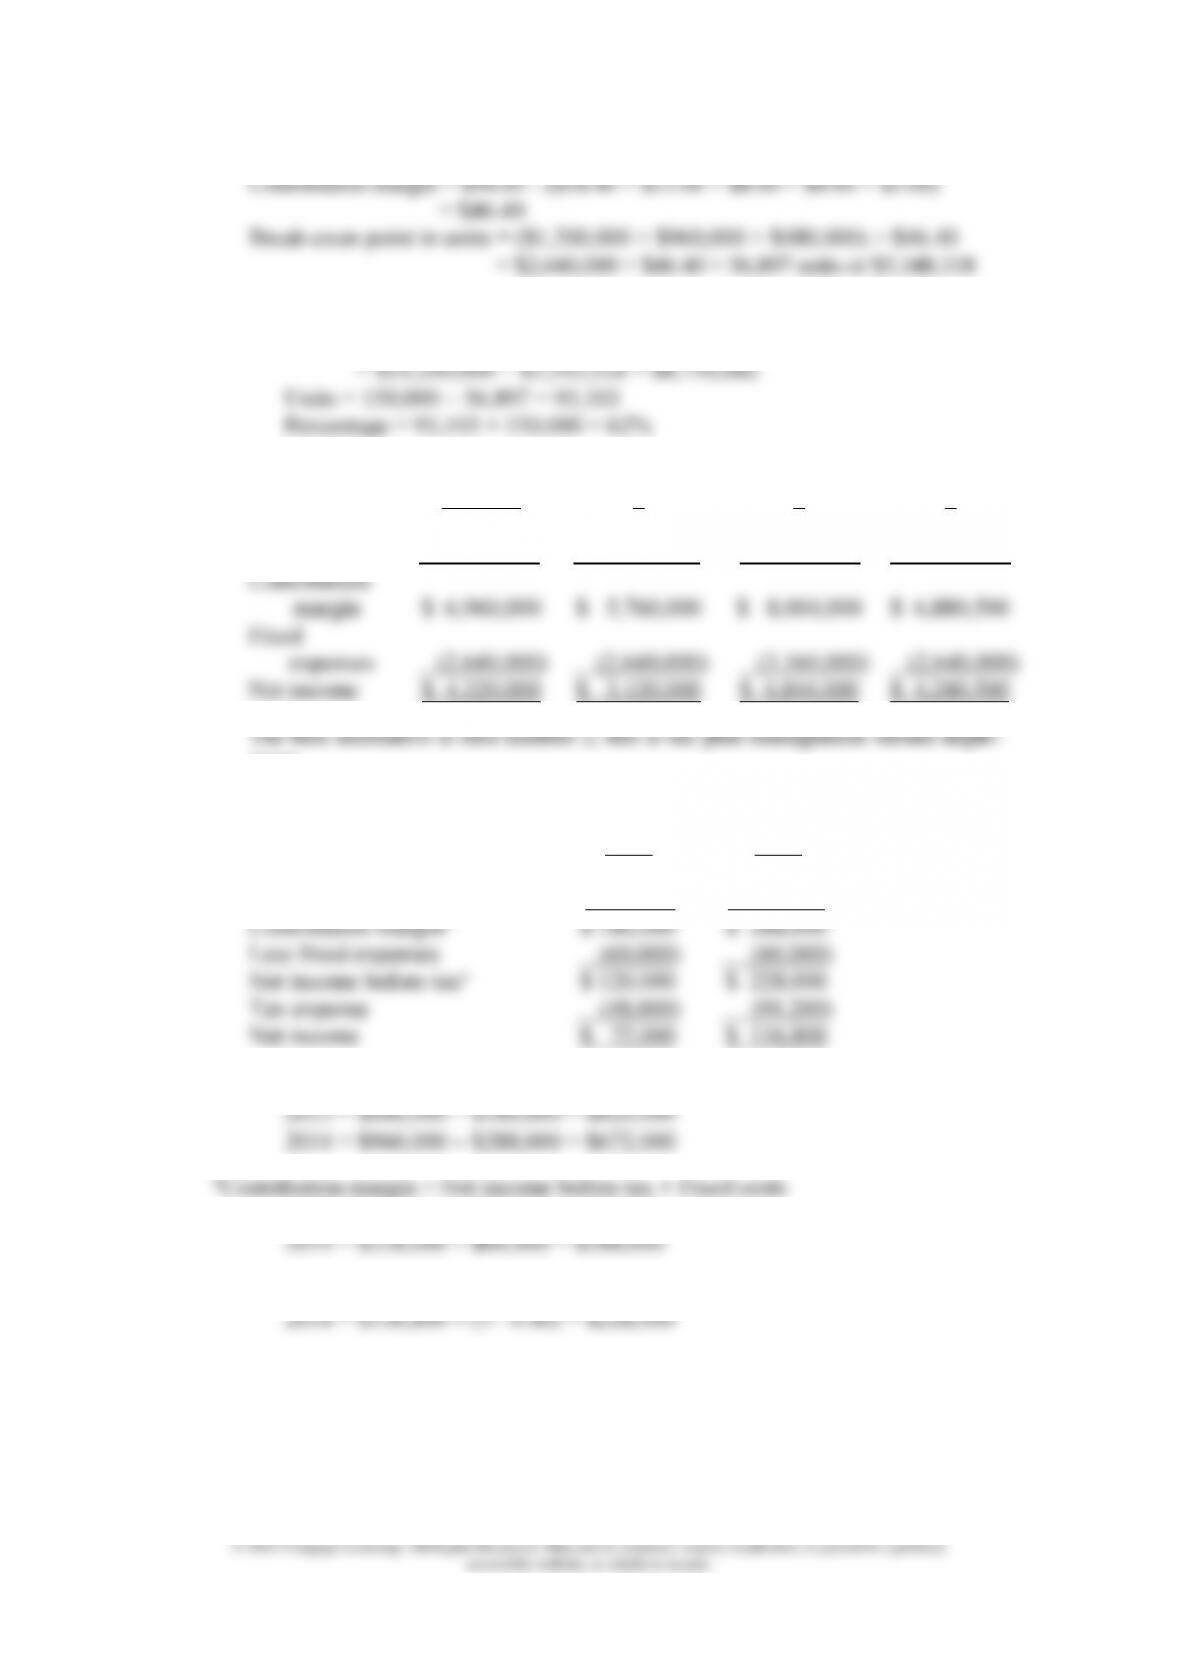
47. a. Break-even point in units = Fixed costs ÷ Contribution margin
b. Margin of safety
Dollars = Total sales – Break-even sales = (150,000 × $94) $5,343,318
c.
Original
1
2
3
Sales
$14,100,000
$ 16,920,000
$ 16,215,000
$14,734,500
Variable cost
(7,140,000)
(11,160,000)
(8,211,000)
(7,854,000)
Contribution
margin
$ 6,960,000
$ 5,760,000
$ 8,004,000
$ 6,880,500
Fixed
expenses
(2,640,000)
(2,640,000)
(3,160,000)
(2,640,000)
Net income
$ 4,320,000
$ 3,120,000
$ 4,844,000
$ 4,240,500
ment.
48. a.
Olson
Income Statements
2013
2014
Sales
$ 600,000
$ 960,000
Less variable expensea
(420,000)
(672,000)
Contribution marginb
$ 180,000
$ 288,000
Less fixed expenses
(60,000)
(60,000)
Net income before taxc
$ 120,000
$ 228,000
Tax expense
(48,000)
(91,200)
Net income
$ 72,000
$ 136,800
aVariable expense = Sales Contribution margin
2013 = $120,000 + $60,000 = $180,000
cNet income before tax 2013 = $ 72,000 ÷ (1 0.40) = $120,000