261
CHAPTER 9
BREAK-EVEN POINT AND
COST-VOLUME-PROFIT ANALYSIS
QUESTIONS
1. The variable costing income statement classifies costs by the way they react rela-
tive to changes in volume. Variable costs are deducted from revenues to determine
cations needed to compute breakeven. The absorption costing income statement
uses functional classifications—manufacturing and nonmanufacturing costs—to
2. The break-even point is the starting point for CVP analysis, because before a
company can earn profits, it must first cover all of its variable and fixed costs; the
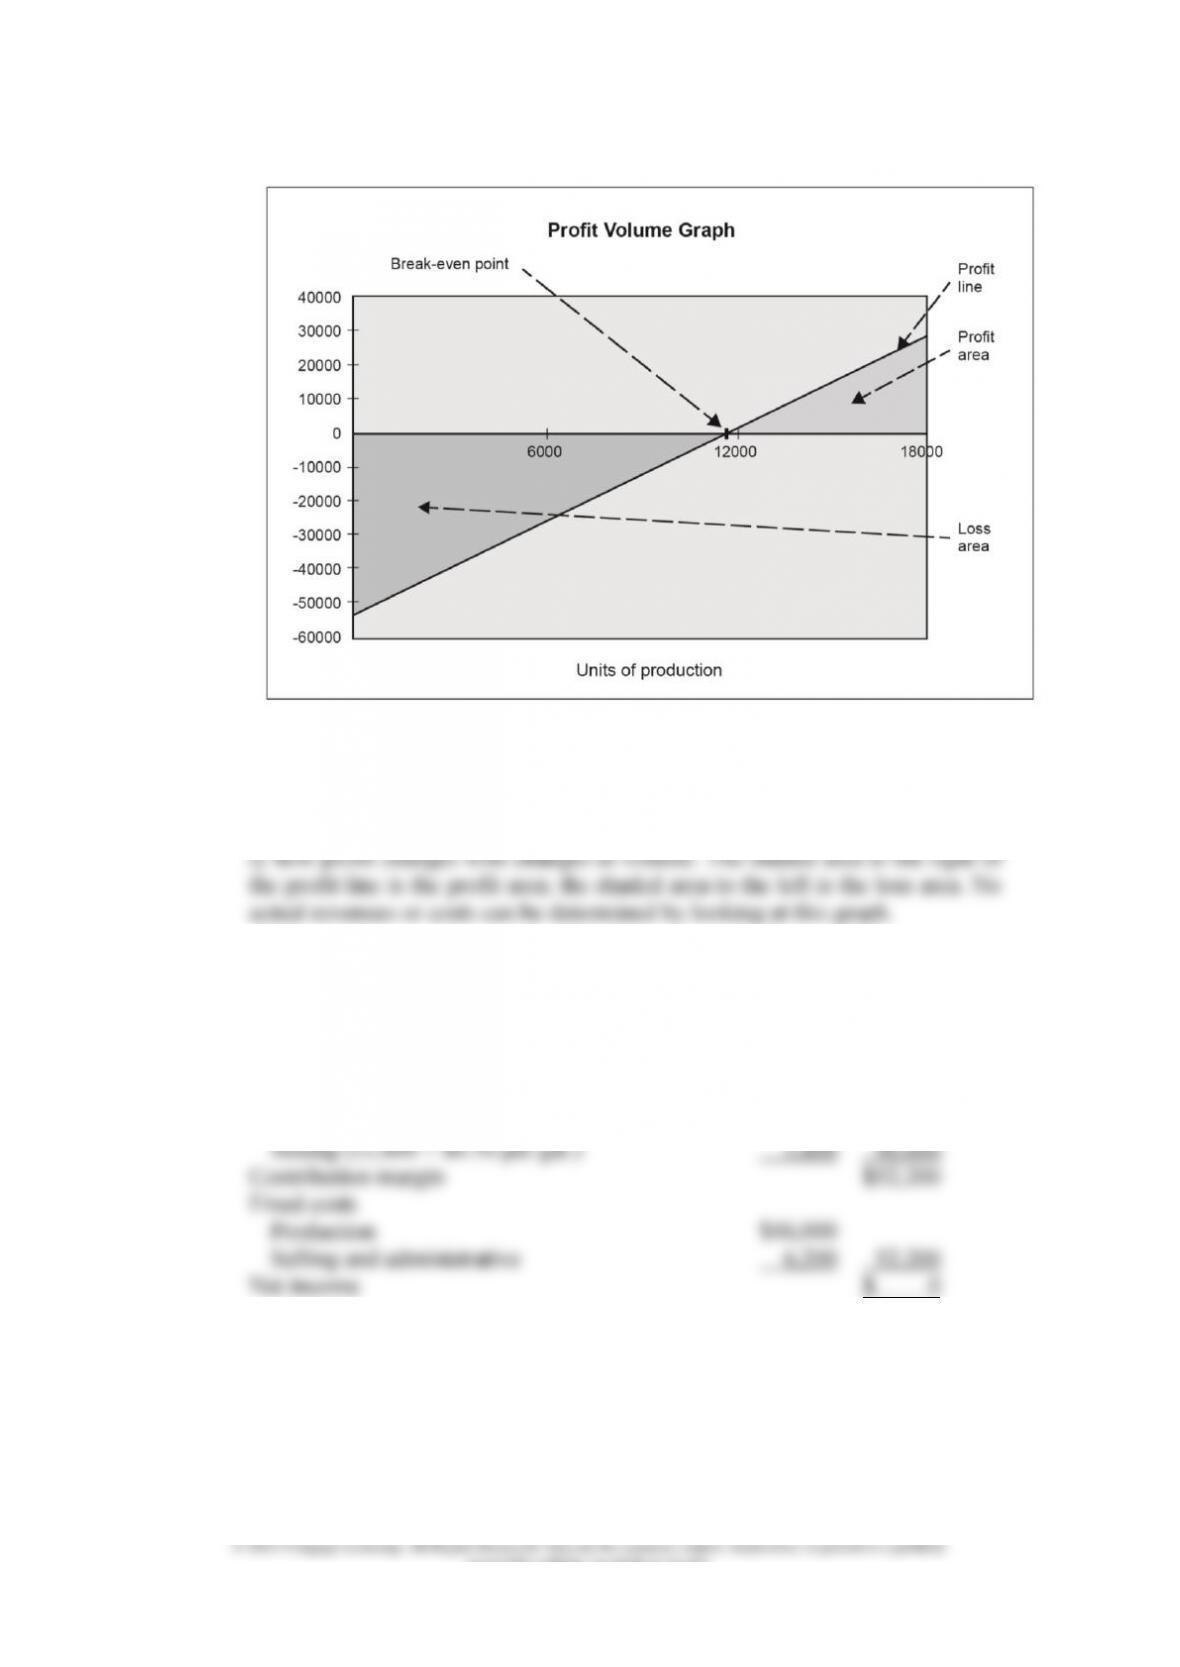
The graph approach provides a visual relationship between revenues and costs.
mined from a visual view of the graph.
3. The contribution margin ratio is contribution margin per unit divided by selling
4. The usefulness of CVP analysis is its ability to clearly forecast income expected to
result from the short-run interplay of cost, volume, price, and quantity. It is often
process further, and pricing.
262 Chapter 9
In the long run, however, all of these factors and their relationships and the as-
ed periodically to maintain validity.
5. The “bag” or “basket” assumption means that a multiproduct firm will consider
bution margins may differ significantly. A single contribution margin must be
tions to be made.
6. If the company includes more of its higher contribution margin products—
squigees—than its lower contribution margin products—widgees—in its multi-
impact on the average contribution margin. Previously, the product widgees, with
the lowest contribution margin had the greater impact on the average contribution
margin.
7. Margin of safety is the difference between actual or projected sales and break-
even level sales. Margin of safety can be expressed in units, in dollars, or as a per-
costs in a company’s cost structure. It indicates how sensitive a company’s sales are
to sales volume increases and decreases.
operating leverage indicates that the level of profit is very sensitive to a change in
revenue level. The reverse is true for low operating leverage. Margin of safety
ciprocal of the margin of safety percentage.
Chapter 9 263
EXERCISES
8. a.
Ingredients
$ 56,000
Labor
26,000
Variable overhead
48,000
Total variable cost
$ 130,000
Divided by units
÷ 104,000
Variable production cost per unit
$1.25
b. Variable cost of goods sold = 98,000 × $1.25 = $122,500
c. and d.
Dollars
Percent
Contribution margin ratio is:
Sales (98,000 × $3.10)
$ 303,800
100
Less variable costs
Cost of goods sold
$122,500
Variable selling & admin.
10,000
(132,500)
44
Contribution margin and ratio
$ 171,300
56
Contribution margin per unit = $171,300 ÷ 98,000 = $1.75 per bottle (rounded)
9. a.
Direct material
$ 150,000
Direct labor
100,000
Manufacturing overhead
75,000
Total variable production cost
$ 325,000
Divided by units produced
÷ 325,000
Variable production cost per cap
$1.00
b.
Contribution margin per unit:
Revenue
$450,000
Less variable costs
Cost of goods sold (180,000 × $1.00)
$180,000
Selling and administrative
90,000
270,000
Contribution margin
$180,000
Divided by units sold
÷180,000
Contribution margin per unit
$1.00
c. Top Disc
Income Statement
For 2013
Sales revenue
$ 450,000
Less variable costs
Cost of goods sold (180,000 × $1.00)
$180,000
Selling and administrative
90,000
(270,000)
Contribution margin
$ 180,000
Less fixed expenses
Manufacturing overhead
$112,500
Selling and administrative
100,000
(212,500)
Net loss
$ (32,500)
264 Chapter 9
accessible website, in whole or in part.
10. a. Total revenue rises by $25 + $21 = $46
12. a. Break-even point in rings = $345,000 ÷ ($600 $300) = 1,150
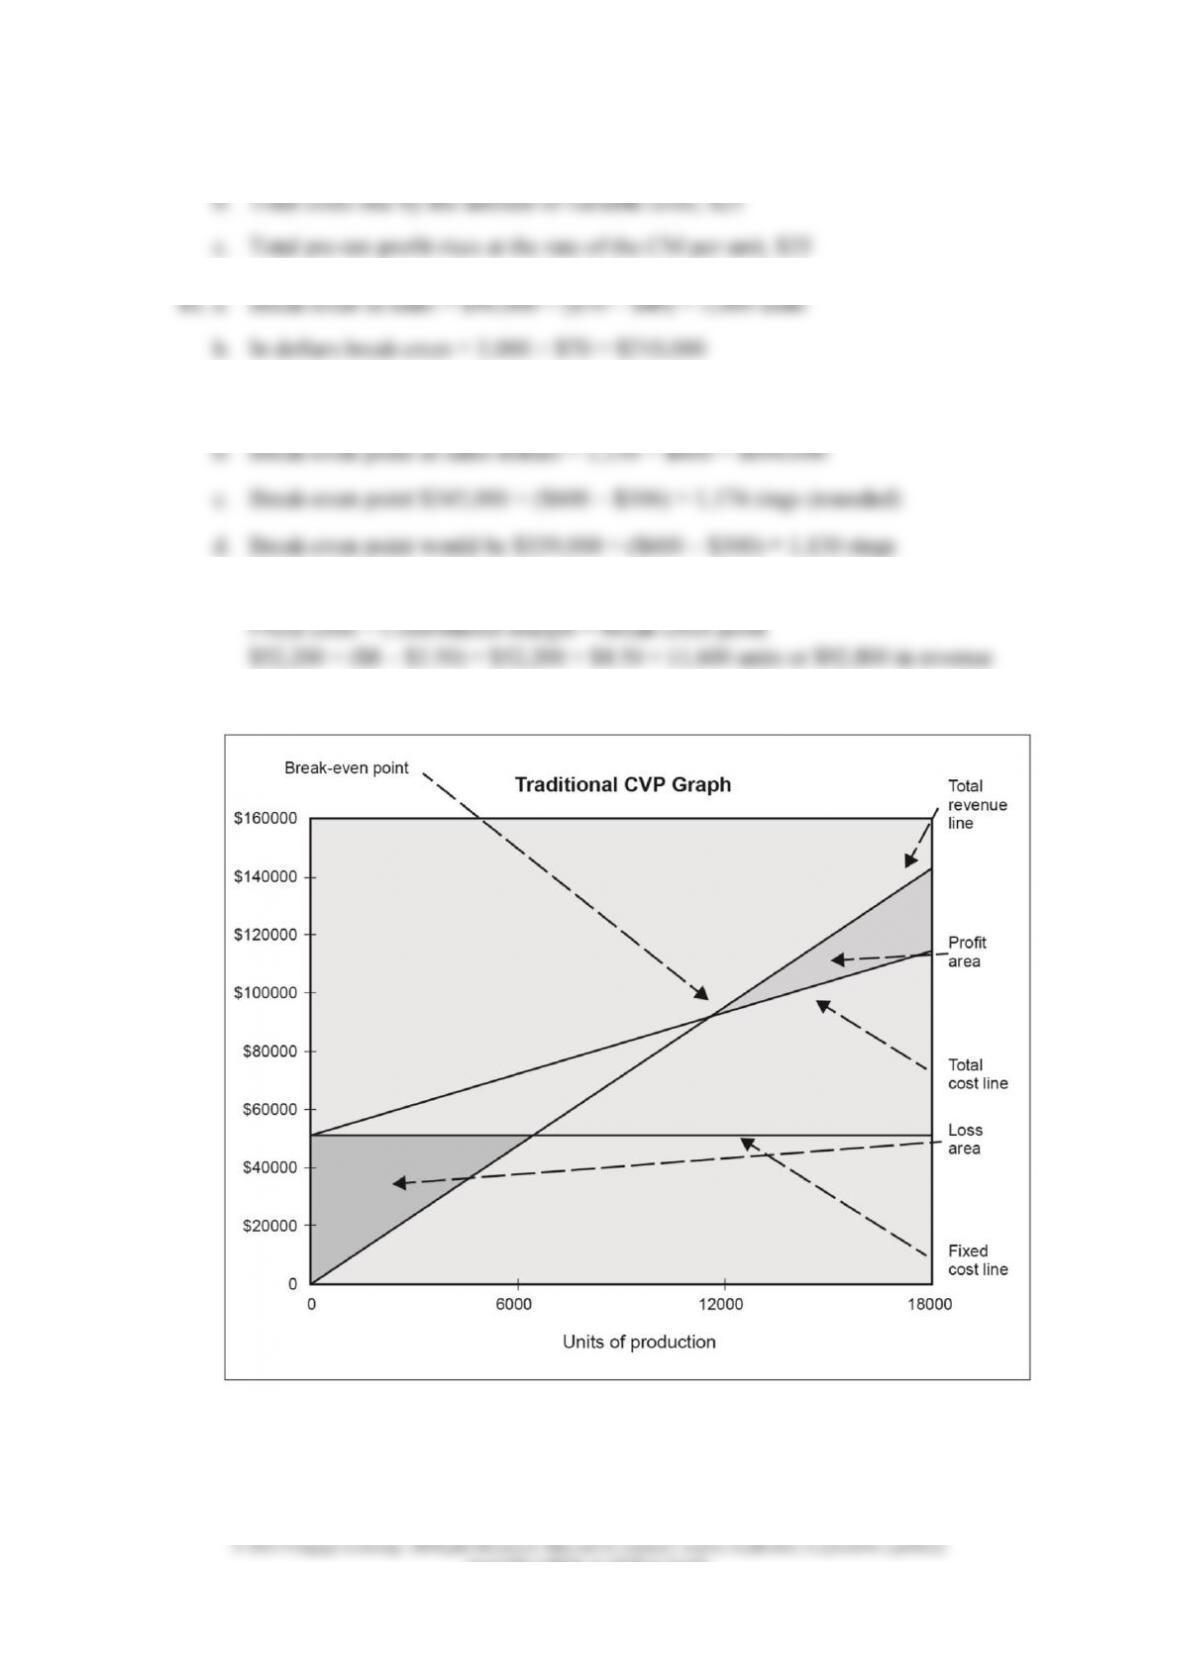
13. a. The break-even point is the point at which total revenue equals total cost.
b.
Chapter 9 265
accessible website, in whole or in part.
c. Break-even point
d. Graph (b) demonstrates how total costs and total revenues change as volume
changes. Profit or loss is the distance between the total revenue and total cost
lines. In graph (c), variable costs are not explicitly shown but can be inferred
as the distance between the total cost and fixed cost lines. Graph (c) shows on-
e. Pittsburg Tar Co.
Income Statement
For the Year Ended 2013
Sales (11,600 gal. × $8 per gal.)
$92,800
Variable costs
Production (11,600 gal. × $3.00 per gal.)
$34,800
Selling (11,600 × $0.50 per gal.)
5,800
40,600
Contribution margin
$52,200
Fixed costs
Production
$46,000
Selling and administrative
6,200
52,200
Net income
$ 0
266 Chapter 9
14.
Given
Plugged
Sales
$ ?
Less variable cost
0.7(S)
Contribution margin
$ ?
$ 900,000
Less fixed costs
(600,000)
(600,000)
Profit
$ 300,000
$ 300,000
Let S = sales
Then S 0.7S = $900,000
0.3S = $900,000
S = $3,000,000
Then the minimum selling price is $3,000,000 ÷ 30,000 units = $100.
15. a. Break-even in units is $260,000 ÷ ($1,800 $1,000) = 325 garden sheds.
16. a. Contribution margin per unit = Sales less variable costs
b. Contribution margin ratio = Contribution margin ÷ Sales
$62,640 ÷ $108 = 580 units
d. Break-even in dollars is fixed costs ÷ Contribution margin ratio
($62,640 + $51,840) ÷ $108 = 1,060 units
17. a. Convert after-tax to pre-tax profit: $182,000 ÷ (1 0.35) = $280,000
The number of garden sheds that must be sold to generate $280,000 =
Before-tax income = 0.08R ÷ (1 – 0.35) = 0.123R
Revenue – Variable costs – Fixed costs = Income before tax
Let X = Units sold
$1,800X $1,000X $260,000 = 0.123($1,800)X
Chapter 9 267
Check: $810,000 × 0.08 = $64,800 after-tax income needed (round to
$65,000) $64,800 ÷ 0.65 = $99,692 before-tax income (round to
18. a. Convert the after-tax income to pre-tax desired income:
$135,800 ÷ (1 – 0.30) = $194,000
b. Convert the after-tax to pre-tax profit:
$7.20 ÷ $180 = 0.04, or 4%; 0.04 ÷ (1 – 0.30) = 5.7% of sales
profit of $7.20 per unit
Let R = the Level of revenue that generates a pre-tax return of 5.7%:
Variable costs = ($30 + $25 + 17) ÷ $180 = 0.4, or 0.4R
19. Let Y = Level of sales generating income equal to 30% of sales, then:
Y – 0.60Y – ($25,000 per month × 12 months) = 0.30Y
$2,250,000 = $750,000.
20. a. First, convert the desired after-tax income to a pre-tax desired income:
$1,000,000 in pre-tax income:
$5,000P $3,000P $370,000 = $1,000,000
b. Find after-tax equivalent of 20%: 20% ÷ (1 0.40) = 33.33%
Variable costs as a percentage of sales: $3,000 ÷ $5,000 = 60%
R – 0.6R – $370,000 = 0.3333R
0.0667R = $370,000
R = $5,547,226
268 Chapter 9
Proof: Sales
$ 5,547,226
Variable costs (60%)
(3,328,336)
Contribution margin
$ 2,218,890
Fixed costs
(370,000)
Income before tax
$ 1,848,890
Income tax (40%)
(739,556)
Net income
$ 1,109,334
$1,109,334 ÷ $5,547,226 = 20%
22. a. $1,450 ÷ $0.50 = 2,900 passengers per day
b. Break-even: $2,000 ÷ 2,900 = $0.69 (rounded) per passenger
c. Total variable cost = $2,000 – ($2,000 × 0.80) = $400
d. At a fare of $0.70:
(2,900 × $0.70 × 0.95) – (2,900 × $0.14 × 0.95) $1,600 = $(57.20)
At a fare of $0.90:
(2,900 × $0.90 × 0.90) – (2,900 × $0.14 × 0.90) $1,600 = $383.60
e. Increasing volume will help improve profitability only if the volume change
increases total contribution margin. Because an increase in volume can often
may be negative rather than positive.
23. a. Current sales volume for both companies = $2,000,000 ÷ $40 = 50,000
New selling price $40 – (0.3 × $40) = $28; Variable costs = $1,400,000 ÷
50,000 = $28
b. New selling price: $40 × 1.3 = $52
c. Ainsley: (65,000 × $40) – (65,000 × $28) $200,000 = $580,000
Chapter 9 269
24. a. CM per unit of sales mix = ($3 × 8) + (1 × $6) = $30
b. Sales mix units = ($180,000 + $150,000) ÷ $30 = 11,000 = 33,000 wallets and
c. Equivalent pre-tax profit = $150,000 ÷ (1 0.40) = $250,000
d. Units of sales mix = $1,155,000 ÷ [(5 × $30) + (2 × $15)] = 6,417 (rounded) =
32,085 wallets and 12,834 money clips
planned sales mix.
25. a. Fixed costs ÷ Contribution margin = Break-even point in units
$1,080,000,000 ÷ [(3 × $300) + (5 × $700) + (2 × $1,000)] =
$1,080,000,000 ÷ $6,400 = 168,750 bags
Mod = 3 × 168,750 = 506,250 units × $2,200 =
$1,113,750,000
Rad = 5 × 168,750 = 843,750 units × $3,700 =
3,121,875,000
X-treme = 2 × 168,750 = 337,500 units × $6,000 =
2,025,000,000
Revenue to break-even
$6,260,625,000
b. Convert after-tax to pre-tax income. $1,000,000,000 ÷ (1 0.5) = $2,000,000,000
($2,000,000,000 + $1,080,000,000) ÷ $6,400 = 481,250 bags
Mod = 3 × 481,250 = 1,443,750 units × $2,200 =
$ 3,176,250,000
Rad = 5 × 481,250 = 2,406,250 units × $3,700 =
8,903,125,000
X-treme = 2 × 481,250 = 962,500 units × $6,000 =
5,775,000,000
Total revenue needed
$17,854,375,000
gin, are being sold.
270 Chapter 9
Scooter
Contribution Margin
Mod
5 × $300
=
$1,500
Rad
4 × $700
=
2,800
X-treme
1 × $1,000
=
1,000
Total
$5,300
d. If Green Rider sells more of its scooters with the greatest contribution margin
26. a. Break-even is $264,000 ÷ ($9.60 $7.60) = 132,000 bushels
174,000 – 132,000 = 42,000 bushels
27. a. Break-even = Fixed costs ÷ Contribution margin
PBT = 0.25 × $60 = $15
CM(X) – PBT(X) = FC
($30 × 20,000) ÷ $150,000a = 4
d. (Total contribution margin × 1.15) = $30 × 20,000 × 1.15 = $690,000