Exercise 17-19 Name:
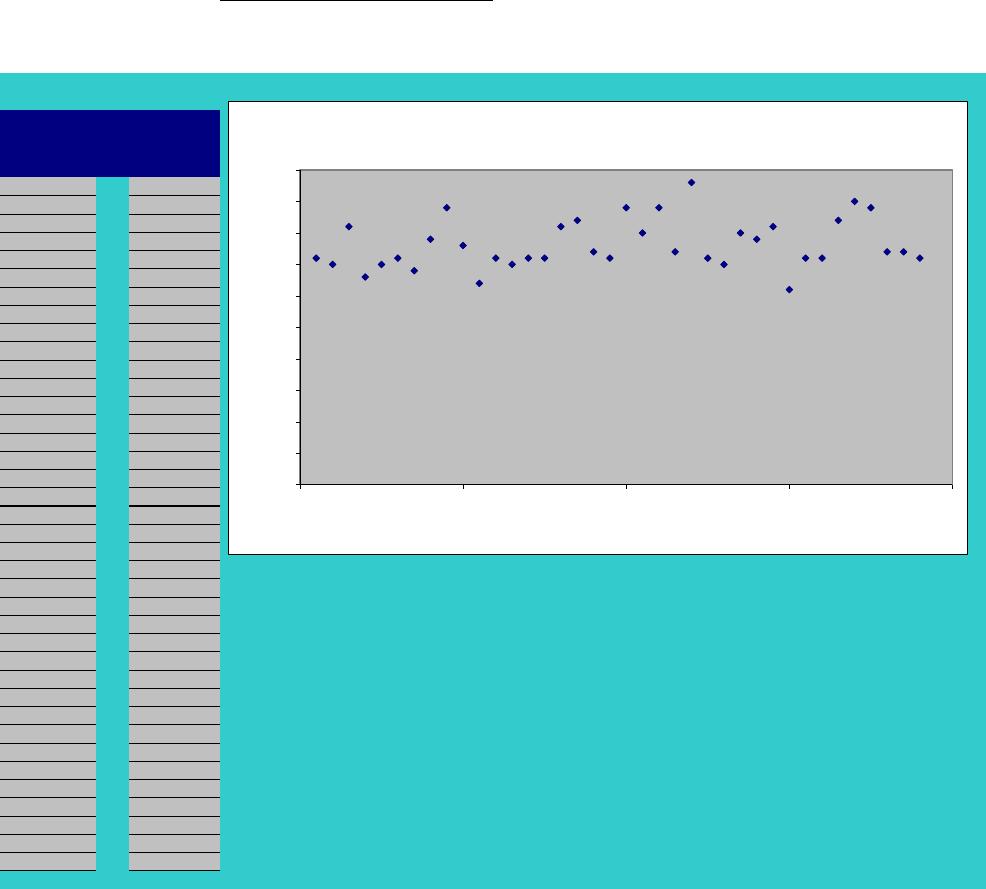
Enter the data in columns C and E below. When you have entered all data points, the scattergraph
to the right and below will be correct.
Observation
Number
Number of
Slices of
Pepperoni
136
235
341
433
535
636
734
839
944
10 38
11 32
12 36
13 35
14 36
15 36
16 41
17 42
18 37
19 36
20 44
21 40
22 44
23 37
24 48
25 36
26 35
27 40
28 39
29 41
30 31
31 36
32 36
33 42
34 45
35 44
36 37
37 37
38 36
Solution
0
5
10
15
20
25
30
35
40
45
50
010 20 30 40
Number of Slices of Pepperoni
Observation Number
Control Chart
Cost Management Hansen and Mowen