Learning Objectives
1. What is the break-even point (BEP) and why is it important?
2. How is the BEP determined and what methods are used to identify BEP?
decision making?
4. How do break-even and CVP analysis differ for single-product and multiproduct firms?
BREAK-EVEN POINT AND COST-VOLUME-
PROFIT ANALYSIS
CHAPTER
9
Chapter 09: Break-Even Point and Cost-Volume-Profit Analysis IM 2
Terminology
Break-even chart: a graph that depicts the relationships among revenue, volume, variable costs, fixed
Break-even point (BEP): the level of activity, in units or dollars, at which total revenues equal total costs
Contribution margin ratio (CM%): the proportion of each revenue dollar remaining after variable costs
Degree of operating leverage (DOL): a factor that indicates how a percentage change in sales from the
Incremental analysis: a process of evaluating alternatives that focuses only on the factors that change
Margin of safety (MS): the excess of the budgeted or actual sales of a company over break-even sales;
Operating leverage: the proportionate relationship between a company’s variable and fixed costs
Variable cost ratio (VC%): the proportion of each revenue dollar needed to cover variable costs;
Chapter 09: Break-Even Point and Cost-Volume-Profit Analysis IM 3
publicly accessible website, in whole or in part.
Lecture Outline
LO.1: What is the break-even point (BEP) and why is it important?
A. Introduction
1. Much of the information managers use to plan and control reflects relationships among product
components.
2. This chapter focuses on understanding how costs, volumes, and profits interact.
B. Break-even Point
1. Variable costing is commonly used for internal purposes because it makes cost behavior more
transparent.
models.
b. A variable costing income statement for Calispell Company is presented in text Exhibit 9.1
2. The break-even point (BEP) is the level of activity, in units or dollars, at which total revenues
equal total costs.
from operations rather than losses.
3. Several simplifying assumptions must be made concerning revenue and cost functions (These
are discussed in more detail at the end of the chapter):
factors such as quantity discounts are ignored;
c. Variable costs: Total variable costs fluctuate in direct proportion to the level of activity or
costs are assumed to be fixed;
Chapter 09: Break-Even Point and Cost-Volume-Profit Analysis IM 4
©2013 Cengage Learning. All Rights Reserved. May not be scanned, copied or duplicated, or posted to a
publicly accessible website, in whole or in part.
d. Fixed costs: Total fixed costs are assumed to remain constant within the relevant range.
Fixed cost per unit decreases as volume increases, and increases as volume decreases.
Fixed costs include both fixed manufacturing overhead and fixed selling and administrative
expenses; and
4. Contribution margin (CM) is the difference between revenue and variable cost. CM may be
b. CM fluctuates in direct proportion to sales volume. Since unit revenue and unit variable cost
LO.2: How is the BEP determined and what methods are used to identify BEP?
C. Identifying the Break-even Point
1. Formula Approach to Breakeven
a. The formula approach uses an algebraic equation to calculate the exact break-even point.
c. Algebraic break-even computations use an equation that represents the variable costing
volume, and profit as follows:
R(X) – VC(X) – FC = P
where R = revenue (selling price) per unit
X = number of units sold or to be sold
formula to indicate a break–even situation.
ii. The break-even point in units can be found by solving the equation for X:
X = FC ÷ (R – VC)
iii. Break-even point volume is equal to total fixed cost divided by the unit contribution
contribution margin per unit
Chapter 09: Break-Even Point and Cost-Volume-Profit Analysis IM 5
publicly accessible website, in whole or in part.
on a total or per unit basis.
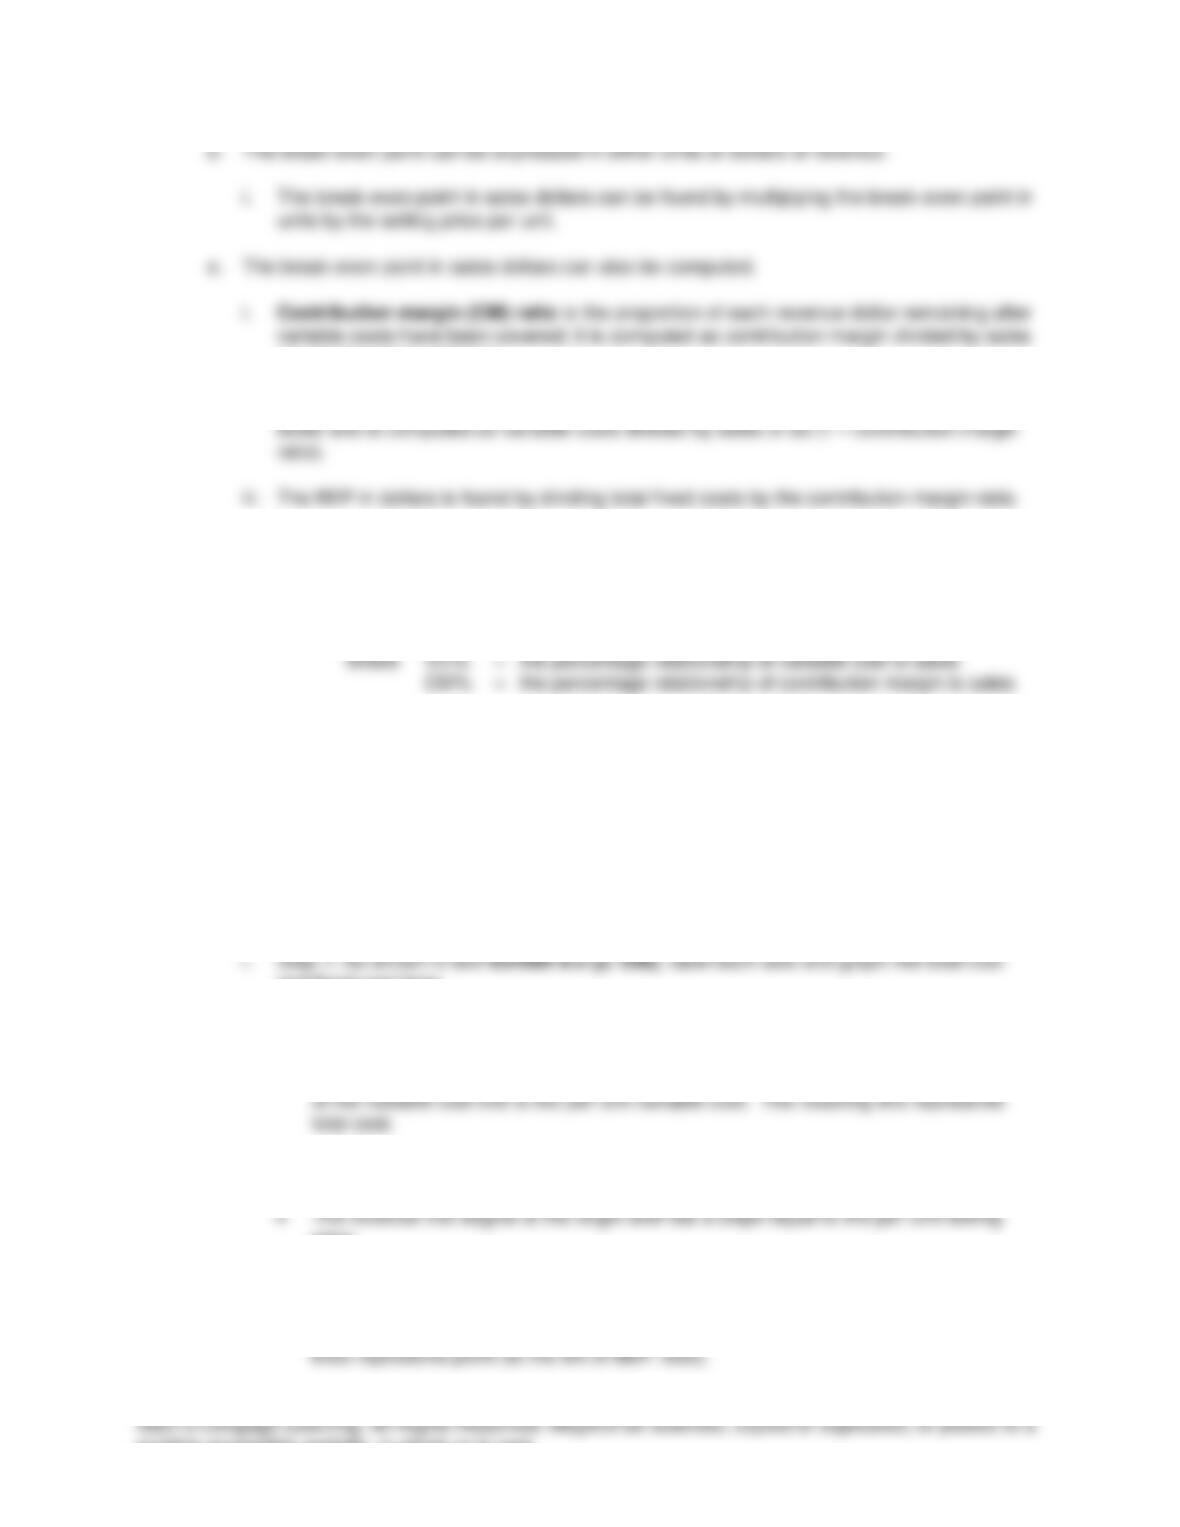
ii. The variable cost (VC) ratio represents the variable cost proportion of each revenue
Sales = FC ÷ (1 – VC%)
or
Sales = FC ÷ CM%
2. Graphing Approach to Breakeven
a. Sometimes BEP information may be more effectively conveyed to managers in a visual
format.
i. Text Exhibit 9.2 (p. 357) provides a visual representation of Calispell Company’s
revenue, cost and contribution margin behaviors.
b. Traditional Approach
and fixed cost lines.
The fixed cost line is drawn parallel to the x-axis.
The variable cost line begins where the fixed cost line intersects the y-axis. The slope
ii. Step 2: Graph the total revenue line.
price.
iii. The BEP is located at the intersection of the total revenue line and the total cost line.
The vertical distance to the right of the BEP and between the revenue and total cost
Chapter 09: Break-Even Point and Cost-Volume-Profit Analysis IM 6
©2013 Cengage Learning. All Rights Reserved. May not be scanned, copied or duplicated, or posted to a
publicly accessible website, in whole or in part.
iv. Text Exhibit 9.4 (p. 358) presents a traditional CVP graph for Calispell Company.
c. Profit-Volume Graph
i. The profit-volume graph is a visual representation of the amount of profit or loss
d. Income Statement Approach
i. The income statement approach to CVP analysis allows the preparation of pro forma
ii. Income statements can be used to prove the accuracy of computations made with the
3. The break-even point provides a starting point for planning future operations.
a. Managers want to earn profits, not just cover costs, so the break-even point formula can be
used by substituting an amount other than zero for the profit (P) term.
b. This substitution converts break–even analysis to cost-volume-profit analysis.
LO.3: What is cost-volume-profit (CVP) analysis and how do companies use CVP information in
decision making?
D. CVP Analysis
1. General
a. Cost-volume-profit analysis is a procedure that examines changes in costs and volume
levels and the resulting effects on profits.
i. CVP analysis can be used to calculate the sales volume necessary to achieve a desired
b. Managers use CVP to plan and control more effectively since the technique allows them to
i. The CVP model can be expressed through a formula or as a graph.
Chapter 09: Break-Even Point and Cost-Volume-Profit Analysis IM 7
c. CVP analysis requires the substitution of known amounts in the formula to determine an
d. A significant application of CVP analysis is the setting of a desired target profit and focusing
accomplish this objective.
ii. Selling price is not as common an unknown as volume since the selling price is usually
e. Profits may be stated as either a fixed or variable amount and on either a before-tax or after-
tax basis.
2. Fixed Amount of Profit
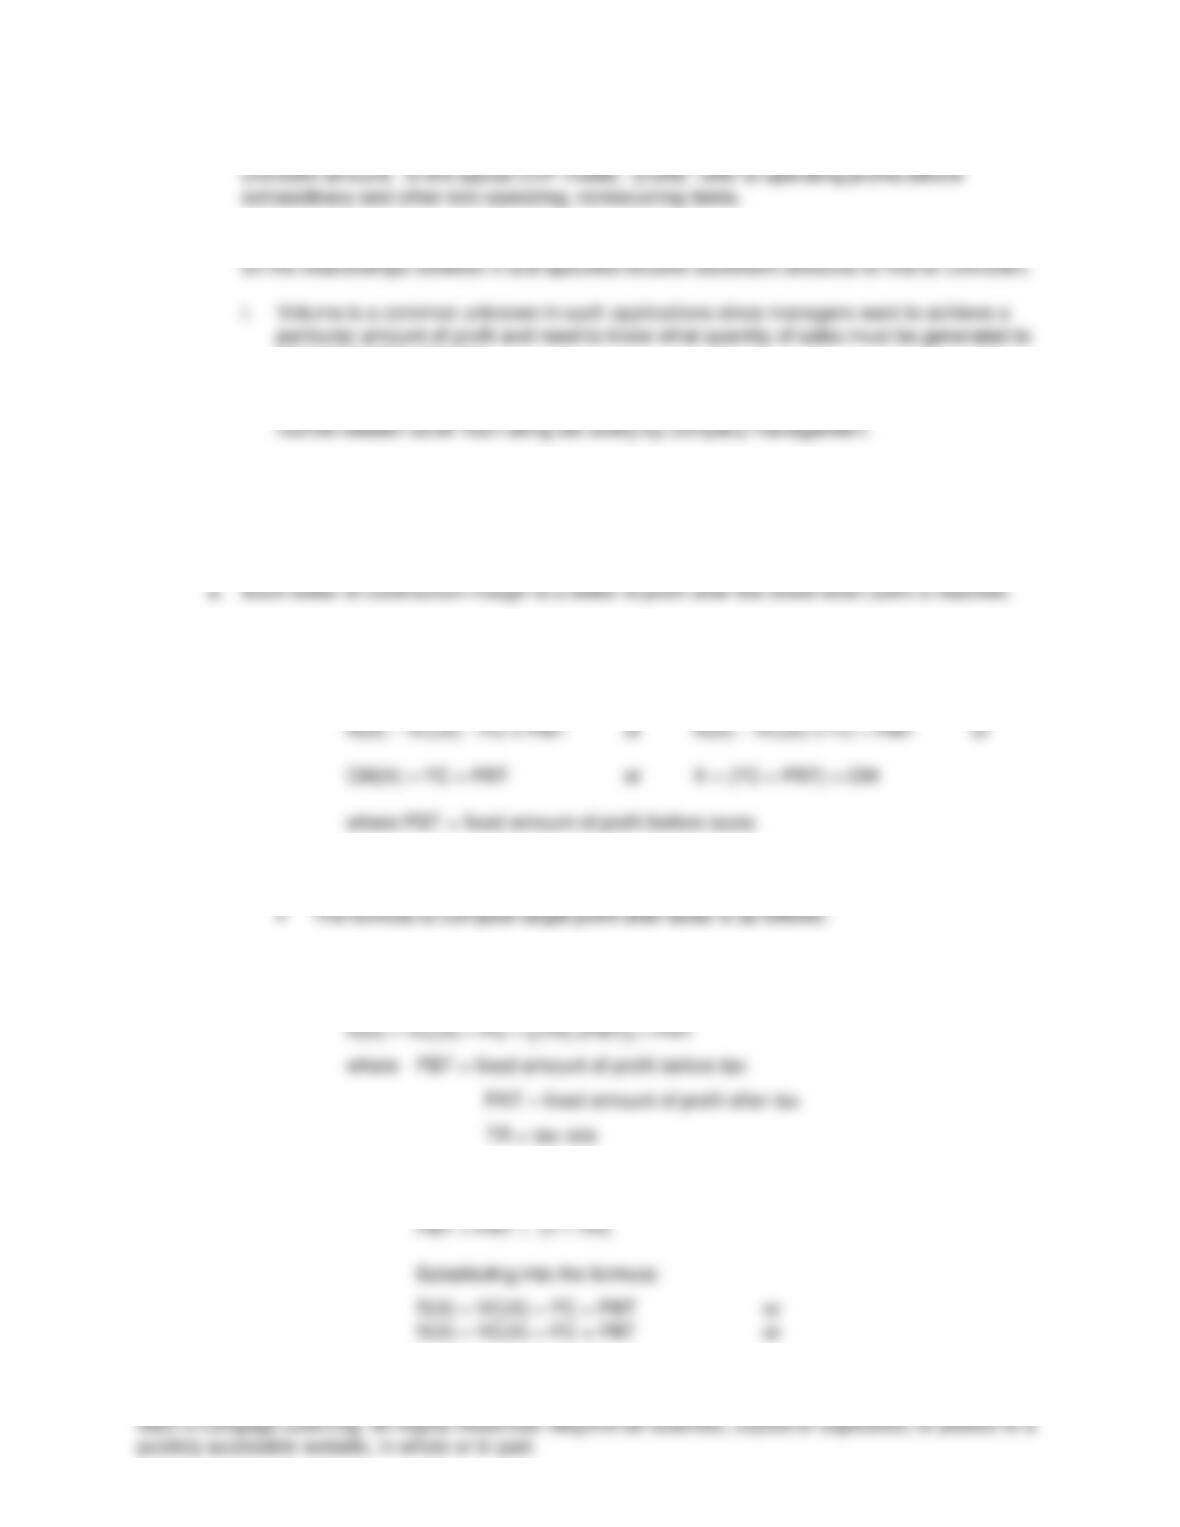
i. Before Tax
The formula to compute target profit before tax is as follows:
ii. After Tax
PBT – [(TR) (PBT)] = PAT
and
PBT is further defined as:
PBT – (1 – TR) = PAT or
Chapter 09: Break-Even Point and Cost-Volume-Profit Analysis IM 8
©2013 Cengage Learning. All Rights Reserved. May not be scanned, copied or duplicated, or posted to a
publicly accessible website, in whole or in part.
(R – VC)(X) = FC + [PAT ÷ (1 – TR)] or
CM(X) = FC + [PAT ÷ (1 – TR)]
3. Specific Amount of Profit Per Unit
a. Managers may desire a specific amount of profit per unit, in which case, profit must be
i. A set amount of profit can be stated on either a before tax or after tax basis or as either a
b. Before Tax
i. Text Exhibit 9.8 (p. 363) provides an analysis of a set amount of profit per unit before
tax.
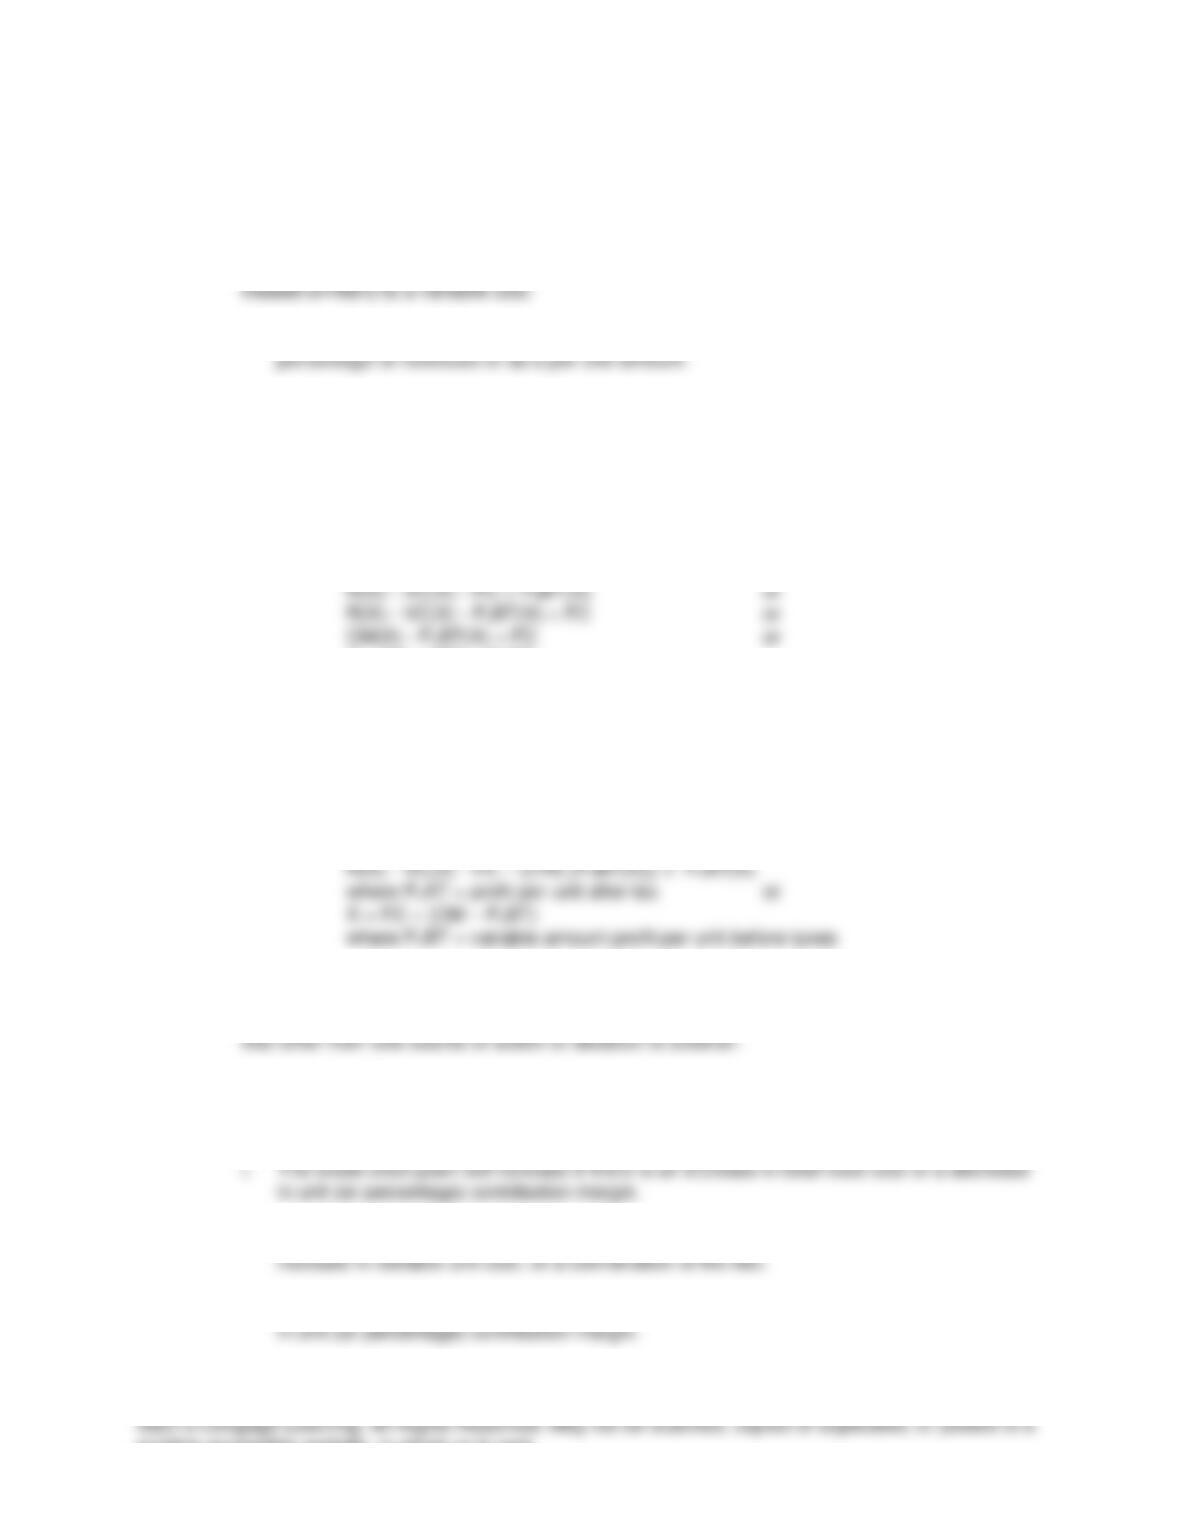
ii. The adjusted CVP formula for computing the necessary unit sales volume to earn a
specified amount of profit before tax per unit is as follows:
X = FC ÷ (CM – PuBT)
c. After Tax
i. Text Exhibit 9.9 (p. 364) provides an analysis of a set amount of profit per unit after tax
ii. The adjusted CVP formula for computing the necessary unit sales volume to earn a
specified amount of profit after tax per unit is as follows:
4. Incremental Analysis for Short-Run Changes
a. Incremental analysis is a process of evaluating changes that focuses only on the factors
b. The break-even point may increase or decrease, depending on the particular changes that
occur in the revenue and cost factors.
ii. A decrease in contribution margin could arise due to a reduction in selling price, an
iii. The break-even point will decrease if there is a decrease in total fixed cost or an increase
Chapter 09: Break-Even Point and Cost-Volume-Profit Analysis IM 9
c. Any factor that causes a change in the break-even point will also cause a shift in total profits
d. The text presents four examples (cases) of changes in the CVP variables that could occur
LO.4: How do break-even and CVP analysis differ for single-product and multiproduct firms?
E. CVP Analysis in a Multiproduct Environment
1. A constant product sales mix or, alternatively, an average contribution margin ratio must be
assumed in order to perform CVP analysis in a multiproduct company.
margin.
i. Note that it is the sum of all of the products’ individual product CM multiplied by its weight
or mix proportion.
4. Any shift in the sales mix proportion of products will change the weighted average contribution
margin and the break-even point.
LO.5: How are margin of safety and operating leverage concepts used in business?
F. Managing Risk of CVP Relationships
1. Margin of Safety
a. The margin of safety is the excess of the budgeted or actual sales of a company over its
degree of operating leverage).