
QUESTIONS FOR REVIEW AND CRITICAL THINKING/ANSWERS
1. Define multivariate statistical analysis.
Research that involves three or more variables, or that is concerned with underlying dimensions
2. What is the variate in multivariate? What is an example of a variate in multiple regression
and in factor analysis?
The variate is a mathematical way in which a set of variables can be represented with one
equation. Variates are formed as a linear combination of variables, each contributing to the
3. What is the distinction between dependence techniques and interdependence techniques?
If the technique attempts to explain or predict the dependent variable on the basis of two or more
independent variables, the researcher is investigating dependence. Multiple regression, multiple
4. What is the GLM? How can multiple regression and n-way ANOVA be described as GLM
approaches?
Multivariate dependence techniques are variants of the general linear model (GLM). Simply, the
GLM is a way of modeling some process based on how different variables cause fluctuations
5. What are the steps in interpreting a multiple regression analysis result? Can the same steps
be used to interpret a univariate ANOVA model?
Steps in interpreting a multiple regression model:
1. Examine the model F-test – if not significant, the model should be dismissed and there
is no need to proceed to further steps.
396
© 2013 Cengage Learning. All Rights Reserved. May not be scanned, copied or
duplicated, or posted to a publicly accessible website, in whole or in part.

Chapter Twenty-four: Multivariate Statistical Analysis 397
4. Examine collinearity diagnostics – multicollinearity in regression analysis refers to
how strongly interrelated the independent variables in a model are.
For ANOVA, the steps involved are essentially the same with the addition of interpreting
differences between means.
6. A researcher dismisses a regression result because the model R2 was under 0.70. Do you
think this was necessarily wise? Explain.
No cut-off values exist when examining R2. However, the absolute value is more important when
7. Return to the simple example of regression results for the toy company presented in the
chapter. Since the data come equally from Europe and Canada, does this represent a
potential source of variation that is not accounted for in the researcher’s model? How could
the researcher examine whether or not sales may be dependent upon country?
Less than interval (non-metric) independent variables can be used in multiple regression. This
8. What is a factor loading?
9. How does factor analysis allow for data reduction?
Factor analysis is a technique of statistically identifying a reduced number of factors from a larger
number of measured variables. The factors themselves are not measured, but instead, they are
10. How is the number of factors decided in most EFA programs?
© 2013 Cengage Learning. All Rights Reserved. May not be scanned, copied or
duplicated, or posted to a publicly accessible website, in whole or in part.

Chapter Twenty-four: Multivariate Statistical Analysis 398
11. What is multi-dimensional scaling? When might a researcher use this technique?
Multidimensional scaling provides a means for measuring objects in multidimensional space on
the basis of respondents’ judgments of the similarity of objects. The perceptual difference among
12. What is cluster analysis? When might a researcher use this technique?
Cluster analysis is a multivariate approach for identifying objects or individuals that are similar to
one another in some respect. It classifies individuals or objects into a small number of mutually
exclusive and exhaustive groups. Objects or individuals are assigned to groups so that there is
13. Name at least two multivariate techniques that can be useful in constructing perceptual maps.
There are multiple ways of using multivariate procedures to generate a perceptual map. For
14. A researcher uses multiple regression to predict a client’s sales volume based on gross
domestic product, personal income, disposable personal income, unemployment, and the
consumer price index. What problems might be anticipated with this multiple regression
model?
The predictor variables are all highly intercorrelated. Multicollinearity in regression analysis
refers to how strongly interrelated the independent variables in a model are. When
RESEARCH ACTIVITIES
© 2013 Cengage Learning. All Rights Reserved. May not be scanned, copied or
duplicated, or posted to a publicly accessible website, in whole or in part.

Chapter Twenty-four: Multivariate Statistical Analysis 399
1. Use the multistep process to interpret the regression results below (see the textbook for the
results). This model has been run by a researcher trying to explain customer loyalty to a
restaurant. The independent variables are customer perceptions of value, atmosphere, quality
and a location variable labeled center. This is a dummy variable that takes the value of 1 if
the restaurant is in a shopping center an 0 if it is a stand-alone location. What substantive
conclusions would you recommend to the restaurant company?
Steps in interpreting a multiple regression model:
1. Examine the model F-test – if not significant, the model should be dismissed and there
is no need to proceed to further steps.
The model F of 7.049 is significant at the p < 0.05 level. The independent variables with
significant t-tests at the p < 0.05 level are Value and Center, and Atmosphere is significant at the p
2. Interpret the following GLM results (see the textbook for the results). Following from an
example in the chapter, performance is the performance rating for a business unit manager.
Sales is a measure of the average sales for that unit. Experience is the number of years the
manager has been in the industry. The variable dummy has been added. This variable is 0 if
the manager has no advanced college degree and a 1 if the manager has an MBA. Do you
have any recommendations?
Students should use the steps outlined in the previous activity to interpret the results. The overall
3. Interpret the following regression results (see the textbook for the results). All of the
variables are the same as in number 2. These results are produced with a regression program
instead of the GLM-univariate ANOVA program.
a. What do you notice when the results are compared to those in number 2? Comment.
© 2013 Cengage Learning. All Rights Reserved. May not be scanned, copied or
duplicated, or posted to a publicly accessible website, in whole or in part.

Chapter Twenty-four: Multivariate Statistical Analysis 400
The model F-value and the p-value associated with it are identical. The t-values for the
b. List the independent variables in order from greatest to least in terms of how strong the
relationship is with performance.
When researchers want to know which independent variable is most predictive of the dependent
c. When might one prefer to use an ANOVA program instead of a multiple regression
program?
When the independent variables are less than interval.
4. Interpret the following factor analysis results (see the textbook for the results). The variables
represent sample results of self-reported emotions while viewing a film. Why are only two
factors reported below? What would you name the two summated scales which could be
produced based on these results.
Only two components have eigenvalues greater than 1.0. The rotated component matrix indicates
5. [Internet Question] Go to www.census.gov and examine some of the tables for your area. Cut
and paste the table into a spreadsheet or statistical program. Run one dependence and one
interdependence technique on the data. Interpret the results.
Students’ answers will vary. Possible dependence techniques covered in this chapter include
6. [Internet Question] Use http://www.ask.com to find an F-ratio calculator that will return a
p-value given a calculated F-ratio and the degrees of freedom associated with the test.
7. [Internet Question] The Federal Reserve Bank of St. Louis maintains a database called FRED
(Federal Reserve Economic Data). Navigate to the FRED database at
http://www.stls.frb.org/fred/index.html. Use the consumer price index, exchange rates,
interest rates and one other variable to predict the consumer price index for the same time
period. The data can either be downloaded or cut and pasted into another file.
© 2013 Cengage Learning. All Rights Reserved. May not be scanned, copied or
duplicated, or posted to a publicly accessible website, in whole or in part.

Chapter Twenty-four: Multivariate Statistical Analysis 401
CASE 24.1 THE UTAH JAZZ
Objective: The case presents the statistical results of analysis of variance and multiple
discriminant analysis. The student is asked to interpret the findings.
Summary: The management of the Utah Jazz read an article dealing with market segmentation
in the professional basketball market. Data came from a survey of adult residents of a large
western metropolitan area. Respondents were selected in accordance with a quota sample of the
area that was based on the age and sex characteristics reported in the most recent census. Six age
categories for both males and females were used to gain representation of these characteristics of
the market. In addition, interviewers were assigned to various parts of the area to ensure
representation of the market with respect to socioeconomic characteristics, as well. A total of 225
respondents aged 18 and over provided data for the study.
Interviews were conducted by trained interviewers using a self-completion questionnaire. The
presence of the interviewers allowed for answering any questions that might arise, as well as
ensuring compliance with the instructions.
Measures for the variables in the three categories of AIO’s were obtained using six-point rating
scales. For example, the item for price proneness asked: When you are buying a product, such as
food, clothing, and personal care items, how important is it to get the lowest price? This item was
anchored with “Not at all important” and “Extremely important.” Several statistical tables are
presented in the case.
Question
Interpret the managerial significance of the ANOVA and multiple discriminant analysis results.
Quite clearly, the market segments for professional basketball can be characterized in terms of a
number of the variables taken from the previous studies that were considered to be relevant for
The following paragraphs summarize the nature of the three market segments that were examined
in the research, and offer implications of the empirical findings for management. Given the
High Attenders
Except for three items in the set of Opinions about Professional Sports, the relationships were
monotonic with increasing patronage. Thus, for the most part, the high attenders contrast to the
greater extent with the non-attenders, with the low attenders falling between these segments.
© 2013 Cengage Learning. All Rights Reserved. May not be scanned, copied or
duplicated, or posted to a publicly accessible website, in whole or in part.

Chapter Twenty-four: Multivariate Statistical Analysis 402
The high attenders emerge as enthusiastic sports fans. They are sports fans in general, and the
NBA team provides but one means of satisfying their needs as spectators. Beginning in their early
years, they have both participated in sporting events and viewed them as spectators. They prefer
active forms of recreation and perceive themselves as athletic. Perhaps because of their own
athletic experiences, they choose to support a winner. Because of their age and dwelling, these
high attenders are more likely than members of other segments to be characterized as less
established in the community.
With respect to strategy, franchise management can first try to sell the attractiveness of sports in
general. Helping to increase attendance for a variety of local sporting events appears to be a way
to increase attendance at NBA games. Thus, to some extent, it may be profitable to sell sports
first, basketball second, and NBA basketball third. Management should sell their attraction on the
basis that this is an athletic event, not a theatrical performance. Perhaps they can most directly
reach members of this most salient market segment through other athletic facilities, such as
gymnasiums, spas, and through programs and signs at other sporting events.
Further, management should support athletic events around the community wherever possible. In
particular, developing an interest in sports in youngsters will have long-term profit implications
for the franchise. These marketers should help patrons (and non-patrons) to see themselves as
athletic, and should seek additional ways to help them identify with the professional athletes on
the basketball court.
This attempt to further develop their customers’ identification with athletics (and this form of
athletics in particular), may be successful to the extent it relates to one’s earlier experiences.
Potential customers can be shown the virtues of bringing a younger person to the next NBA game
with them, thus giving the youth the same good times they enjoyed as youngsters (and perhaps
reliving pleasant parts of their own childhood). At the extreme, such appeals to altruism can
suggest that “winning” need not be shown only on the scoreboard (perhaps a necessity if the local
team is one of the league’s doormats).
Low Attenders
The findings suggest that the low attender group may consist largely of the curious and those who
have attended a game with someone else who had a greater interest in the proceedings. These
infrequent patrons have not caught the excitement of the game and the enthusiasm of the sports
fans described in the preceding section. They are more accepting of the beer concession.
As this group falls generally between the other two segments, the first approach would likely be
to use the same strategy outlined above for the sports fans. But, given their several differences
from the other two segments, some variation on this strategy may be necessary. If so, these
customers must be shown that professional basketball is a suitable alternative to their preferred
way to spend an evening. Perhaps they can be encouraged to find an interest in “natural” rivalries
among teams, rather than to see animosity in the physical combat on the court.
Non-Attenders
The non-attenders are older, more established persons who have the least interest in sports of the
three segments. The data give little positive help in making appeals to them. Thus, it appears that
© 2013 Cengage Learning. All Rights Reserved. May not be scanned, copied or
duplicated, or posted to a publicly accessible website, in whole or in part.

Chapter Twenty-four: Multivariate Statistical Analysis 403
efforts directed at these persons would best succeed if made in terms other than those suggested
for the heavy half of the patrons. Perhaps they will respond to messages about the important
tradition of having the team in the community and appeals based on how the team represents their
community throughout the country. The non-attenders may be shown the benefits of buying
tickets for others with a greater interest in sports, perhaps for business associates, employees, and
customers.
The findings for this group provide the clearest basis for suggestions for future research.
Non-attenders can be asked the attributes they find enjoyable in preferred leisure pursuits, then
asked to use these attributes to contrast NBA basketball with the more appealing alternatives.
They can be asked their reactions to specific aspects of strategy, such as pricing and scheduling of
games. They may further be asked to react to proposed changes in this strategy.
In conclusion, the AIOs provide a useful portrayal of the market, especially by characterizing the
frequent attenders—who, after all, are the bread-and-butter of the franchise. As is often the case,
demographics also help to portray the market, although in this case they were less suggestive than
usual of strategy.
CASE 24.2 How Do We Keep Them?
Data: Use the data labeled profit for this case.
Objective: The purpose of this case is to allow students to perform interdependence and
dependence techniques.
Summary: The data go along with the research snapshot labeled “Too much of a good thing,”
which illustrates the difficulty in interpreting regression results with several highly correlated
independent variables. Management wants to understand turnover of managers, and several
emotions to describe the way they feel about their job are measured using semantic differential
scales. Another variable, the likelihood a manager will quit within twelve months, is also
assessed. An initial regression model with eight independent variables predicting turnover was
confusing and difficult to make sense of. Thus, the researcher turned to a data reduction
technique to enable a regression with fewer independent variables. These are the tasks the
students must perform.
Questions
1. Perform the appropriate multivariate technique to identify underlying dimensions that may
exist among the emotion ratings.
Factor Analysis – there are multiple ways to approach this problem. Since the case set up implies
that management is interested in eight variables, the student should select the eight that make
© 2013 Cengage Learning. All Rights Reserved. May not be scanned, copied or
duplicated, or posted to a publicly accessible website, in whole or in part.
Chapter Twenty-four: Multivariate Statistical Analysis 404
scales as described earlier. The user should note that the semantic differential for excitement is
split loaded and should not be included on any scale (it lacks discriminant validity).
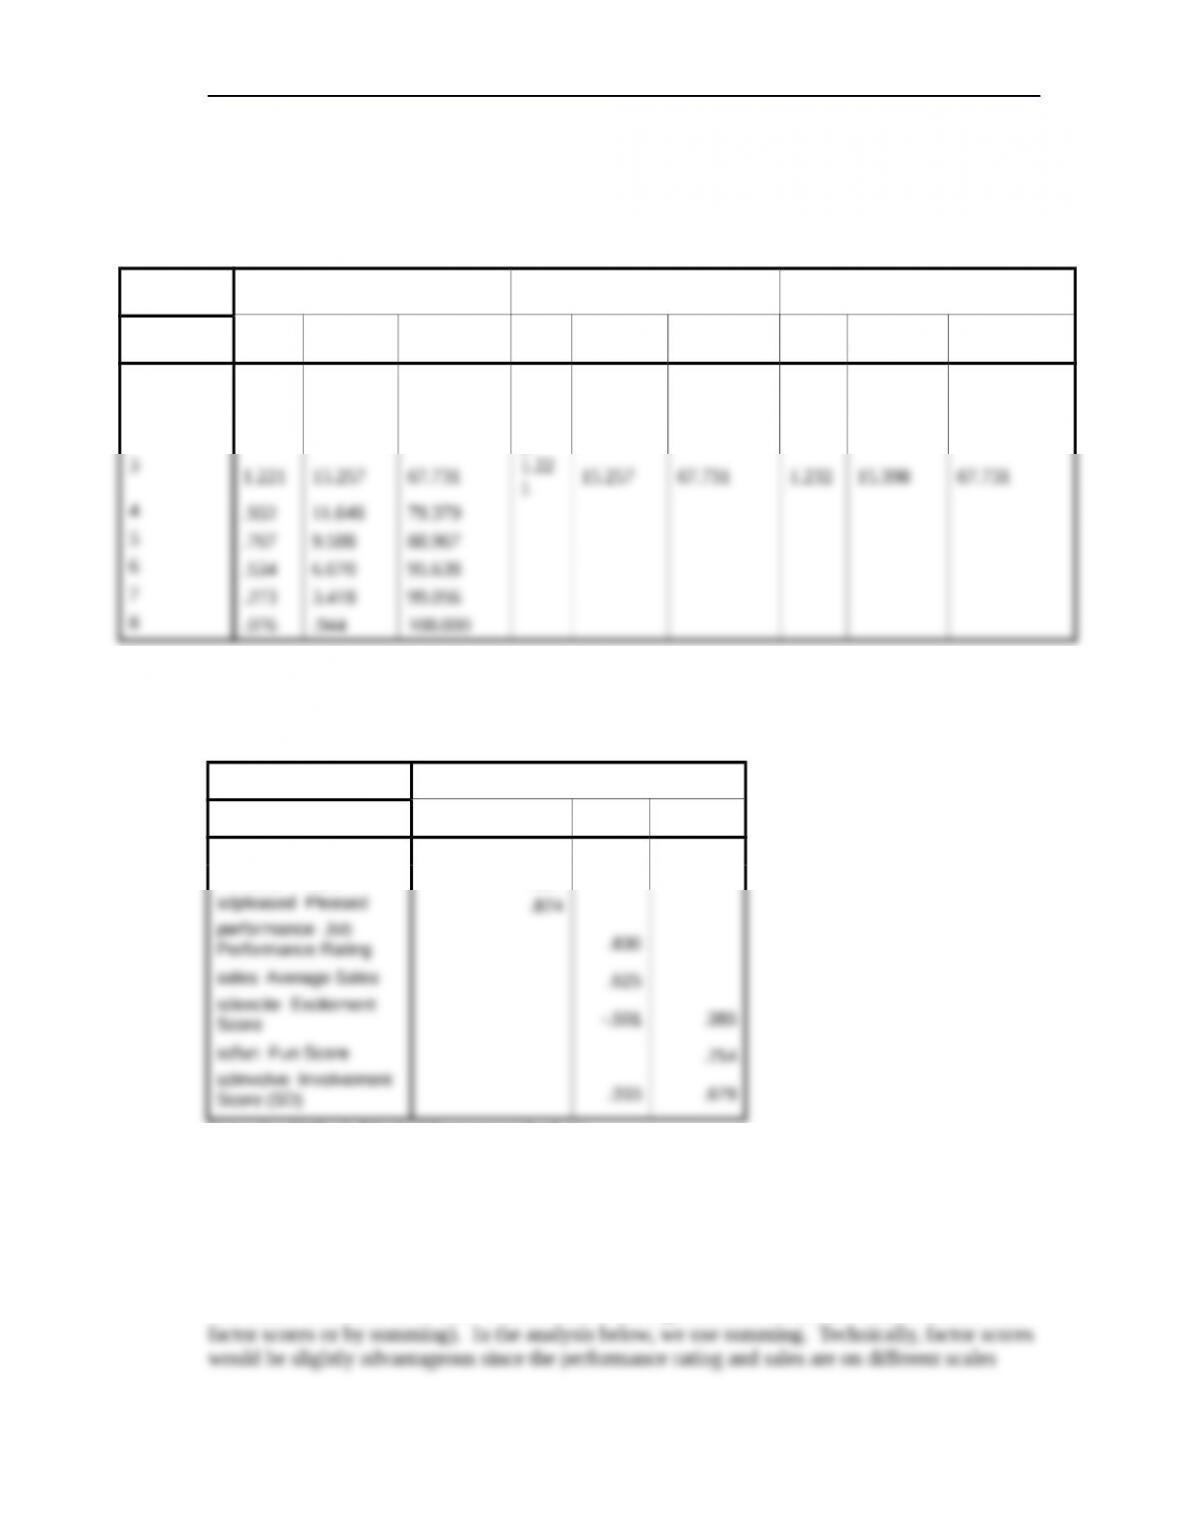
Total Variance Explained
Component Initial Eigenvalues
Extraction Sums of Squared
Loadings
Rotation Sums of Squared
Loadings
Total
% of
Variance
Cumulative
% Total
% of
Variance
Cumulative
% Total
% of
Variance
Cumulative
%
12.706 33.823 33.823 2.70
633.823 33.823 2.702 33.772 33.772
21.492 18.651 52.474 1.49
218.651 52.474 1.485 18.561 52.333
Extraction Method: Principal Component Analysis.
Rotated Component Matrix(a)
Component
Positive Emotion Result Arousal
sdsatisfied Satisfied .970
sdhappy Happy .917
Extraction Method: Principal Component Analysis.
Rotation Method: Varimax with Kaiser Normalization.
a Rotation converged in 5 iterations.
2. Create scales for any underlying dimensions.
Notice that in the component matrix above, the factors have been interpreted and provided names.
The scales that result from these will be used in the regression model (scales can be created with
© 2013 Cengage Learning. All Rights Reserved. May not be scanned, copied or
duplicated, or posted to a publicly accessible website, in whole or in part.

Chapter Twenty-four: Multivariate Statistical Analysis 405
Reliability – only the most advanced students will realize that a coefficient alpha should be
computed for the Positive Affect Score, and the result is given below. Technically, coefficient
© 2013 Cengage Learning. All Rights Reserved. May not be scanned, copied or
duplicated, or posted to a publicly accessible website, in whole or in part.
Chapter Twenty-four: Multivariate Statistical Analysis 406
Reliability Statistics
Cronbach’s
Alpha N of Items
.918 3
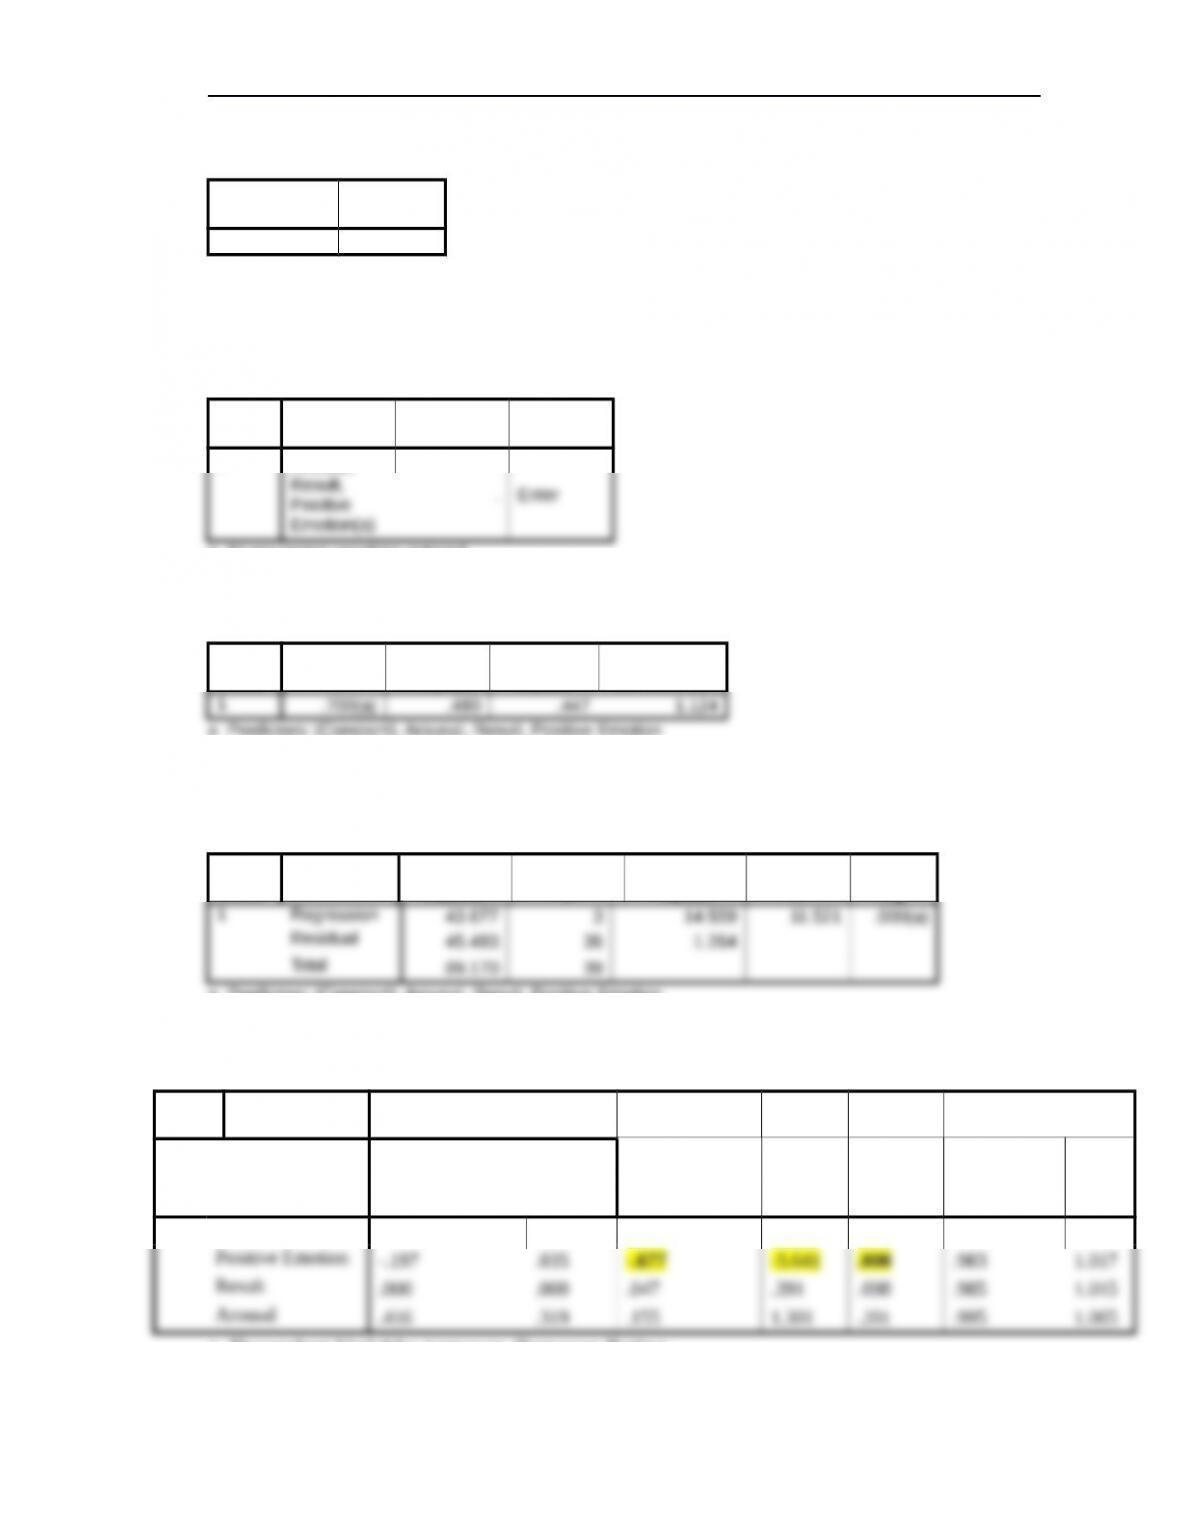
3. Use these scales as independent variables in a regression model.
Variables Entered/Removed(b)
Model
Variables
Entered
Variables
Removed Method
1Arousal,
Positive
Emotion(a)
a All requested variables entered.
b Dependent Variable: turnover Turnover Rating
Model Summary
Model R R Square
Adjusted R
Square
Std. Error of
the Estimate
a Predictors: (Constant), Arousal, Result, Positive Emotion
ANOVA(b)
Model
Sum of
Squares df
Mean
Square F Sig.
a Predictors: (Constant), Arousal, Result, Positive Emotion
b Dependent Variable: turnover Turnover Rating
Coefficients(a)
Model Unstandardized Coefficients
Standardized
Coefficients t Sig. Collinearity Statistics
B Std. Error Beta t-value p-value
Tolerance VIF
1 (Constant) 1.351 4.703 .287 .776
a Dependent Variable: turnover Turnover Rating
© 2013 Cengage Learning. All Rights Reserved. May not be scanned, copied or
duplicated, or posted to a publicly accessible website, in whole or in part.

Chapter Twenty-four: Multivariate Statistical Analysis 407
4. Interpret the results.
In contrast to the research snapshot result, the regression result here is very clean. The overall
model is significant and explains 49% of the variance in turnover. There is one significant Beta
© 2013 Cengage Learning. All Rights Reserved. May not be scanned, copied or
duplicated, or posted to a publicly accessible website, in whole or in part.