QUESTIONS FOR REVIEW AND CRITICAL THINKING/ANSWERS
1. What is covariance?
2. How are covariance and correlation different?
3. How does a researcher determine if a correlation coefficient is significant?
The procedure for determining statistical significance is the t-test. Typically it is hypothesized
4. The management of a regional bus line thought the company’s cost of gas might be correlated
with its passenger/mile ratio. The data and a correlation matrix follow (see the text for this
information). Comment.
The correlation matrix shows that the average price of gas and passenger-miles are highly
5. Interpret the following data:
a.
1
30.0.5
ˆXY
Where the dependent variable equals turnover intentions for line
units.
b.
1
0.4250 XY
[Internet Question] Where the dependent variable is the number of
hits on a new banner ad and the independent variable is the number of
weeks the ad has run.
For each additional week an ad runs, the number of hits is reduced by four.
379
© 2013 Cengage Learning. All Rights Reserved. May not be scanned, copied or
duplicated, or posted to a publicly accessible website, in whole or in part.
Chapter Twenty-Three: Bivariate Statistical Analysis: Measures of Association 380
6. What are some different terms used to refer to the slope coefficient estimated in regression
analysis?
An estimated slope coefficient is sometimes referred to as a regression weight, regression
7. The following ANOVA summary table is the result of a regression of sales on year of sales.
Is the relationship statistically significant at the 0.95 significance level? Fill in the value for
Sums of Squares in the SST row. Comment. (See textbook for the summary table.)
No, this relationship is not significant at the 0.95 significance level because the p-value is 0.115,
8. Address the following questions about regression analysis:
a. Define simple linear regression.
Regression analysis is another technique for measuring the linear association between a
dependent and an independent variable. Although simple regression and correlation are
b. When it is most appropriate to rely on raw parameter coefficients and when is it
most appropriate to rely on standardized parameter coefficients?
Raw regression weights have the advantage of retaining the scale metric. If the purpose of the
regression analysis is forecasting, then raw parameter estimates must be used. This is another
c. Why is the Y-intercept estimate equal to 0 for standardized estimates?
A standardized regression coefficient provides a common metric allowing regression results to be
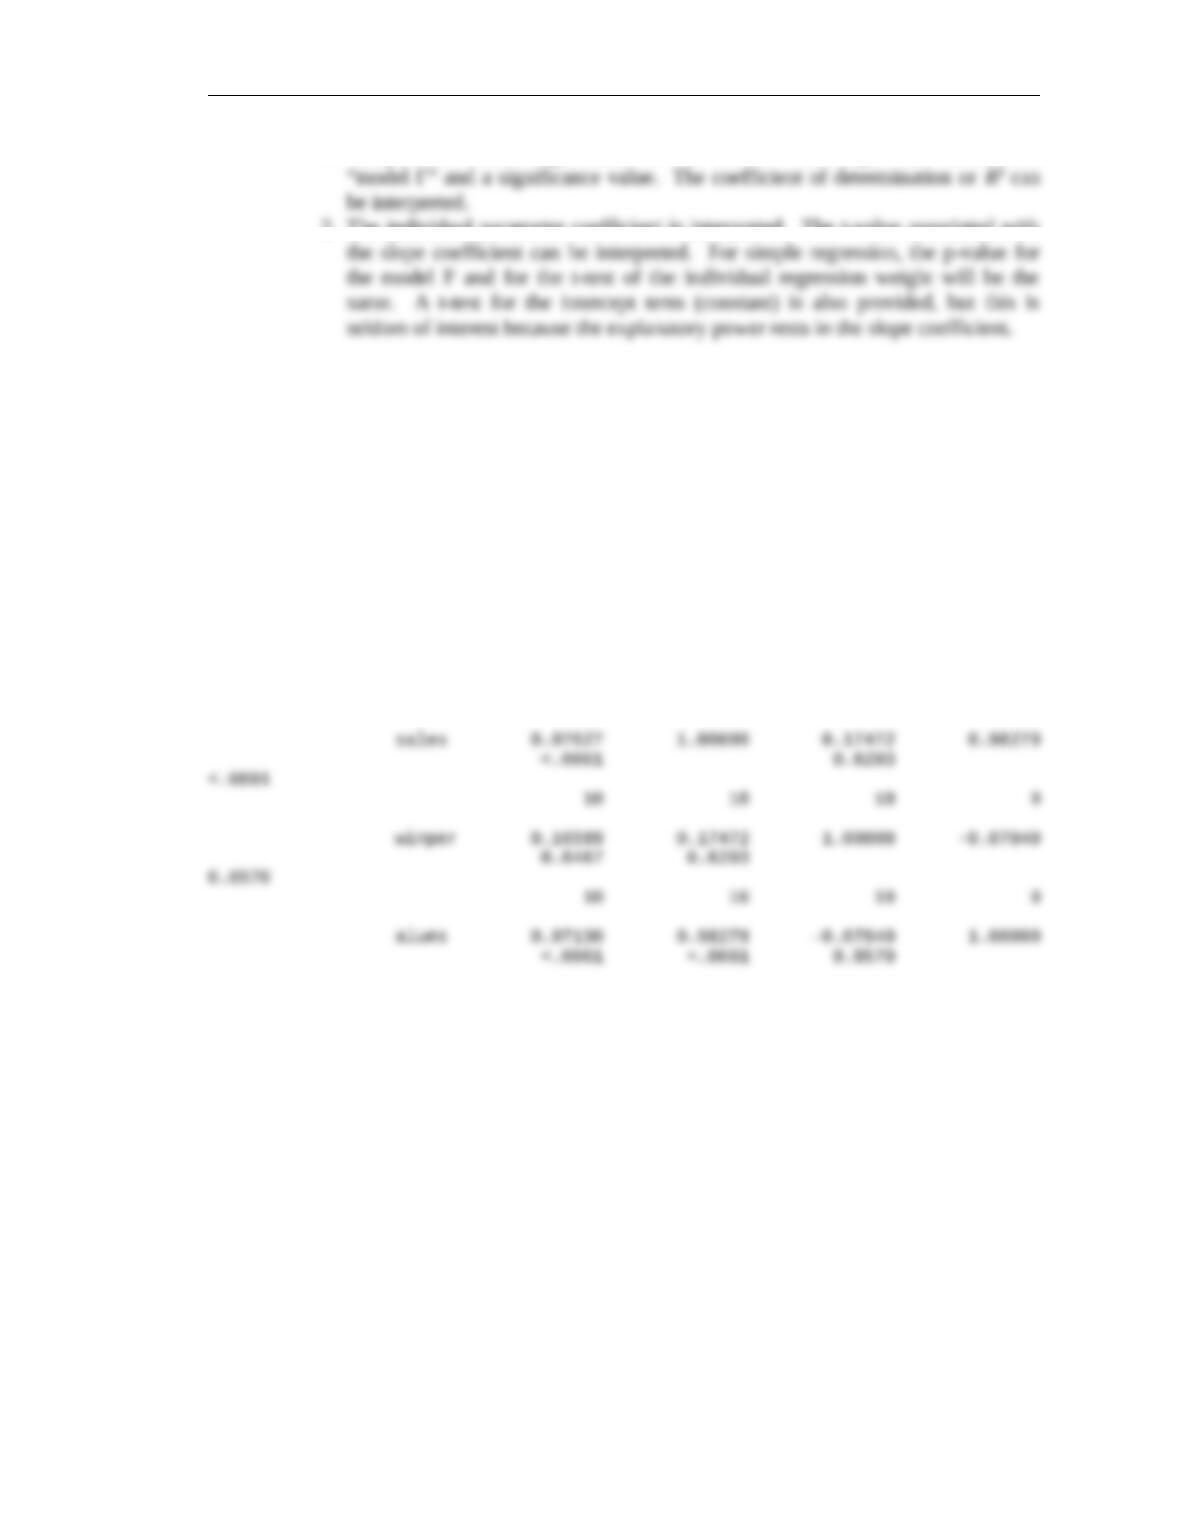
d. What are the steps in interpreting a regression model?
© 2013 Cengage Learning. All Rights Reserved. May not be scanned, copied or
duplicated, or posted to a publicly accessible website, in whole or in part.
Chapter Twenty-Three: Bivariate Statistical Analysis: Measures of Association 381
1. Interpret the overall significance of the model. The output will include the
2. The individual parameter coefficient is interpreted. The t-value associated with
9. The following table gives a football team’s season-ticket sales, percentage of games won, and
number of active alumni for the years 2002-2011 (see text for the data).
a. Compute a correlation matrix for the variables. A software statistical package is
recommended. Interpret the correlation between each pair of variables.
Pearson Correlation Coefficients
Prob > |r| under H0: Rho=0
Number of Observations
year sales winper alums
year 1.00000 0.97627 0.16599 0.97130
<.0001 0.6467
<.0001
10 10 10 9
© 2013 Cengage Learning. All Rights Reserved. May not be scanned, copied or
duplicated, or posted to a publicly accessible website, in whole or in part.
Chapter Twenty-Three: Bivariate Statistical Analysis: Measures of Association 382
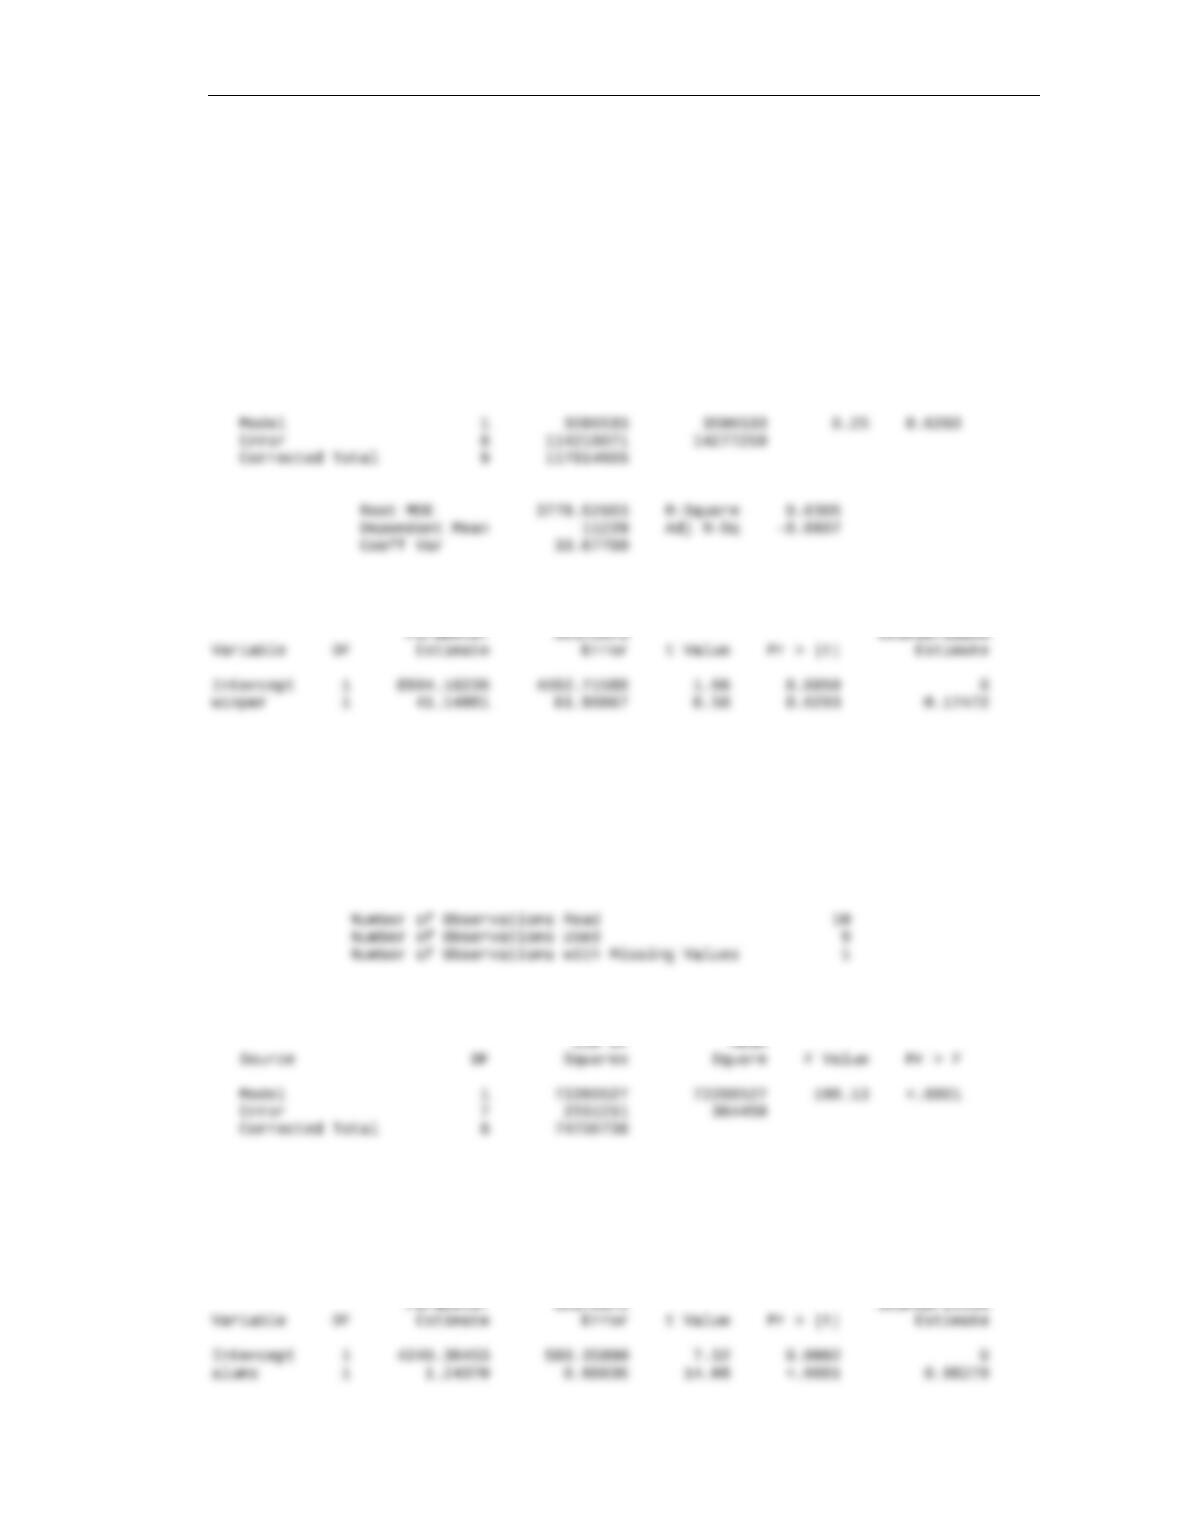
b. Estimate a regression model for sales = Percentage of games won.
The REG Procedure
Model: MODEL1
Dependent Variable: sales
Number of Observations Read 10
Number of Observations Used 10
Analysis of Variance
Sum of Mean
Source DF Squares Square F Value Pr > F
Parameter Estimates
Parameter Standard Standardized
c. Estimate a regression model for sales = Number of active alumni.
Model: MODEL1
Dependent Variable: sales
Analysis of Variance
Sum of Mean
Root MSE 603.70421 R-Square 0.9659
Dependent Mean 11912 Adj R-Sq 0.9610
Coeff Var 5.06822
Parameter Estimates
Parameter Standard Standardized
© 2013 Cengage Learning. All Rights Reserved. May not be scanned, copied or
duplicated, or posted to a publicly accessible website, in whole or in part.
Chapter Twenty-Three: Bivariate Statistical Analysis: Measures of Association 383
d. If sales is the dependent variable, which of the two independent variables do you
think explains sales better? Explain.
The regression model predicting sales with percentage of games won is not significant, but the
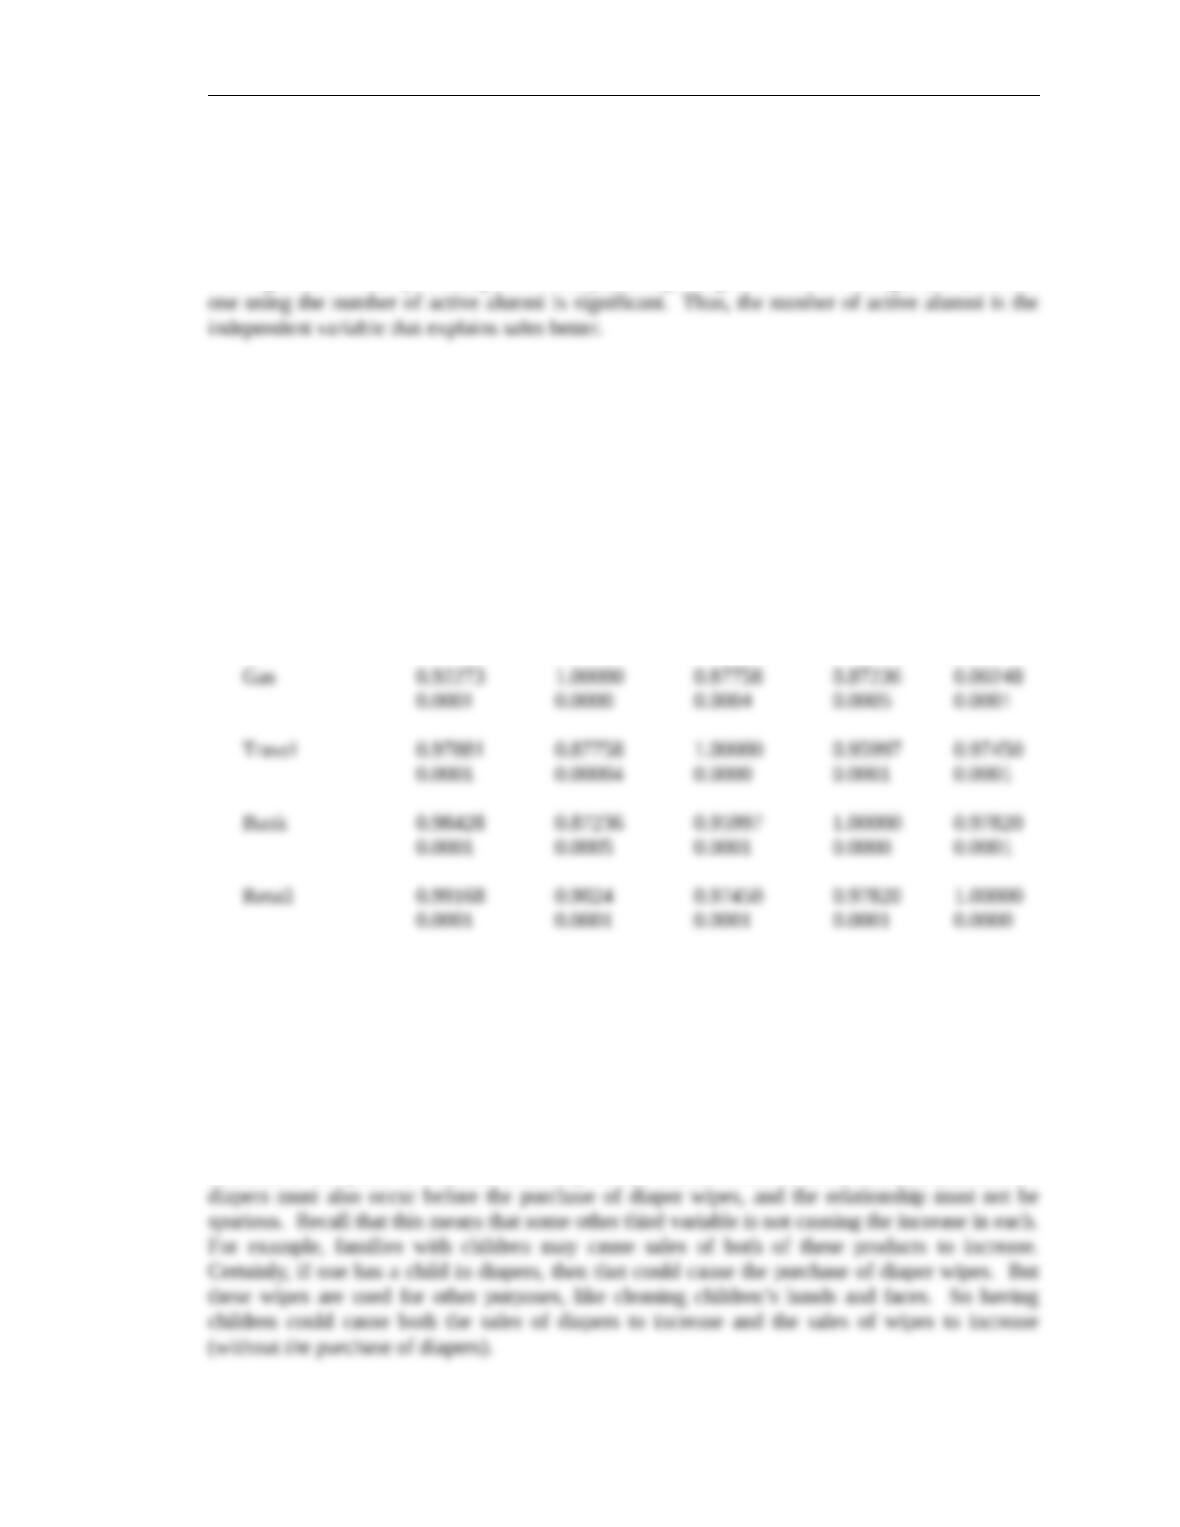
10. Are the different forms of consumer installment credit in the following table highly
correlated? (See the textbook for the data.)
The computer output that follows indicates that these different forms of consumer installment
credit are highly intercorrelated:
CORRELATION COEFFICIENTS / PROB . R UNDER H0:RHO=0 / H = 11
Year Gas Travel Bank Retail
Year 1.00000 0.92273 0.97881 0.98428 0.09168
0.0000 0.0001 0.0001 0.0001 0.0001
11. A manufacturer of disposable washcloths/wipes told a retailer that sales for this product
category closely correlate with the sales of disposable diapers. The retailer thought he
would check this out for his own sales-forecasting purposes. The researchers says,
“Disposable washcloths/wipes sales can be predicted with knowledge of disposable diaper
sales.” Is this the right thing to say?
The basic rule in correlation is “Correlation does not mean causation.” Just because two variables
are correlated in the past does not mean that they will correlate in the future. While concomitant
variation is one piece of evidence necessary for the causation that is stated here, the purchase of
© 2013 Cengage Learning. All Rights Reserved. May not be scanned, copied or
duplicated, or posted to a publicly accessible website, in whole or in part.
Chapter Twenty-Three: Bivariate Statistical Analysis: Measures of Association 384
12. Explain how OLS determines where a regression line should be placed among a plot of
observations.
The procedure used in the least-squares method generates a straight line that minimizes the sum
of squared deviations of the actual values from this predicted regression line. With the symbol e
RESEARCH ACTIVITIES
1. [Internet Question] The Federal Reserve Bank of St. Louis maintains a database called FRED
(Federal Reserve Economic Data). Navigate to the FRED database at
http://www.stls.frb.org/fred/index.html. Randomly select a five year period between 1990
and 2010 and then find the correlation between average U.S. employment in retail trade and
U.S. employment in wholesale trade. What statistical test is appropriate?
2. [Internet Question/Ethics Question] Go to http://www.transparency.org. Find the corruption
perception indices for 2010. Go to http://www.geert-hofstede.com/hofstede_dimensions.php.
Create a data set that includes the corruption perception indices for at least fifteen countries
and the score for one of the Hofstede cultural value dimensions. Conduct a regression and
interpret the relationship between cultural values and corruption perceptions.
Students’ results will vary depending on the countries and cultural value dimension chosen.
1. Interpret the overall significance of the model. The output will include the
2. The individual parameter coefficient is interpreted. The t-value associated with
the slope coefficient can be interpreted. For simple regression, the p-value for
CASE 23.1 : International Operations at CarCare Inc.
[Note: This data set can be found in the files labeled car.sav or car.xls.]
Objective: This case allows students to practice running correlation and regression analyses.
Summary: CarCare is considering expanding its operations to other countries. The company
wants to know whether it should target countries with consumers who tend to have a positive
© 2013 Cengage Learning. All Rights Reserved. May not be scanned, copied or
duplicated, or posted to a publicly accessible website, in whole or in part.
Chapter Twenty-Three: Bivariate Statistical Analysis: Measures of Association 385
attitude toward their current cars. Students are asked to conduct analyses on the data gathered on
U.S. and German car owners.
Questions
1. Test the following hypothesis: Attitude toward one’s car is related positively to spending for
car-care products.
A regression model using spending as the dependent variable and attitude toward the current car
2. Would you recommend CarCare do more research to identify nations with relatively
favorable attitudes toward the cars they own?
An independent samples t-test for attitudes toward the current car using country as the grouping
© 2013 Cengage Learning. All Rights Reserved. May not be scanned, copied or
duplicated, or posted to a publicly accessible website, in whole or in part.