QUESTIONS FOR REVIEW AND CRITICAL THINKING/ANSWERS
1. What are five descriptive statistics used to describe the basic properties of variables?
2. What is a histogram? What is the advantage of overlaying a normal distribution over a
histogram?
A histogram is a graphical way of showing a frequency distribution in which the height of a bar
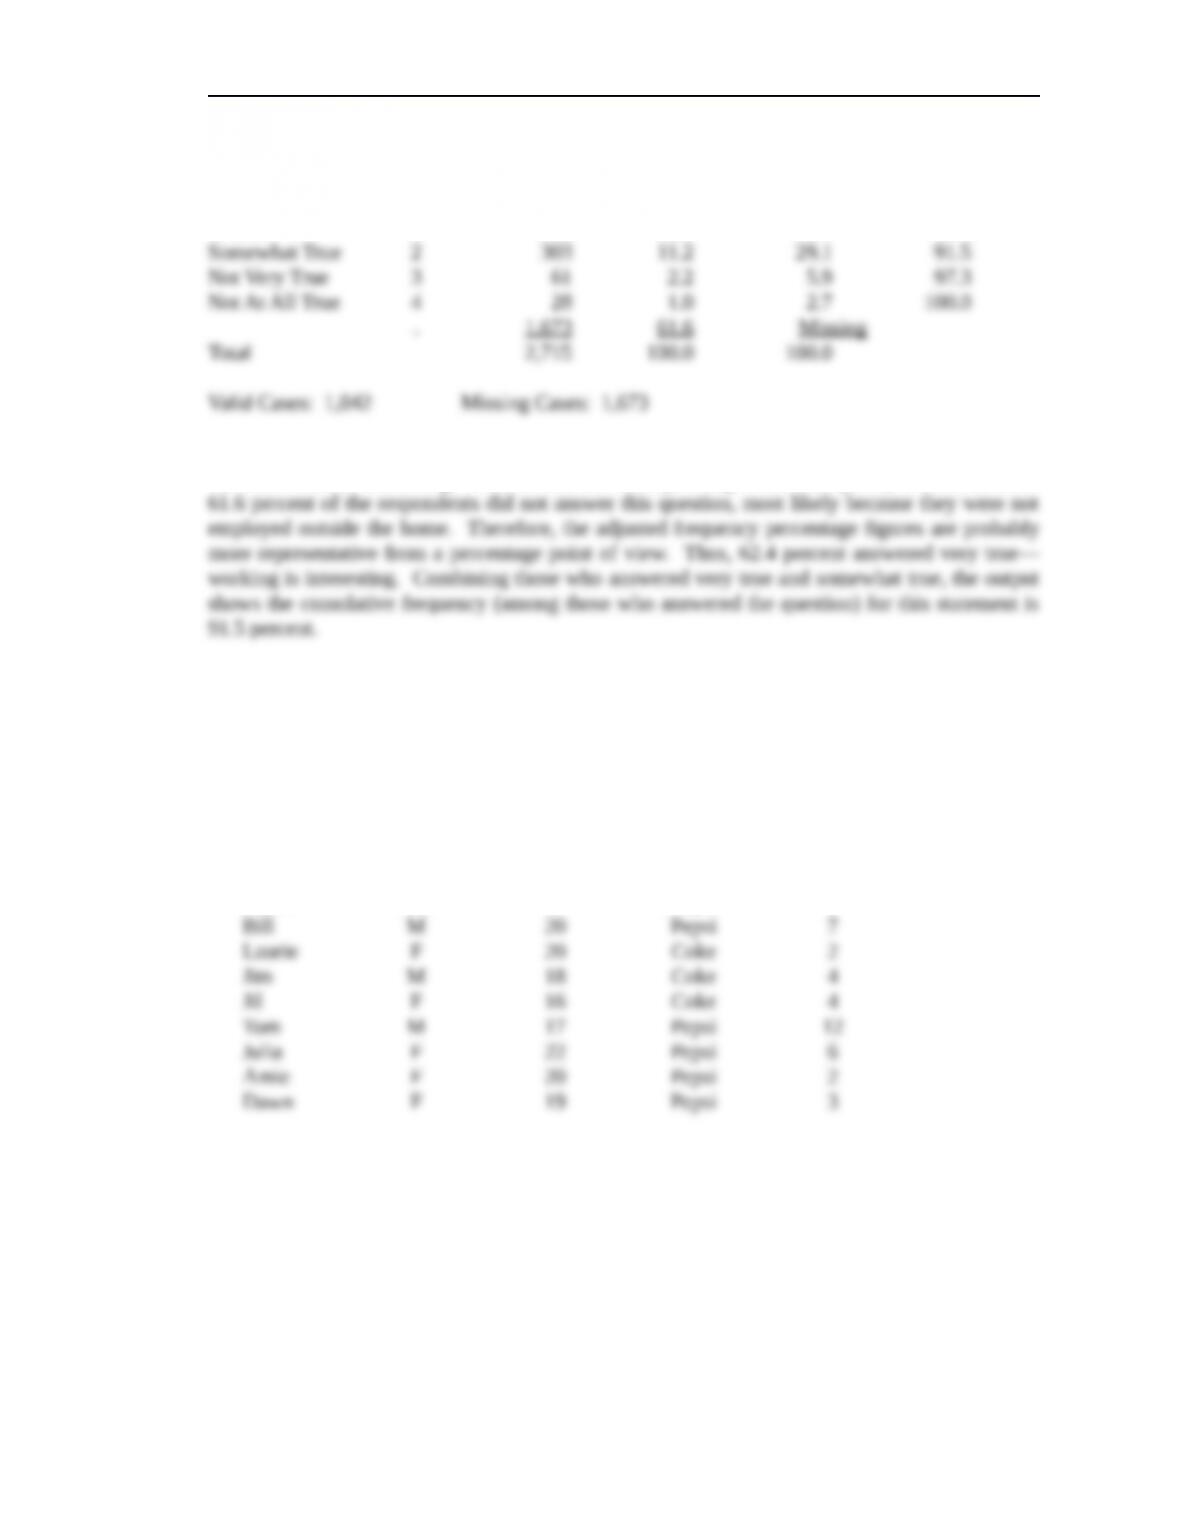
3. A survey asks respondents to respond to the statement “My work is interesting.” Interpret the
frequency distribution shown (taken from an SPSS output):
a. My work is interesting:
325
© 2013 Cengage Learning. All Rights Reserved. May not be scanned, copied or
duplicated, or posted to a publicly accessible website, in whole or in part.
Chapter Twenty: Basic Data Analysis: Descriptive Statistics 326
Relative Adjusted CUM
Absolute Freq Freq Freq
Category Label Code Freq (PCT) (PCT) (PCT)
V True 1 650 23.9 62.4 62.4
This table shows that 650 of the respondents in a survey of 2,715 responded that it was very true
that their work is interesting. The dot and the corresponding relative frequency column indicate
4. Use the data in the following frequency table to:
a. Prepare a frequency distribution of the respondents’ ages
b. Cross-tabulate the respondents’ genders with cola preference
c. Identify any outliers
Weekly
Cola Unit
Individual Sex Age Preference Purchases
James M 19 Coke 2
Parker M 17 Pepsi 5
© 2013 Cengage Learning. All Rights Reserved. May not be scanned, copied or
duplicated, or posted to a publicly accessible website, in whole or in part.
Chapter Twenty: Basic Data Analysis: Descriptive Statistics 327
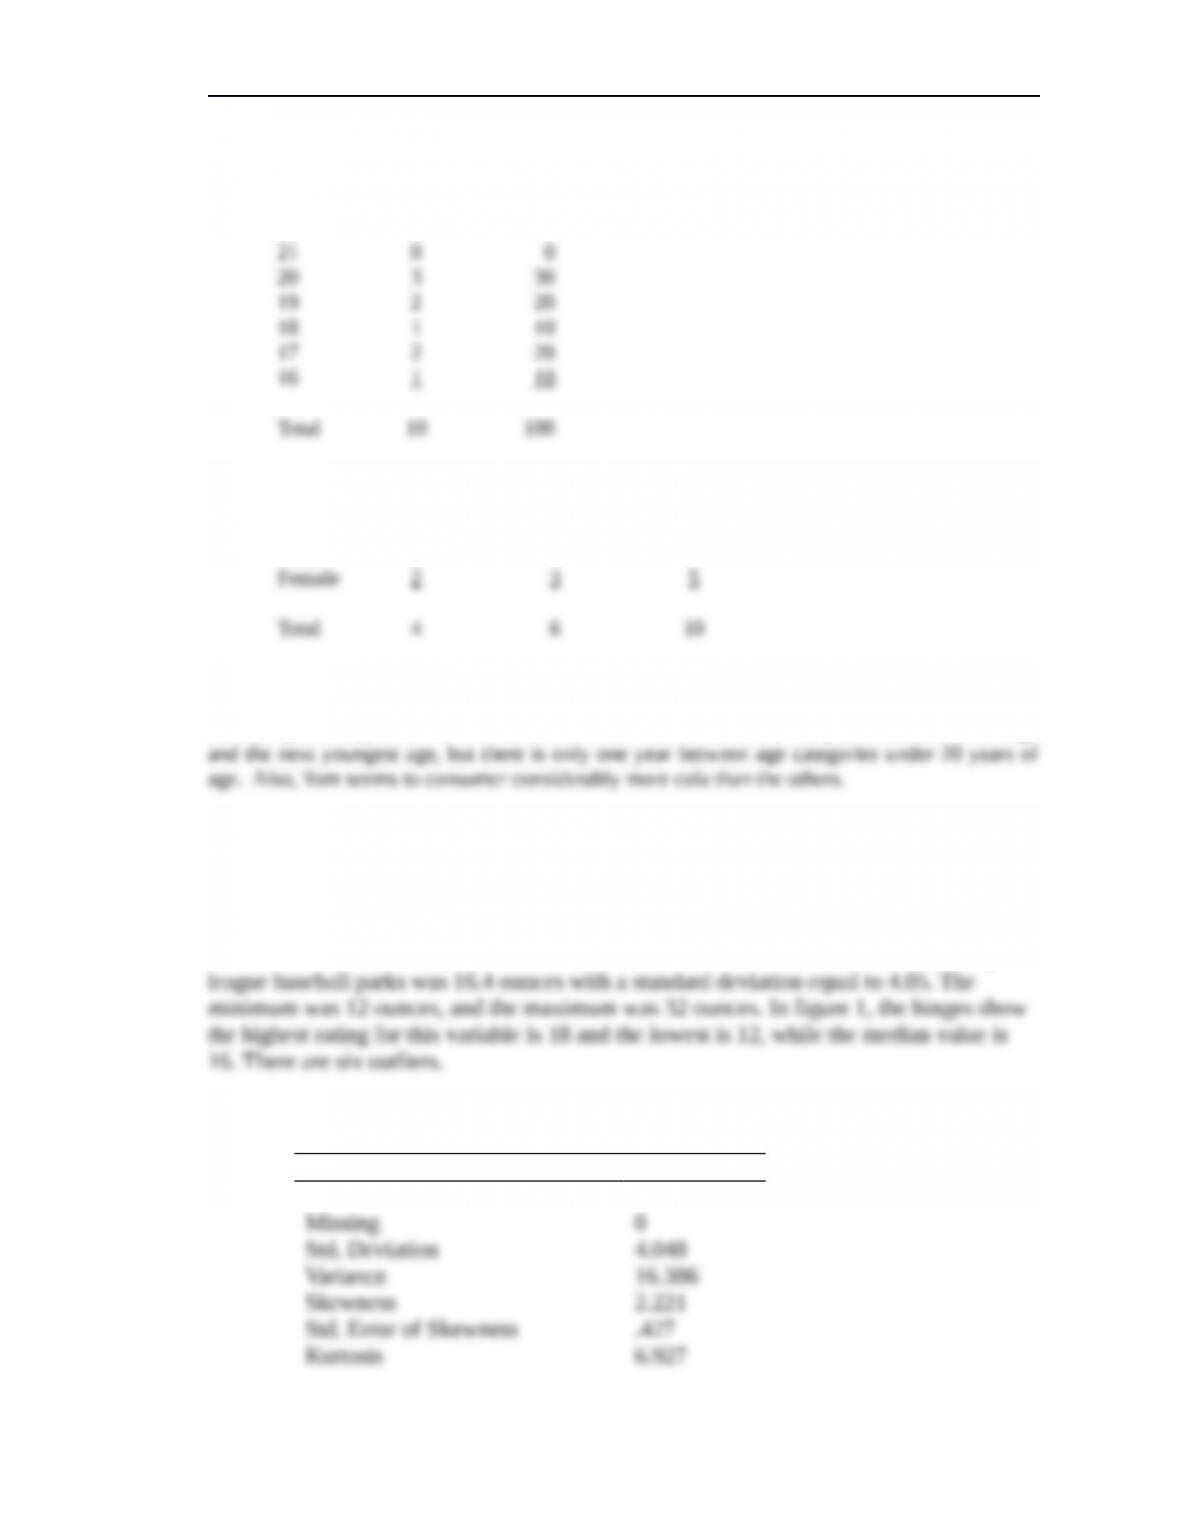
a. Prepare a frequency distribution of the respondents’ ages.
Age Number Percent
22 1 10
b. Cross-tabulate the respondents’ sex with cola preference.
Coke Pepsi Total
Male 2 3 5
c. Identify any outliers.
Julia (22 years old) could be considered an outlier because there are two years between Julia’s age
5. Data for the average size of a soda (in ounces) at all 30 major league baseball parks are as
follows: 14, 18, 20, 16, 16, 12, 14, 16, 14, 16, 16, 16, 14, 32, 16, 20, 12, 16, 20, 12, 16, 16,
24, 16, 16, 14, 14, 12, 14, 20. Compute descriptive statistics for this variable including a box
and whisker plot. Comment on the results.
As shown below, the results indicate that the mean score of soda ounces at all 30 major
Table1. Descriptives
Ounces
Valid N 30
© 2013 Cengage Learning. All Rights Reserved. May not be scanned, copied or
duplicated, or posted to a publicly accessible website, in whole or in part.
Chapter Twenty: Basic Data Analysis: Descriptive Statistics 328
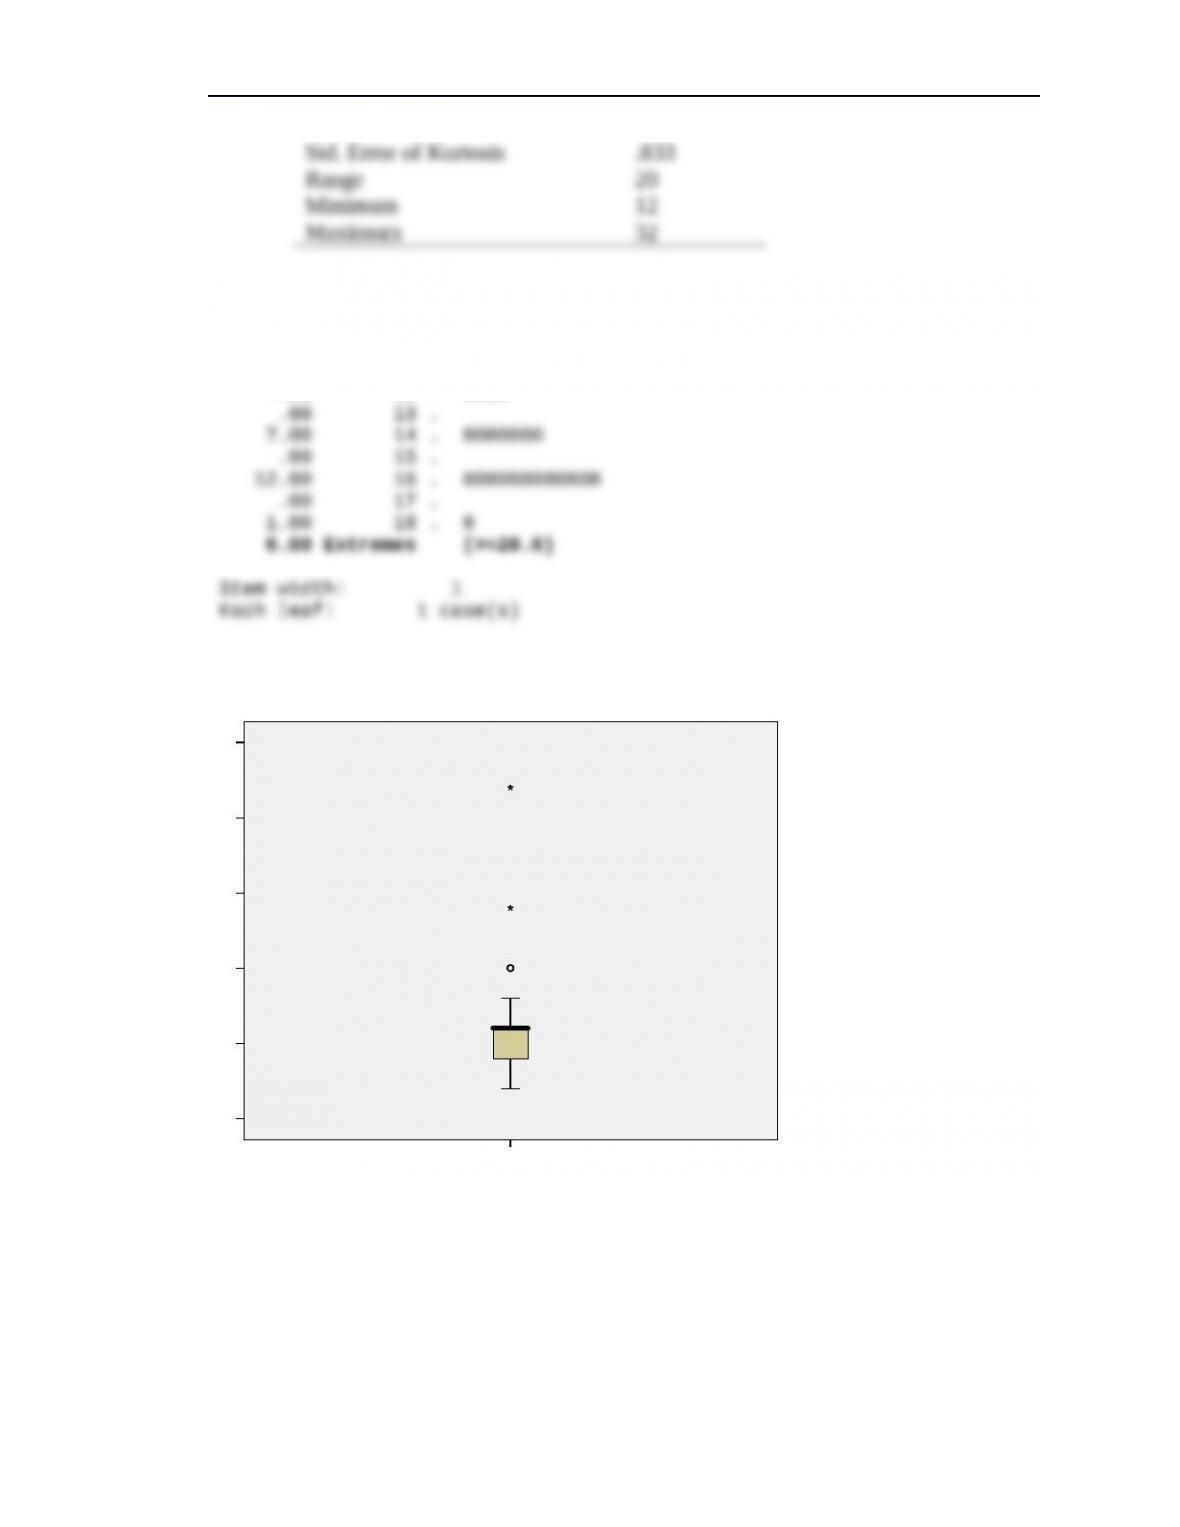
Figure 1 Stem-and-Leaf Plot for Ounces
Frequency Stem & Leaf
4.00 12 . 0000
Figure 2. Box and Whiskers Plot
ounces
35
30
25
20
15
10
3
14
23
© 2013 Cengage Learning. All Rights Reserved. May not be scanned, copied or
duplicated, or posted to a publicly accessible website, in whole or in part.
Chapter Twenty: Basic Data Analysis: Descriptive Statistics 329
6. The following computer output (see textbook) shows a cross-tabulation of frequencies and
provides frequency number (N) and row (R) percentages.
a. Interpret this output including a conclusion about whether or not the row and
column variables are related.
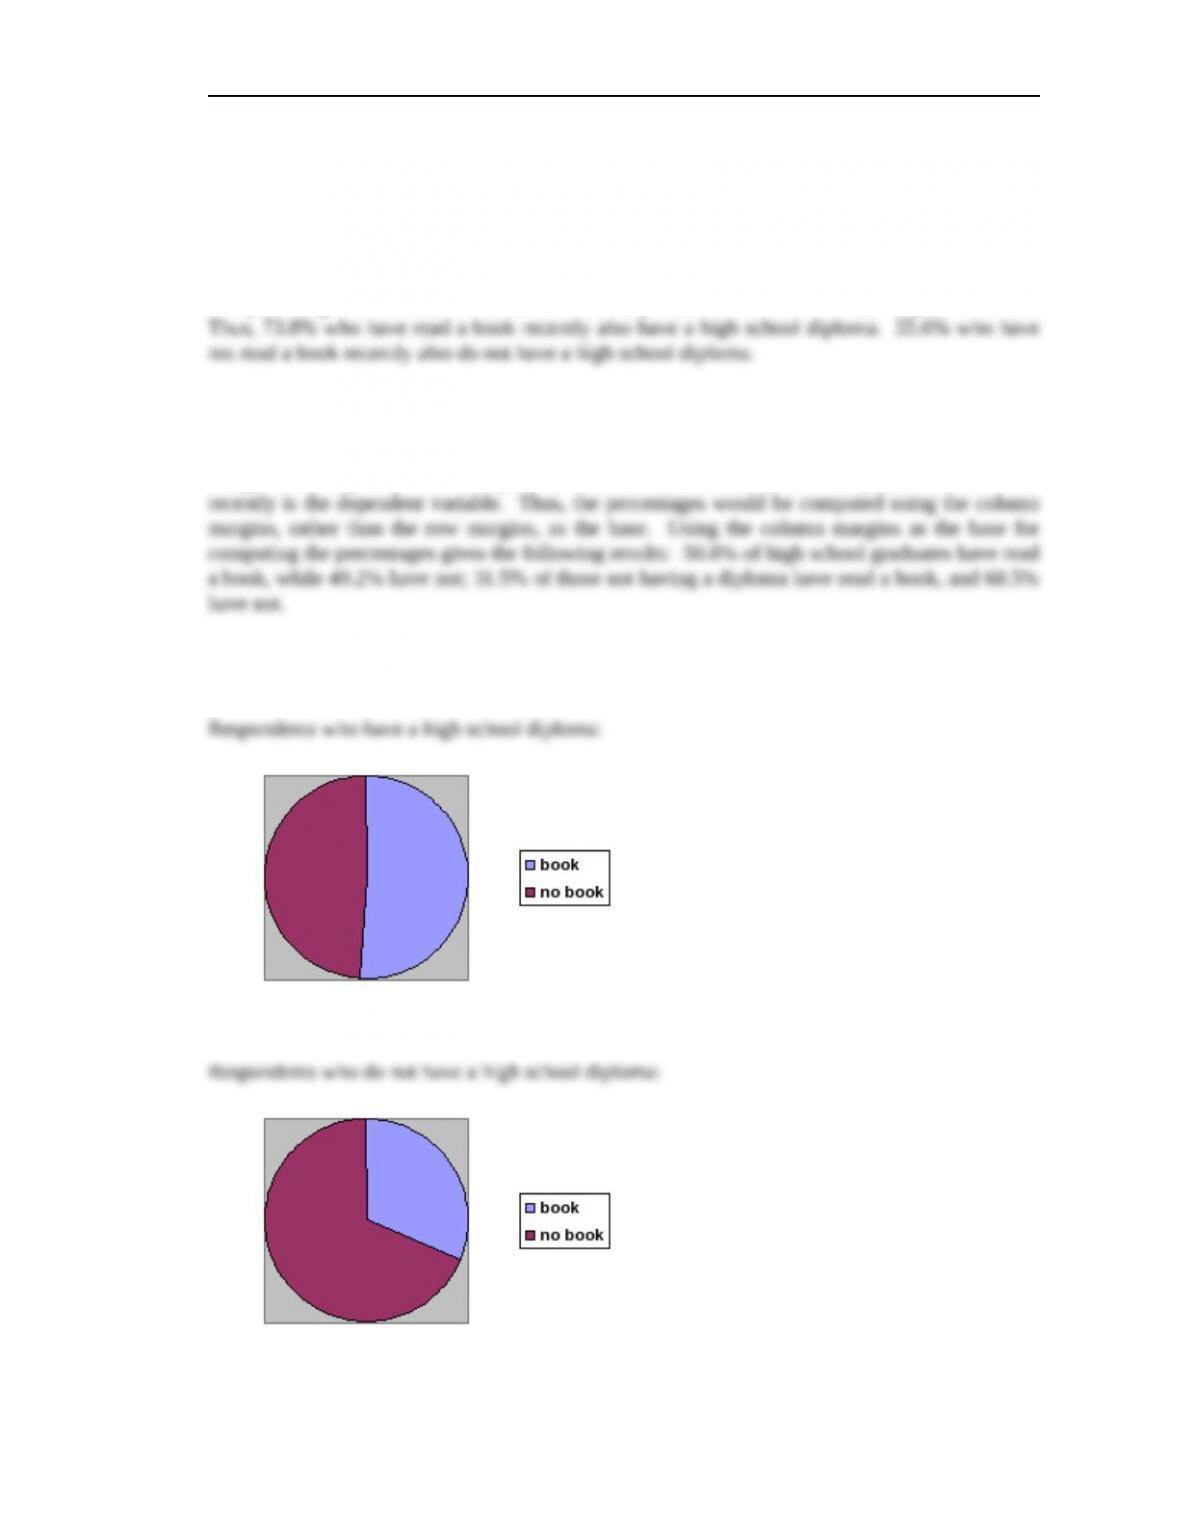
The percentages are based on whether or not a respondent has read a book in the past 3 months.
b. Critique the way the analysis is presented.
The row margins are used as the base for computing percentages. However, it seems that having
a high school diploma is the independent variable and whether or not a respondent read a book
c. Draw a pie chart indicating percentages for having read a book in the past three
month for those with and those without high school diplomas.
© 2013 Cengage Learning. All Rights Reserved. May not be scanned, copied or
duplicated, or posted to a publicly accessible website, in whole or in part.
Chapter Twenty: Basic Data Analysis: Descriptive Statistics 330
7. List and describe at least three basic data transformations.
Data transformation is the process of changing the data from their original form to a format
8. What conditions suggest that a ratio variable should be transformed (recoded) into a
dichotomous (two group) variable?
Researchers often perform a median split to collapse a scale with multiple response points into
two categories. The median split means respondents below the observed median go into one
9. A data processing analysis for a research supplier finds that preliminary computer runs of
survey results show that consumers love a client’s new product. The employee buys a large
block of the client’s stock. Is this ethical?
RESEARCH ACTIVITIES
1. [Internet Question] Go to the web site for the Chicago Cubs baseball team
(http://chicago.cubs.mlb.com). Use either the schedule listing or the stats information to
find their record in the most recent season. Create a data file with a variable indicating
whether each game was won or lost and a variable indicating whether the game was played
at home in Wrigley Field or away from home. Using computerized software like SPSS or
SAS,
a. Compute a frequency table and histogram for each variable.
b. Use cross-tabulations to examine whether a relationship exists between where the
game is played (home or away) and winning.
c. Extra Analysis: Repeat the analyses for the Houston Astros baseball team
(http://www.astros.com). What does this suggest for the relationship between
playing at home and winning?
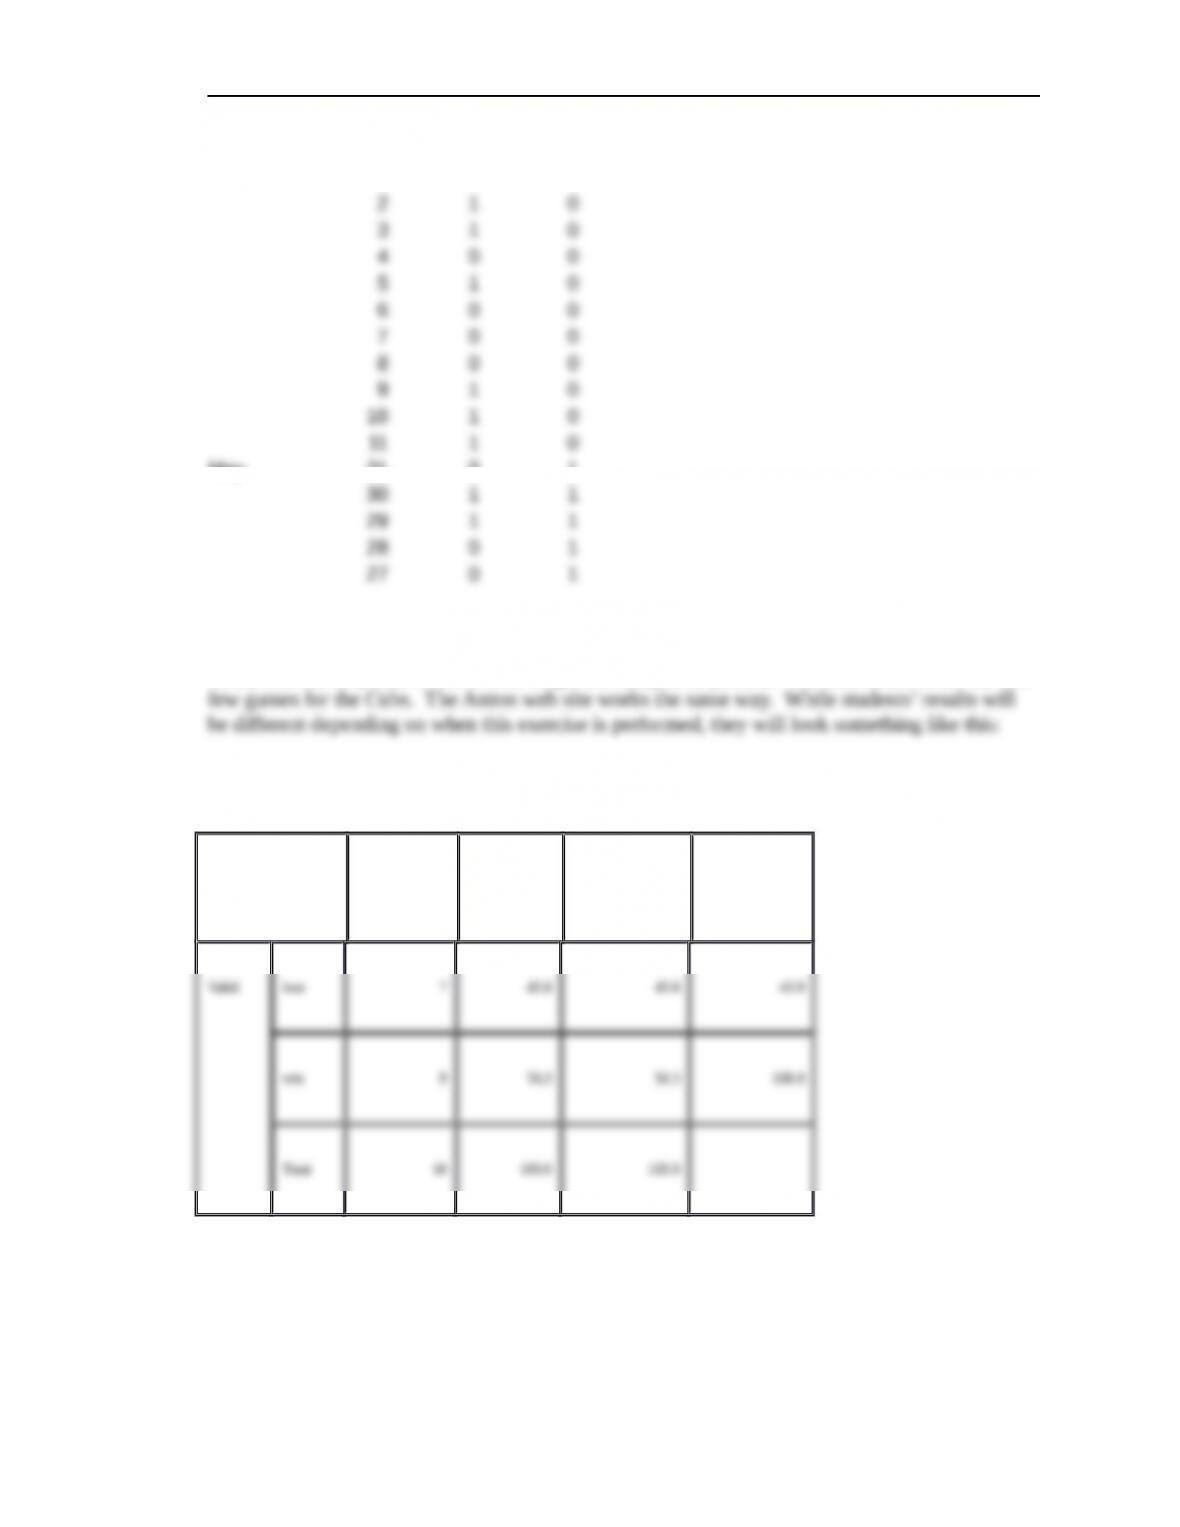
All the student has to do is create a data set like this which can easily be obtained from the
websites by clicking on the schedule that appears or “full schedule.” This data is from a few
games in the 2006 season and is for illustration purposes only—students’ data will be different:
© 2013 Cengage Learning. All Rights Reserved. May not be scanned, copied or
duplicated, or posted to a publicly accessible website, in whole or in part.
Chapter Twenty: Basic Data Analysis: Descriptive Statistics 331
day win/loss home/away
June 1 1 0
May 31 0 1
1 = win 0 = loss; 1 = home 0 = away
Then, this can be put in SPSS or SAS to get the analysis requested. The data above is for the last
win
Frequency Percent Valid Percent
Cumulative
Percent
© 2013 Cengage Learning. All Rights Reserved. May not be scanned, copied or
duplicated, or posted to a publicly accessible website, in whole or in part.

Chapter Twenty: Basic Data Analysis: Descriptive Statistics 332
home * win Crosstabulation
Count
win
Totalloss win
Chi-Square Tests
Value df
Asymp. Sig.
(2-sided)
Exact Sig.
(2-sided)
Exact Sig.
(1-sided)
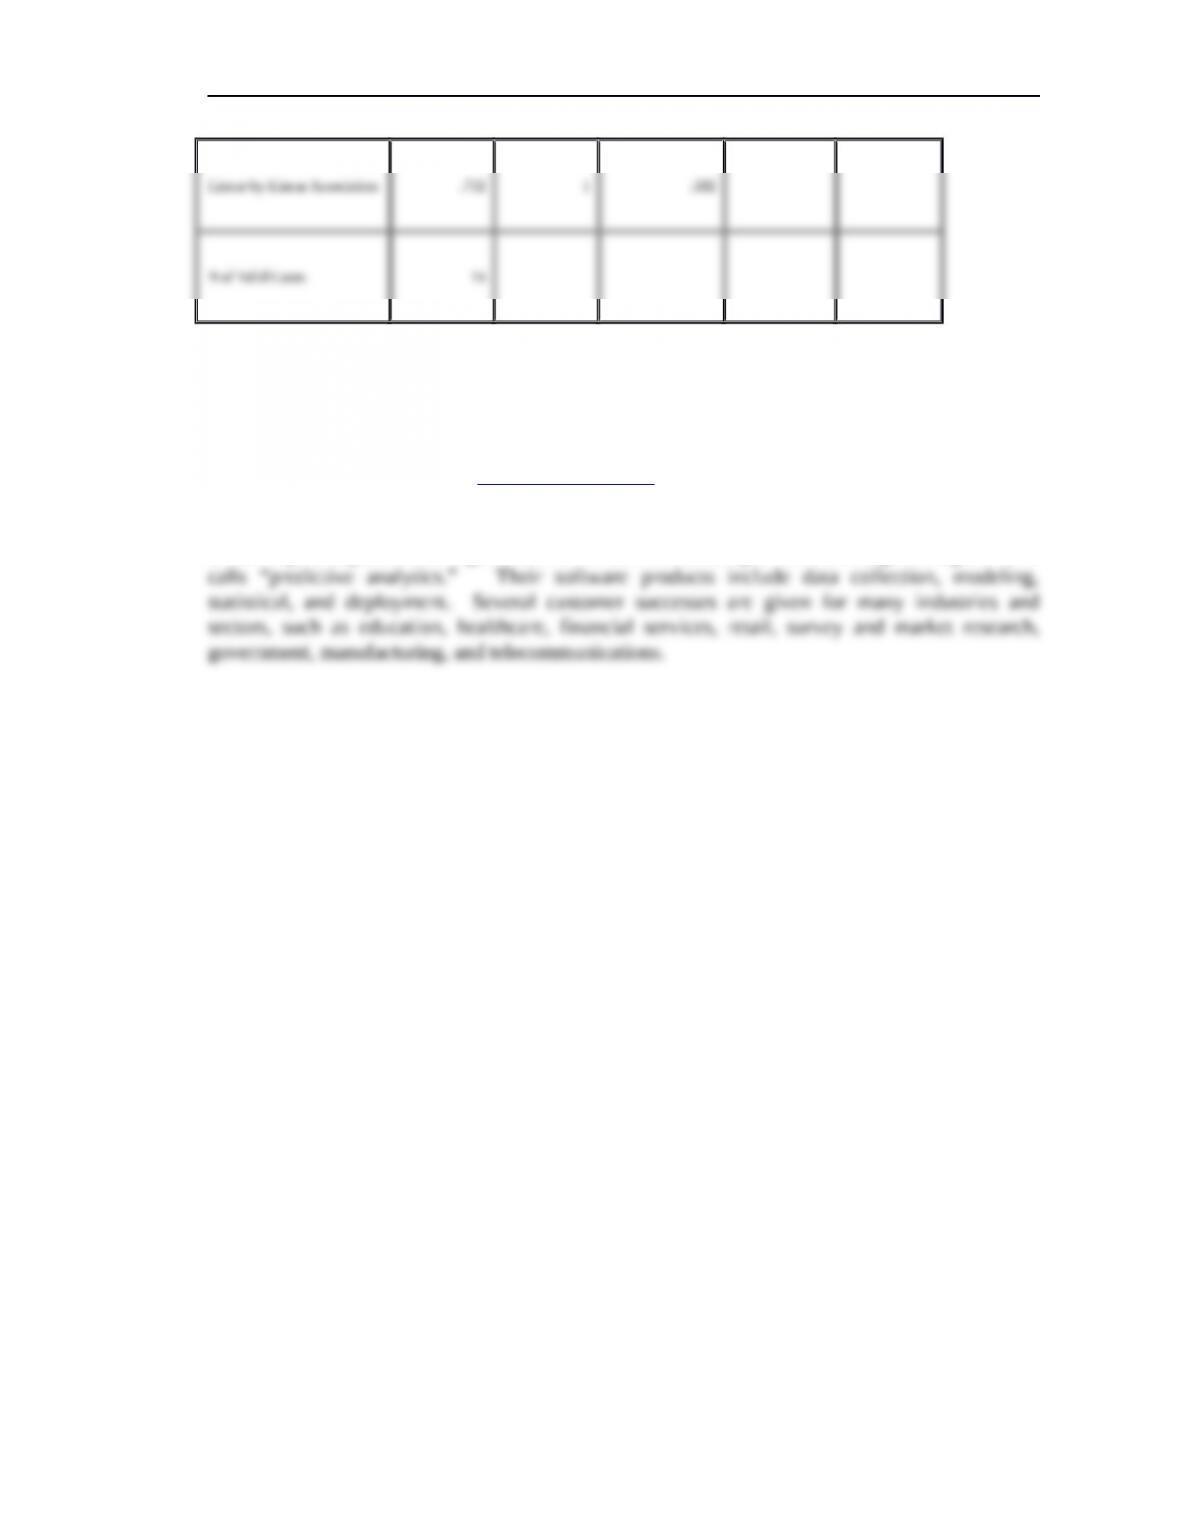
Pearson Chi-Square .780(b) 1 .377
© 2013 Cengage Learning. All Rights Reserved. May not be scanned, copied or
duplicated, or posted to a publicly accessible website, in whole or in part.
Chapter Twenty: Basic Data Analysis: Descriptive Statistics 333
a Computed only for a 2×2 table
b 3 cells (75.0%) have expected count less than 5. The minimum expected count is 2.
2. [Internet Question] Go to http://www.spss.com and click on Solutions, and then select an
industry. What services does the company provide for that particular industry?
SPSS helps companies and organizations find sources of competitive advantage through what it
CASE 20.1 Body on Tap
Objective: The purpose of this case is to allow students to appreciate how data can be
manipulated and presented in a way that could mislead consumers.
Summary: Vidal Sassoon, Inc. took legal action against Bristol-Myers over a series of TV
commercials and print ads for a shampoo that had been named Body on Tap because of its beer
content. The commercial featured a well-known high fashion model saying “In shampoo tests
with over 900 women like me, Body on Tap got higher ratings than Prell for body. Higher than
Flex for conditioning. Higher than Sassoon for strong, healthy-looking hair.” However, 900
women did not make product-by-product comparisons between Body on Tap and any of the other
brands mentioned. Instead, several groups of approximately 200 women each tested just one
shampoo and rated it on a six-step qualitative scale, from “outstanding” to “poor” for 27 separate
attributes (i.e., body and conditioning). The claim that the women preferred Body on Tap to
Sassoon for “strong, healthy-looking hair” was based on combining the data for the “outstanding”
and “excellent” ratings and discarding the lower four ratings on the scale. The figures were 36
percent for Body on Tap and 24 percent (of a separate group of women) for Sassoon, but when
the “very good” and “good” ratings were combined with the ones used, there was only a
difference of 1 percent between the two products on this attribute. The research was conducted
by a professional research firm and used a technique known as blind monadic testing. This
method typically is employed when what is wanted is an absolute response to a product with not
reference to another product. While the results were used in comparative advertising, that was
not the purpose for which Bristol-Myers retained this research firm.
Question
© 2013 Cengage Learning. All Rights Reserved. May not be scanned, copied or
duplicated, or posted to a publicly accessible website, in whole or in part.
Chapter Twenty: Basic Data Analysis: Descriptive Statistics 334
Comment on the professionalism of the procedures used to make the advertising claim. Why do
you believe the researchers performed the data transformations described?
Performing the data transformation described gave the marketer the result desired to make the
claim. However, this research technique, as testified by the president of the research company, is
NOT appropriate for making comparative claims as was done in the advertisements. Thus, this is
clearly a deceptive use of research results.
CASE 20.2 Downy-Q Quilt
Objective: The objective of the case is for the student to interpret the data from this advertising
research. It consists of simple cross-tabulations and frequency distributions.
Summary: The case presents research for Downy-Q that was a commercial test conducted when
an advertising campaign for an established brand had run its course. The revised campaign,
“Fighting a Cold,” emphasized that Downy was an extra warm quilt. The commercial test was
requested to measure the commercial’s ability to generate product interest.
Question
Interpret the data in these tables (see case exhibits). What recommendations and conclusions
would you offer to Downy-Q’s management?
“Fighting the Cold” appears to be a very persuasive commercial, particularly among employed,
married women. It is recommended that this commercial be added to those run for Downy-Q
The overall changes in brand choice were measured, based on responses before the commercial
“Fighting the Cold” scores a +15 prepost increment. This is above the norm for quilt
commercials (+10). The test commercial had a higher prepost among married (+17) than
Respondents were asked to select adjectives to describe the commercial shown. Specific
Respondents were given a list of possible attributes of a quilt and asked to indicate which
© 2013 Cengage Learning. All Rights Reserved. May not be scanned, copied or
duplicated, or posted to a publicly accessible website, in whole or in part.