QUESTIONS FOR REVIEW AND CRITICAL THINKING/ANSWERS
1. What is the difference between descriptive and inferential statistics?
Information is needed to describe phenomena. When data have been collected, tabulation and
2. Speed limits for 13 countries in miles per hour are given (see the text). What is the mean,
median and mode for this data? Feel free to use your computer (statistical software or
spreadsheet) to get the answer.
The mean equals 68.08.
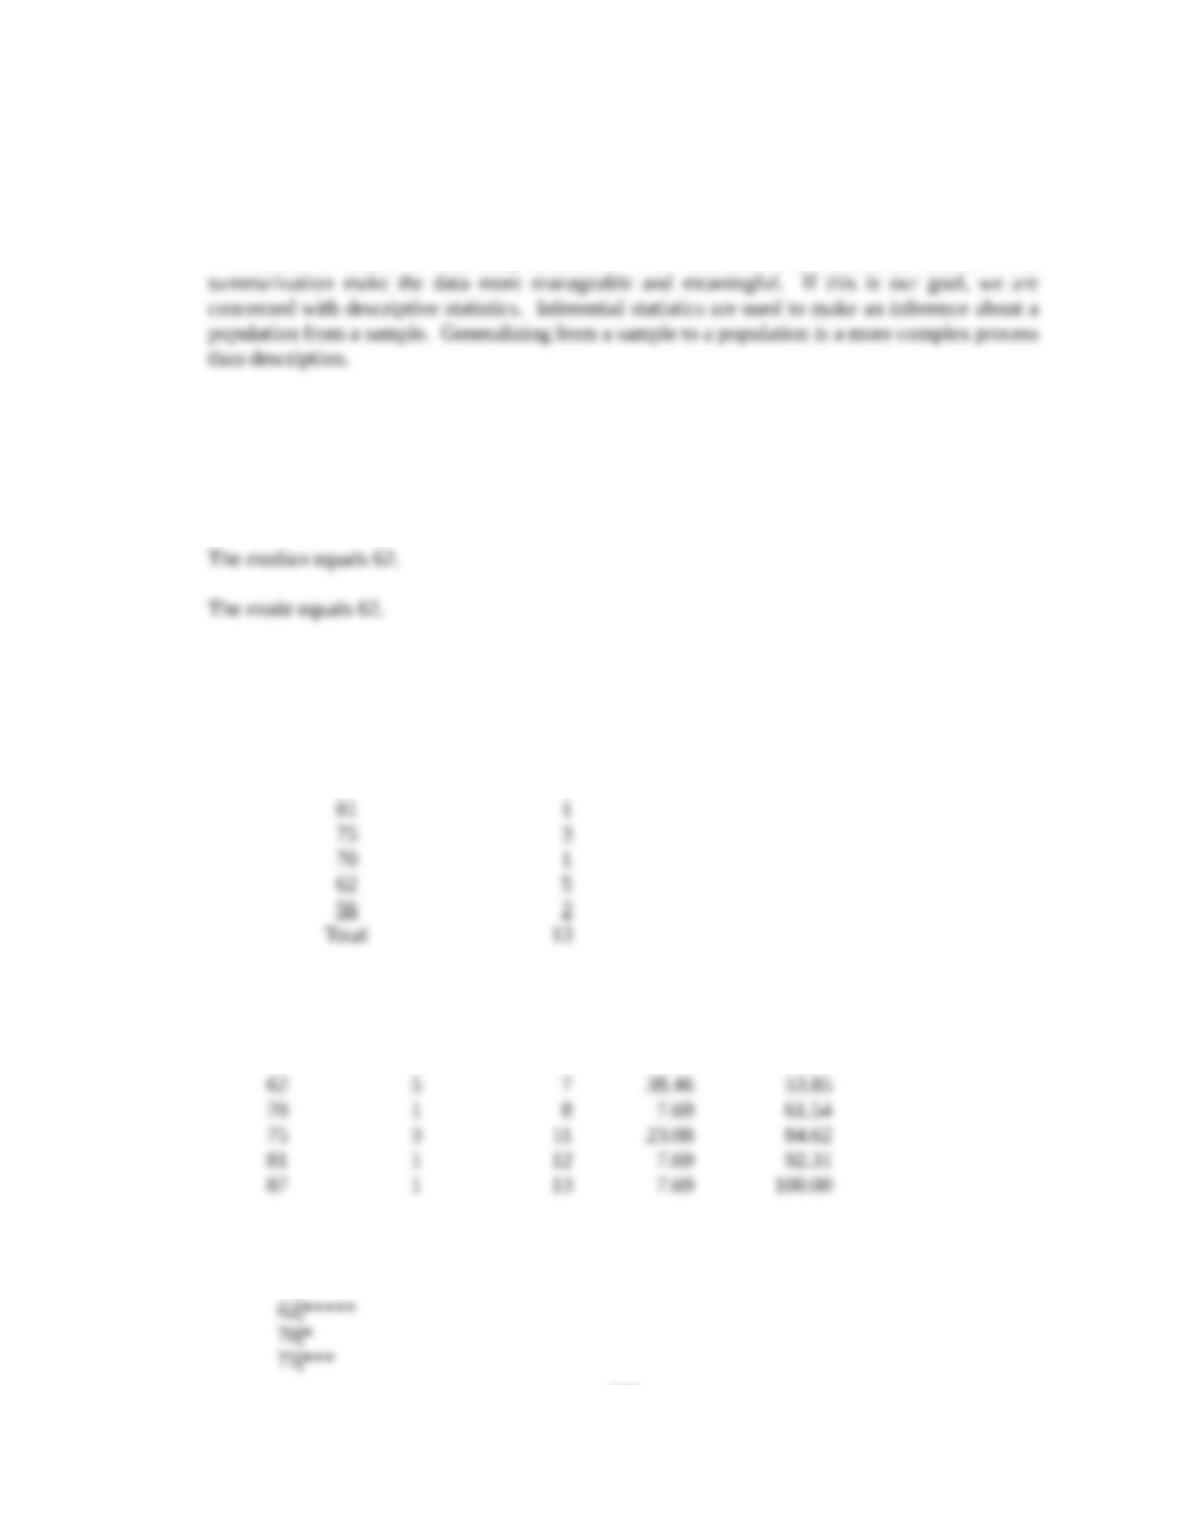
3. Prepare a frequency distribution for the data in question 2.
Frequency distribution of speed limits
Highway miles/hour Number
87 1
Variable = SPEED; country speed limit – MPH
Value Frequency Cum. Freq Percent Cum. Pct.
56 2 2 15.38 15.38
Variable = SPEED; country speed limit – MPH
56|**
275
© 2013 Cengage Learning. All Rights Reserved. May not be scanned, copied or
duplicated, or posted to a publicly accessible website, in whole or in part.
Chapter Seventeen: Determination of Sample Size 276
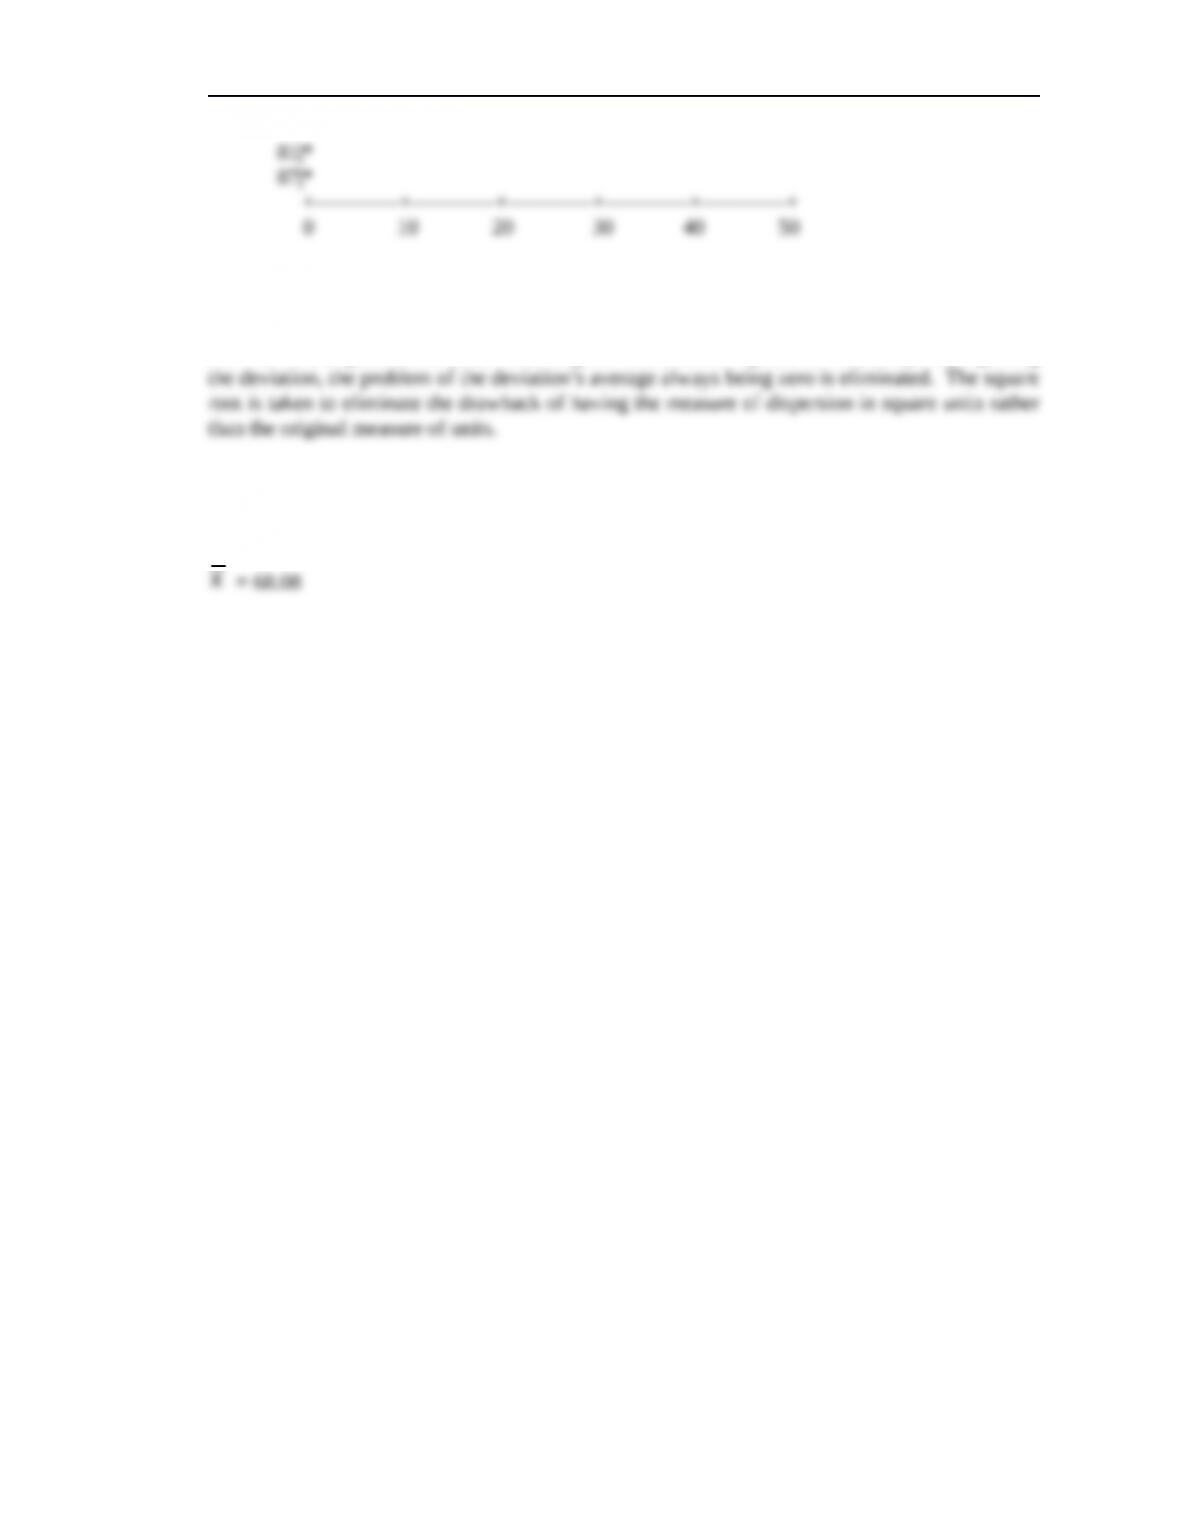
4. Why is the standard deviation rather than the average deviation typically used?
The average deviation always equals zero. Hence, the average deviation must be manipulated so
that we have a quantitative index reflecting the distribution’s spread or variability. By squaring
5. Calculate the sample standard deviation for the data in question 2.
The standard deviation equals 9.78.
© 2013 Cengage Learning. All Rights Reserved. May not be scanned, copied or
duplicated, or posted to a publicly accessible website, in whole or in part.

Chapter Seventeen: Determination of Sample Size 277
X (X –
X
) (X –
X
)2
87 18.9231 358.083
81 12.9231 167.006
Standard deviation =
X
X
2
n
1
1148
.
92
13
1
95
.
74
9
.
78468
Univariate Summary Statistics
Data Set = INTERNATIONAL SPEED LIMITS – MILES PER HOUR
SPEED country speed limit – MPH
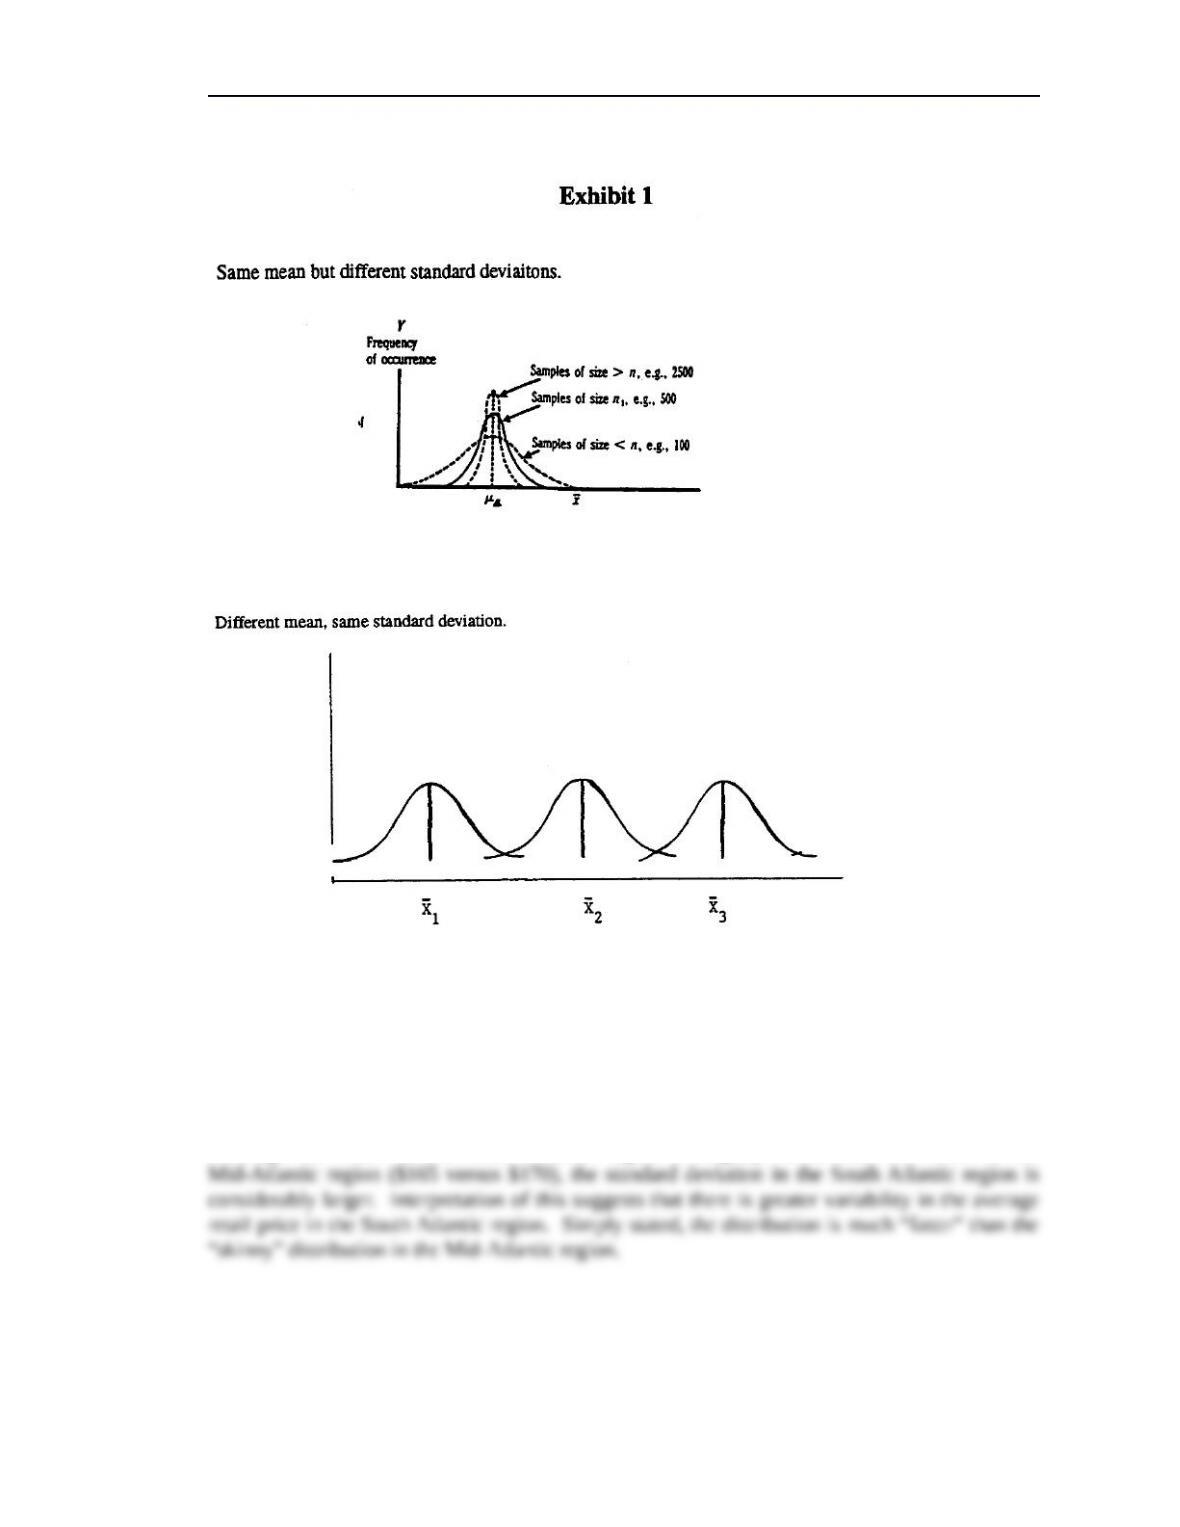
6. Draw three distributions that have the same mean value but different standard deviation
values. Draw three distributions that have the same standard deviation but different mean
values.
© 2013 Cengage Learning. All Rights Reserved. May not be scanned, copied or
duplicated, or posted to a publicly accessible website, in whole or in part.
Chapter Seventeen: Determination of Sample Size 278
7. A manufacturer of MP3 players surveyed one hundred retail stores in each of the firm’s sales
regions. An analyst noticed that in the South Atlantic region the average retail price was $165
(mean) and the standard deviation was $30. However, in the Mid-Atlantic region the mean
price was $170, with a standard deviation of $15. What do these statistics tell us about these
two sales regions?
Although the mean of the South Atlantic region is slightly lower than the mean of the
8. What is the sampling distribution? How does it differ from the sample distribution?
The sampling distribution is a theoretical probability distribution that shows the functional
relation between the possible values of some summary characteristic (such as the mean) of n
© 2013 Cengage Learning. All Rights Reserved. May not be scanned, copied or
duplicated, or posted to a publicly accessible website, in whole or in part.
Chapter Seventeen: Determination of Sample Size 279
9. What would happen to the sampling distribution of the mean if we increased the sample size
from 5 to 25?
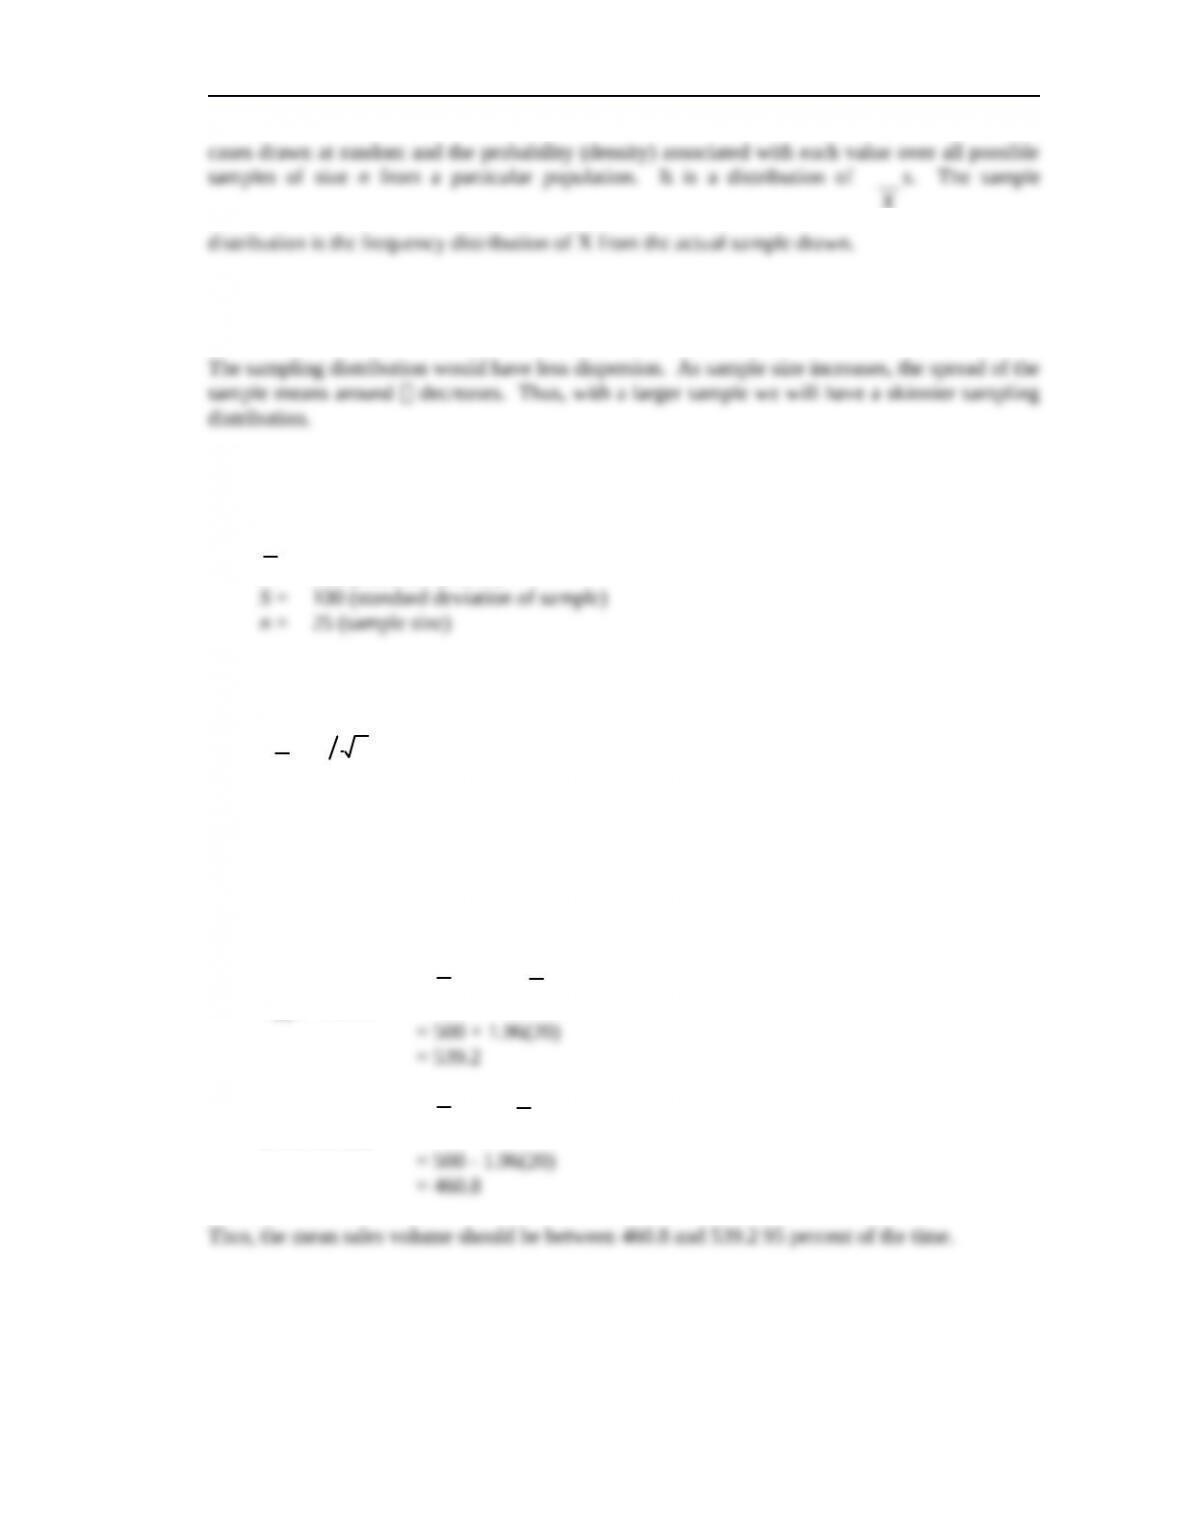
10. Suppose a fast-food restaurant wishes to estimate average sales volume for a new menu item.
The restaurant has analyzed the sales of the item at a similar outlet and observed the
following results:
X
= 500 (mean daily sales)
The restaurant manager wants to know into what range the mean daily sales should fall 95
percent of the time. Perform this calculation.
S
X = S n = 20
(1 –
a
) =.95 = confidence coefficient
a
=.05
Zc.l. = 1.96 (from standard normal table)
Upper bound =
X + Z
S
X
Lower bound =
X – Z
S
X
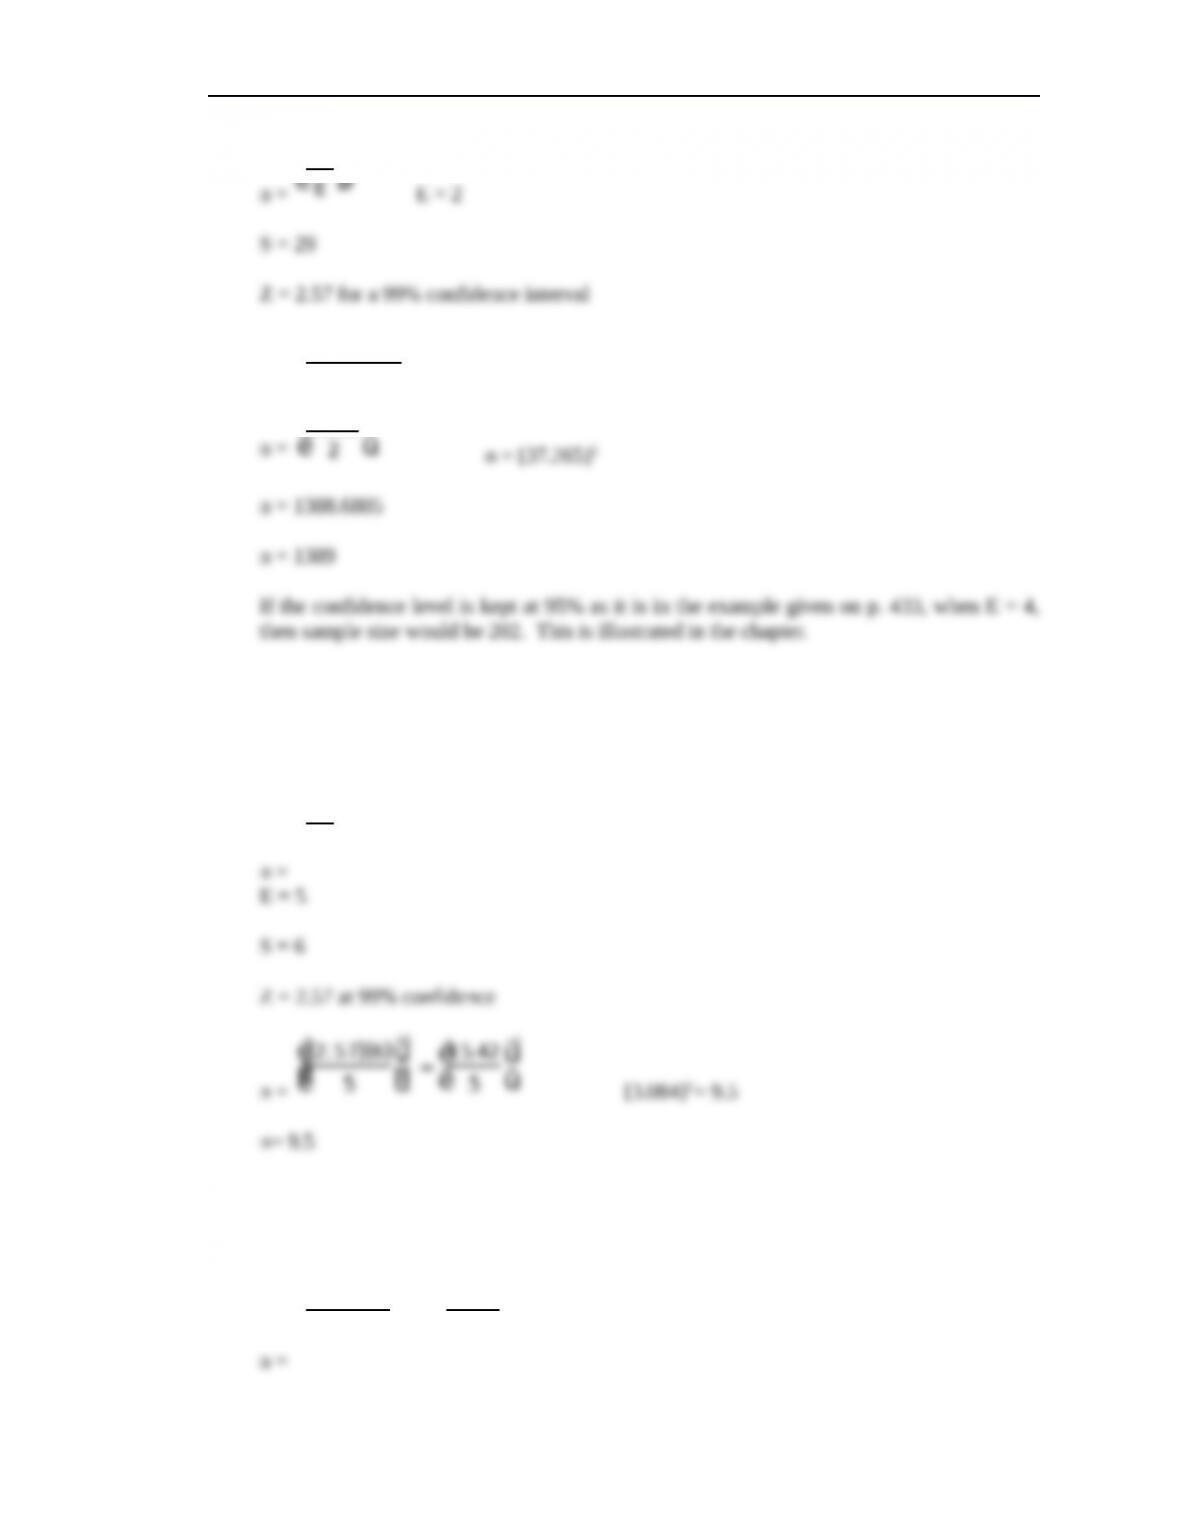
11. In our example of research on lipstick where E = $2 and S = $29, what sample size would
we require if we desired a 99 percent confidence level? What about if we keep the 95%
confidence level, but decide that our acceptable error is $4?
© 2013 Cengage Learning. All Rights Reserved. May not be scanned, copied or
duplicated, or posted to a publicly accessible website, in whole or in part.
Chapter Seventeen: Determination of Sample Size 280
ZS
E
æ
è ö
ø
2
n =
2 . 57
( )
29
( )
2
é
ë
ê ù
û
ú
2
74. 53
é
2
12. Suppose you are planning to sample cat owners to determine the average number of cans of
cat food they purchase monthly. The following standards have been set: a confidence level
of 99 percent and an error of less than five units. Past research has indicated that the
standard deviation should be 6 units. What is the required sample size?
ZS
E
æ
è ö
ø
2
Note: The students should be asked why sample size is so low if the confidence level is at 99%.
Of course, it is because such a large magnitude of error is tolerable. Reducing the E to 1
increases sample size to 238.
2 . 57
( )
6
( )
1
é
ë
ê ù
û
ú
2
= 15. 42
1
é
ë ù
û
2
= 237 . 7
© 2013 Cengage Learning. All Rights Reserved. May not be scanned, copied or
duplicated, or posted to a publicly accessible website, in whole or in part.
Chapter Seventeen: Determination of Sample Size 281
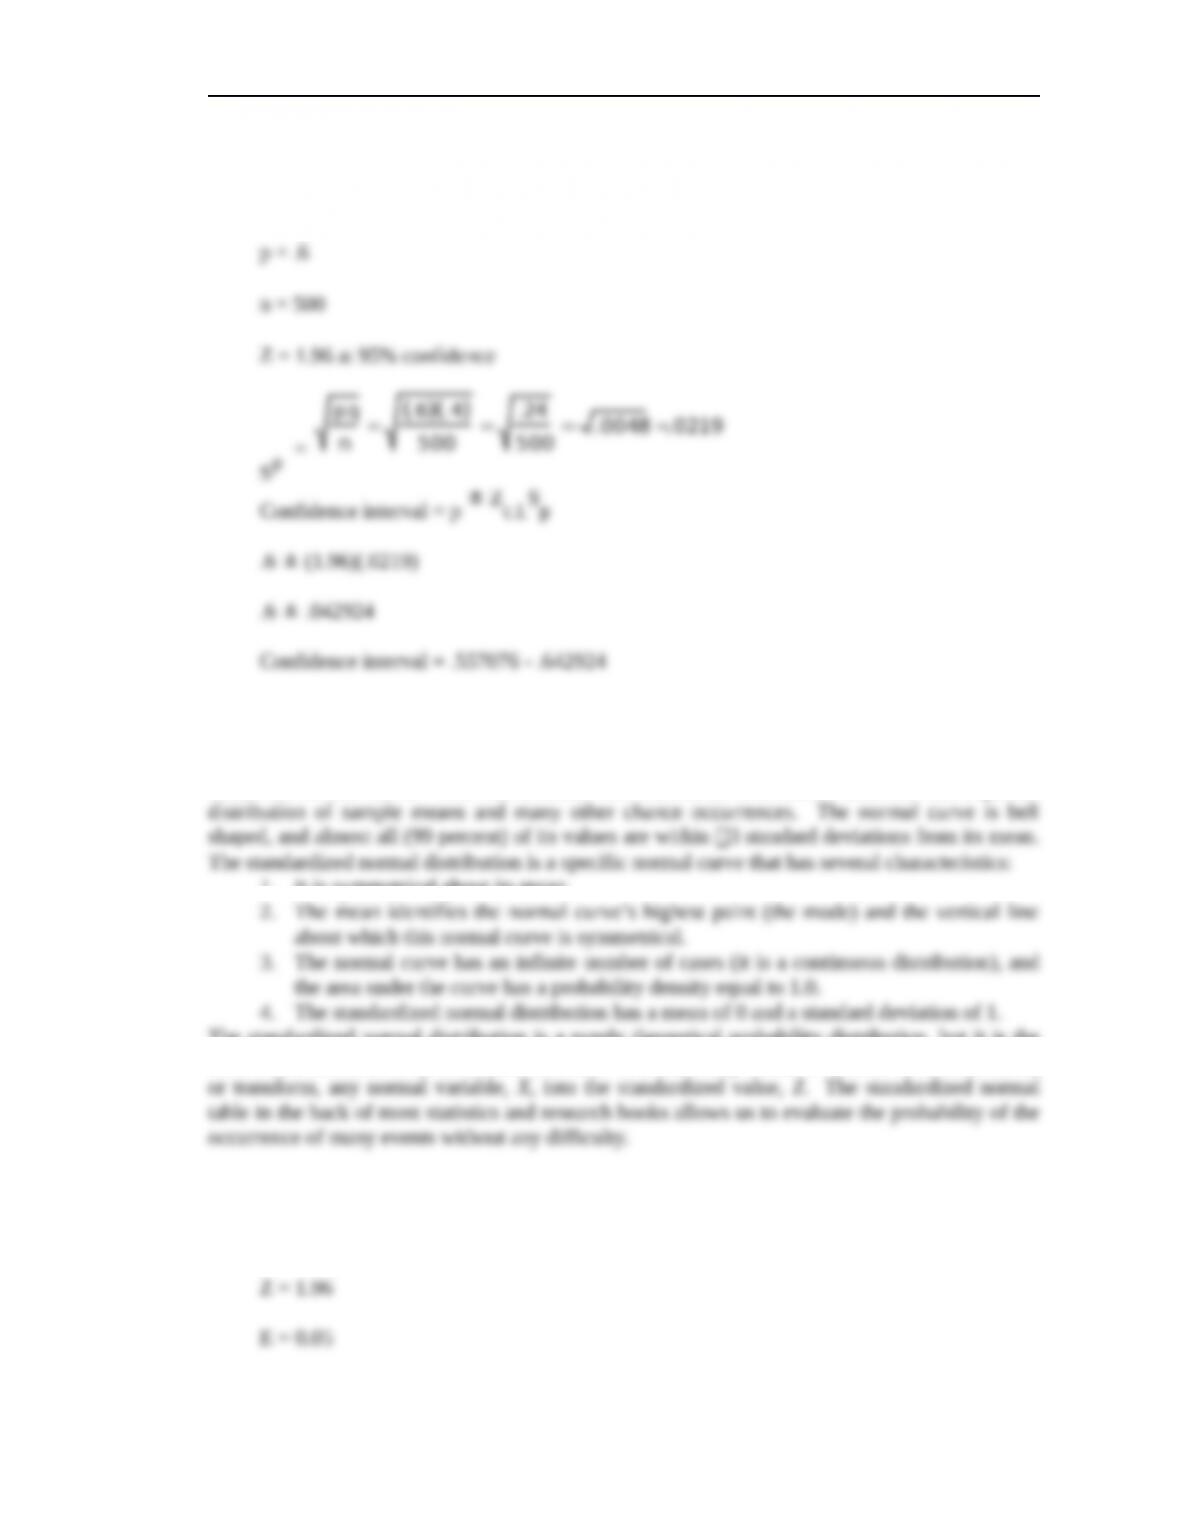
13. In a survey of 500 people, 60 percent responded with agreement to an attitude question.
Calculate a confidence interval at 95 percent to get an interval estimate for a proportion.
14. What is a standardized normal curve?
One of the most common probability distributions in statistics is the normal distribution, also
called the normal curve. This mathematical and theoretical distribution describes the expected
1. It is symmetrical about its mean.
The standardized normal distribution is a purely theoretical probability distribution, but it is the
most useful distribution in inferential statistics. It is extremely valuable because we can translate,
15. A researcher expects the population proportion of Cubs fans in Chicago to be 80 percent.
The researcher wishes to have an error of less than 5 percent and to be 95 percent confident
of an estimate to be made from a mail survey. What sample size is required?
© 2013 Cengage Learning. All Rights Reserved. May not be scanned, copied or
duplicated, or posted to a publicly accessible website, in whole or in part.
Chapter Seventeen: Determination of Sample Size 282
q = 0.20
n =
Z
pq
2
E
2 = 1 . 96
( )
2 . 80
( )
. 20
( )
. 05
( )
2 = 3 . 8416
( )
. 16
( )
. 0025
( )
=
. 6146
. 0025 = 245 . 84
n = 245 by calculation
16. [Ethics Question] Using the formula in this chapter, a researcher determines that at the 95
percent confidence level, a sample of 2,500 is required to satisfy a client’s requirements.
The researcher actually uses a sample of 1,200, however, because the client has specified a
budget cap for the survey. What are the ethical considerations in this situation?
It is common for business research to be conducted with sample sizes that are less than ideal.
After all, the tolerance for error is in part a subjective judgment. However, there are many
research projects that must have very precise and reliable estimates. The question in this situation
is one of being open with the client. If this matter was discussed there is no problem. However,
if the researcher finds that budget will not pay for the appropriate sample size then the
researcher’s ethics are questionable.
17. [Internet Question] Go to http://www.dartmouth.edu/~chance/ to visit the Chance course.
The Chance course is an innovative program to creatively teach introductory materials
about probability and statistics. The Chance course is designed to enhance quantitative
literacy. Numerous videos can be played online.
18. [Internet Question] Go to http://www.researchinfo.com. Click on “Market Research
Calculators” and select the sample size calculator. How big of a sample is needed to make
an inference about the U.S. population 5 percent? How large a sample is needed to make
an inference about the population of Norway 5 percent? Remember, the population
statistics can be found in the CIA World Factbook on-line. Comment.
The Sample Size Calculator can be used to help find the sample size required for this question.
At the 95% confidence level with a 5 percent confidence interval, the sample size for both the
19. [Internet Question] A random number generator and other statistical information can be
found at http://www.random.org. Flip some virtual coins. Perform 20 flips with an
Aurelian coin. Perform 20 flips with a Constatius coin. Perform frequency tables for each
result. What conclusion might you draw? Would the result change if you flipped the coins
200 times or 2,000 times?
© 2013 Cengage Learning. All Rights Reserved. May not be scanned, copied or
duplicated, or posted to a publicly accessible website, in whole or in part.

Chapter Seventeen: Determination of Sample Size 283
Student’s responses to the first part will vary. For example, my 20 flips with the Aurelian coin
resulted in “heads” 9 times and “tails” 11 times, and the results were 8 and 12, respectively, for
© 2013 Cengage Learning. All Rights Reserved. May not be scanned, copied or
duplicated, or posted to a publicly accessible website, in whole or in part.
Chapter Seventeen: Determination of Sample Size 284
RESEARCH ACTIVITIES
1. [Internet Question] Use an online library service to find basic business research studies that
report a “response rate” or number of respondents compared to number of contacts. You may
wish to consult journals like the Journal of Business Research or the Journal of Marketing or
the Journal of Management. Find at least 25 such studies. What is the average response rate
across all of these studies? Do there appear to be any trends or factors that are associated
with lower response rates? Write a brief report on your findings.
Students’ responses will vary on this exercise.
CASE 17.1 Pointsec Mobile Technologies
Objectives: To enable students to think critically about sample selection and size.
Summary: Many business people carry mobile devices such as laptop computers and PDAs,
often containing valuable data related to their jobs. Pointsec provides security systems to protect
such data. Pointsec decided to gather information on the prevalence of such devices left behind
on taxis. The company surveyed taxi drivers by calling major taxi companies in nine cities
around the world. Each company put the interviewers in touch with about 100 taxi drivers who
were asked how many devices had been left in their cab over the preceding six months. The
researchers came up with city-by-city numbers. For example, 3.42 cell phones per cab yielded
over 85,000 cell phones left behind in Chicago and over 63,000 in London, which was a 71
percent increase over a six-month period four years earlier.
Questions
1. Discuss why the sampling method and sample size make these results questionable, even
though the numbers were reported as if they were precise.
The drivers surveyed were not selected randomly. The researchers used a judgment sample to
generate this data. Moreover, the sample consisted of 100 taxi drivers from around the world.
2. The simple survey method described in the case may have been sufficient as a way to draw
attention to the issue of data security. However, if the company were using data on lost
mobile devices to predict demand for a product, accuracy might be more significant. Imagine
that you have been asked to collect data on mobile devices left in cabs, and you wish to be
able to report results with a 95 percent confidence level. How can you improve the sample
design and select an appropriate sample size?
The researcher must follow three steps: (1) estimate the standard deviation of the population, (2)
© 2013 Cengage Learning. All Rights Reserved. May not be scanned, copied or
duplicated, or posted to a publicly accessible website, in whole or in part.

Chapter Seventeen: Determination of Sample Size 285
© 2013 Cengage Learning. All Rights Reserved. May not be scanned, copied or
duplicated, or posted to a publicly accessible website, in whole or in part.