Case Three: Values and the Automobile Market 203
Case 3
Values and the Automobile Market
Database: Students are instructed to download the data sets for this case from the book’s
website or to request them from their instructor.
Objectives: The purpose of this case is to allow students to evaluate an entire research
project. Further, the database allows students to analyze the survey data using statistical or
spreadsheet software.
Summary: During the 1990s, the luxury car segment became one of the most competitive in
the automobile market. Many American consumers who purchased luxury cars preferred
imports from Germany and Japan.
Industry analysts believed it would be important to assess the viability of using personal values
as a basis for explaining ownership of American, German, and Japanese luxury cars. Further
they believed they should also assess whether knowledge of owners’ personal values provided
any additional information that would explain ownership.
A mail survey of 498 consumers containing names of people who had purchased a luxury
American, German or Japanese car received a 32 percent response rate. Several questions
concerned issues that consumers consider when buying luxury automobiles. Respondents also
rated how important twelve car attributes and eight values were to them.
Questions:
1. Is the sampling method adequate? Is the attitude measuring scale sound? Explain.
The sampling frame was from a respected commercial organization. A thirty-two percent
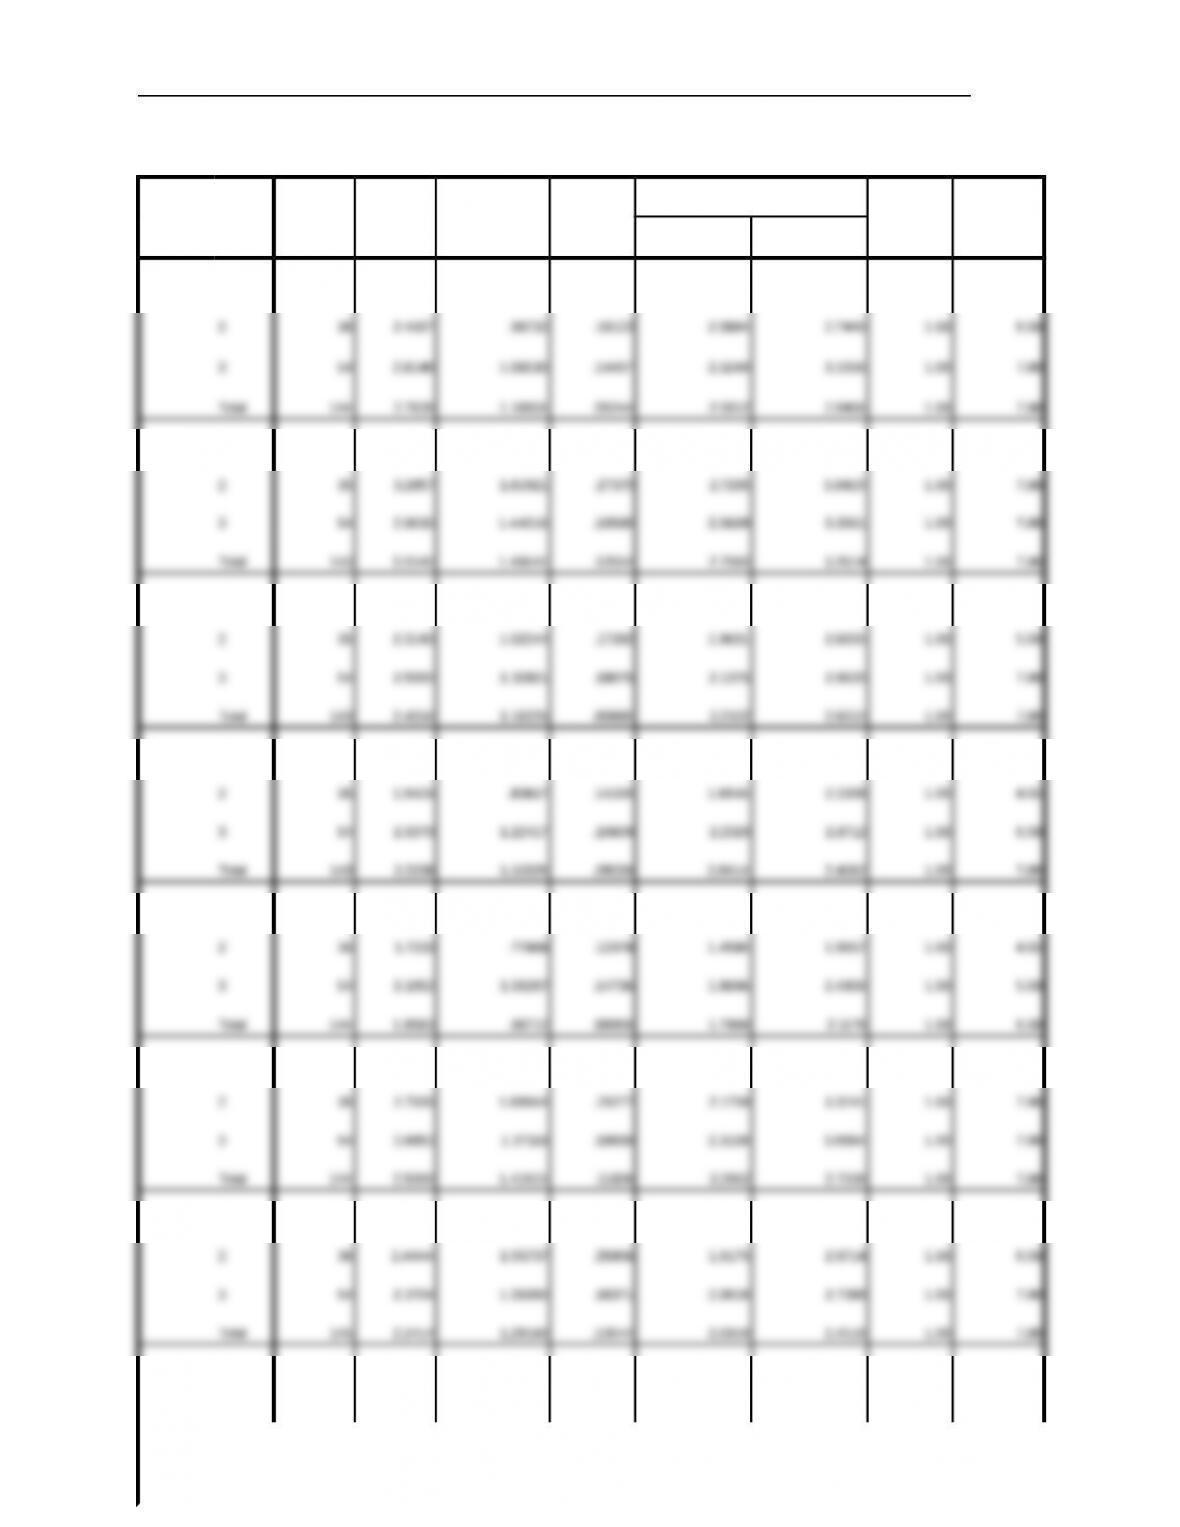
2. Using the computerized database with a statistical software package, calculate the means
of the three automotive groups for the values variables. Do any of the values variables
show significant differences between American, Japanese, and European car owners?
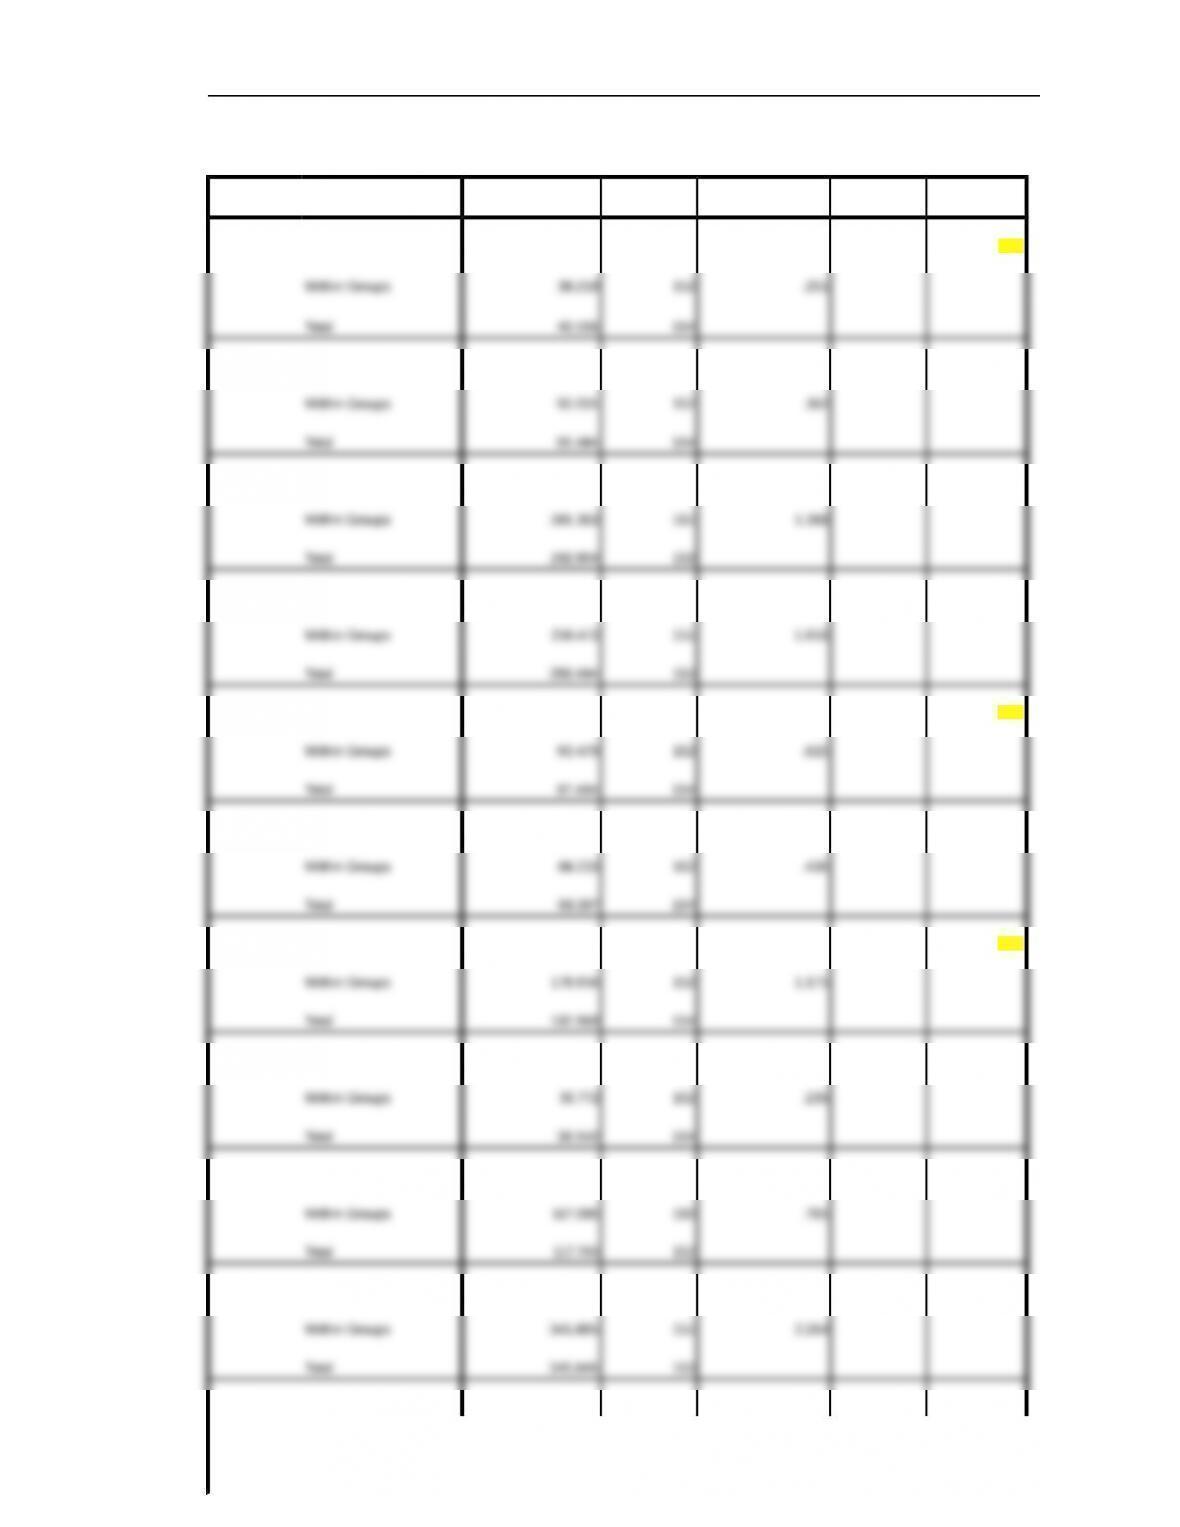
The computer software selected will determine the format of the output. Using SPSS (Analyze
© 2013 Cengage Learning. All Rights Reserved. May not be scanned, copied or
duplicated, or posted to a publicly accessible website, in whole or in part.
204 Part Seven: Comprehensive Cases
Descriptives
N Mean Std. Deviation Std. Error
95% Confidence Interval for Mean
Minimum MaximumLower Bound Upper Bound
fun 1 54 2.9444 1.20403 .16385 2.6158 3.2731 1.00 6.00
belong 1 54 2.8889 1.47516 .20074 2.4862 3.2915 1.00 6.00
respect 1 54 2.3704 1.13763 .15481 2.0599 2.6809 1.00 6.00
selfful 1 54 2.0926 1.06874 .14544 1.8009 2.3843 1.00 7.00
accomp 1 54 1.8889 .92485 .12586 1.6365 2.1413 1.00 6.00
warm 1 54 2.1481 1.20388 .16383 1.8196 2.4767 1.00 7.00
security 1 55 1.9818 .95240 .12842 1.7243 2.2393 1.00 5.00
selfres 1 54 1.6111 .87775 .11945 1.3715 1.8507 1.00 5.00
© 2013 Cengage Learning. All Rights Reserved. May not be scanned, copied or
duplicated, or posted to a publicly accessible website, in whole or in part.
Case Three: Values and the Automobile Market 205
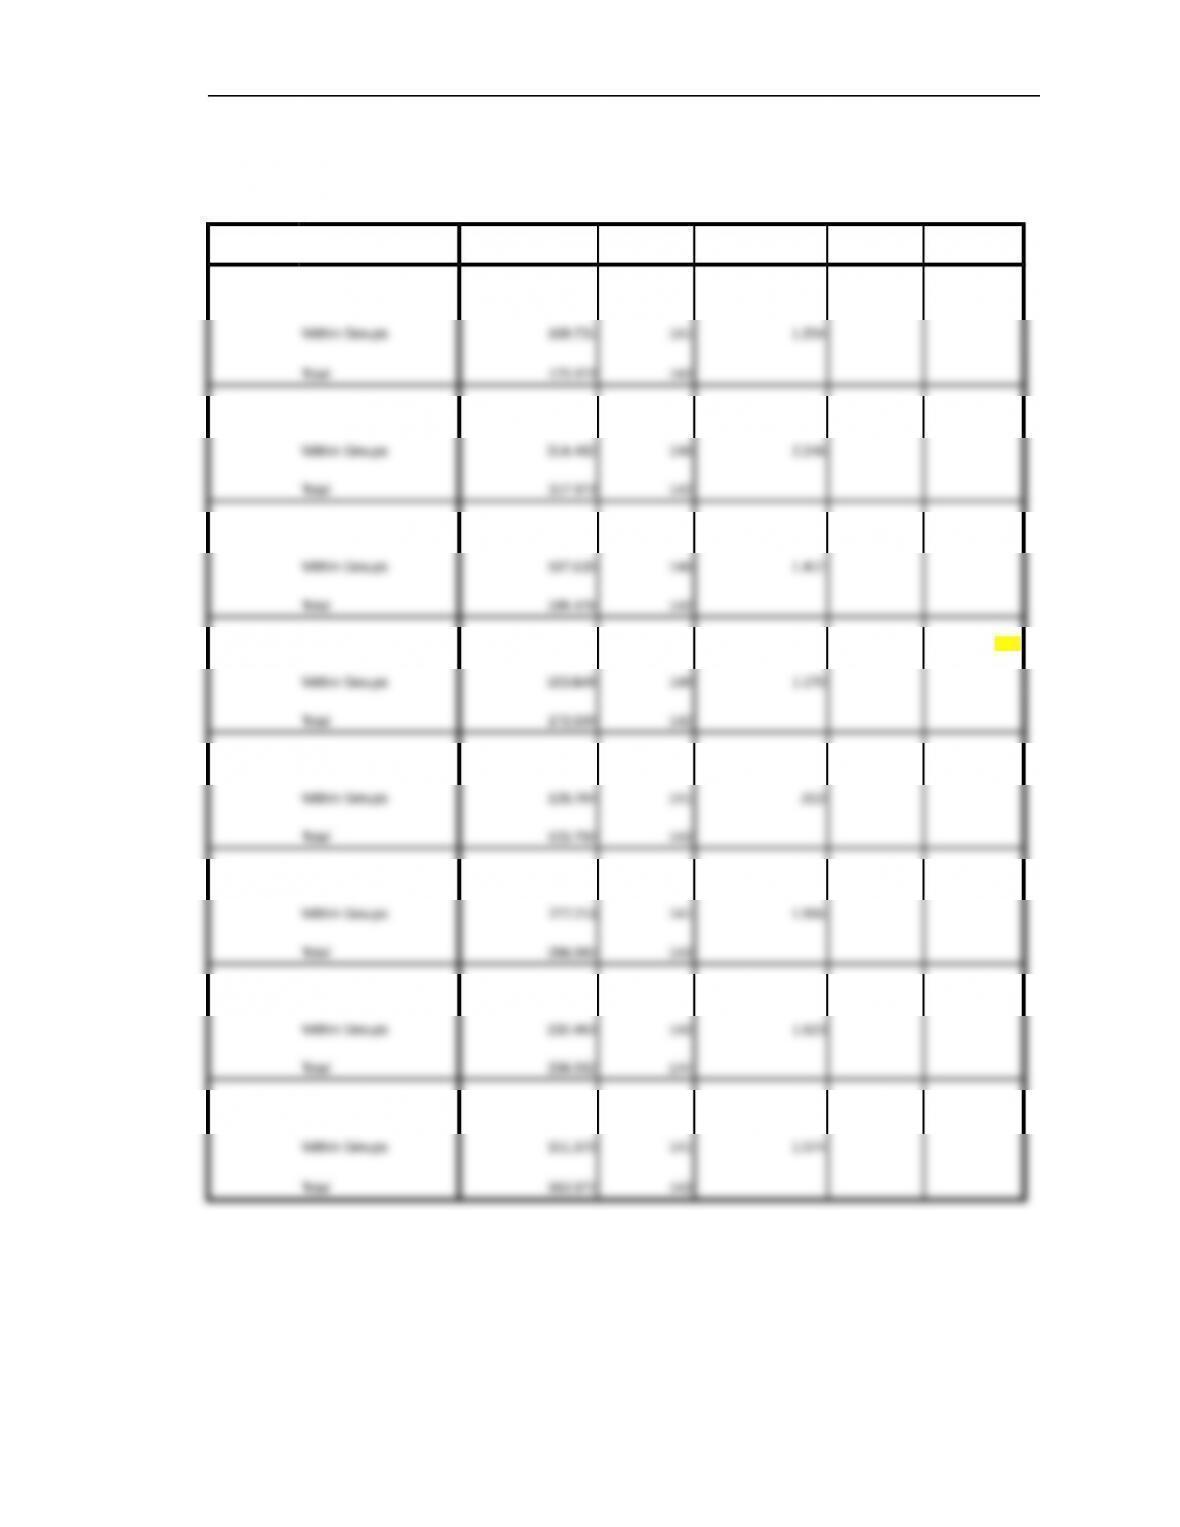
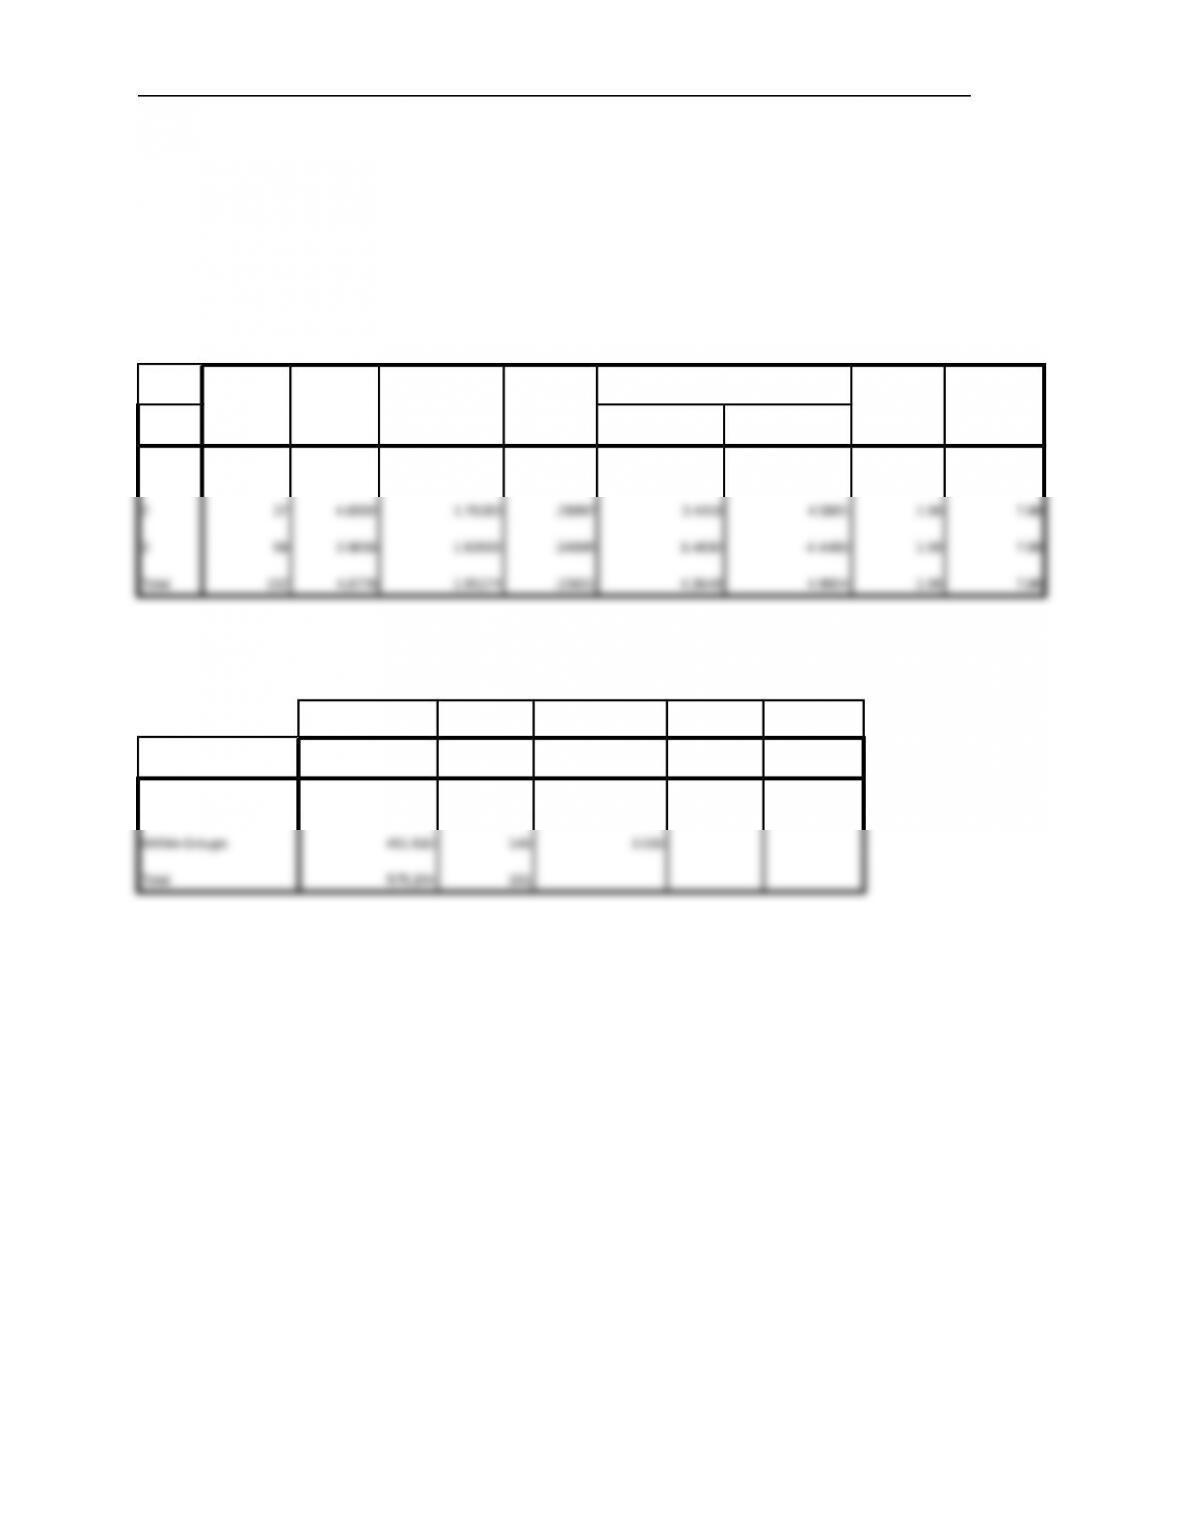
One-way ANOVA reveals only one value—self-fulfillment—with significant differences
among the groups:
ANOVA
Sum of Squares df Mean Square F Sig.
fun Between Groups 6.241 2 3.120 2.592 .078
belong Between Groups 3.570 2 1.785 .795 .454
respect Between Groups .840 2 .420 .298 .743
selfful Between Groups 8.990 2 4.495 3.841 .024
accomp Between Groups 5.046 2 2.523 2.764 .066
warm Between Groups 10.787 2 5.394 2.743 .068
security Between Groups 6.088 2 3.044 1.876 .157
selfres Between Groups 2.602 2 1.301 1.212 .301
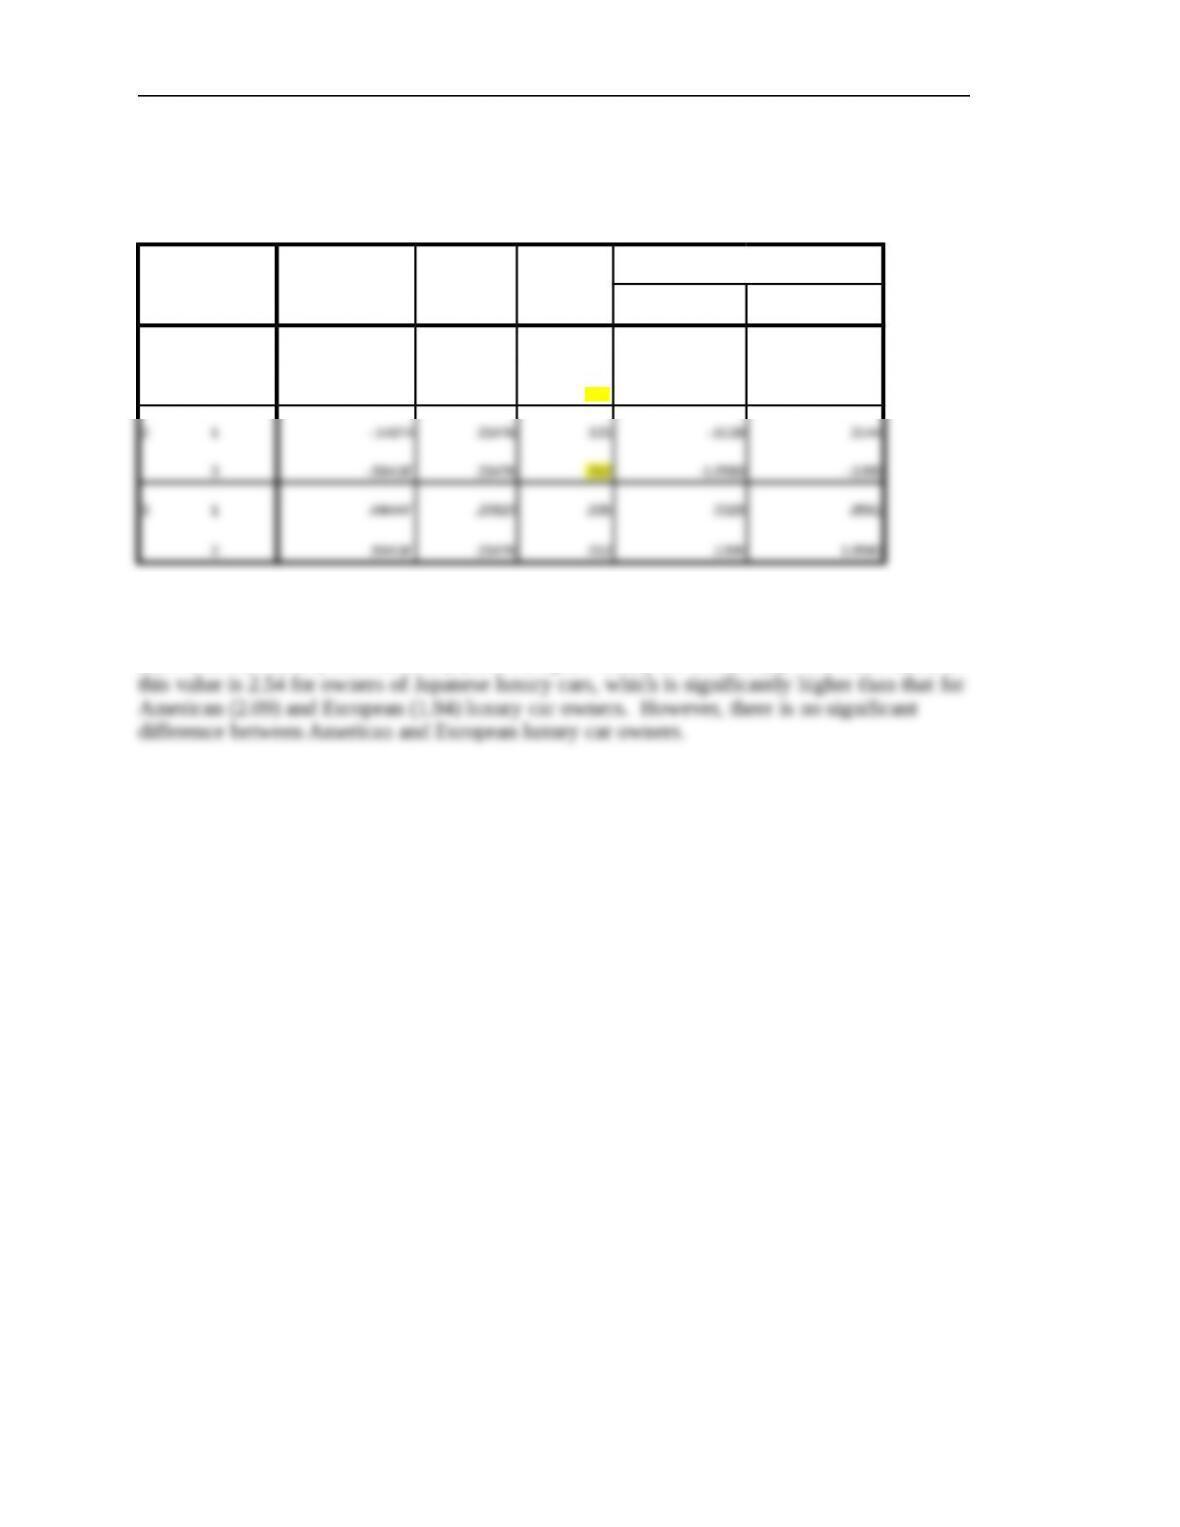
While not covered in this textbook, to fully answer the regarding difference among American,
Japanese, and European car owners on the value of self-fulfillment, pos hoc comparisons can
be performed:
© 2013 Cengage Learning. All Rights Reserved. May not be scanned, copied or
duplicated, or posted to a publicly accessible website, in whole or in part.
206 Part Seven: Comprehensive Cases
Multiple Comparisons
selfful
LSD
(I) car (J) car Mean Difference (I-J) Std. Error Sig.
95% Confidence Interval
Lower Bound Upper Bound
1 2 .14974 .23476 .525 -.3144 .6139
3 -.44444*.20820 .035 -.8561 -.0328
*. The mean difference is significant at the 0.05 level.
There is significant difference on this value between owners of Japanese luxury cars (3) and
both American luxury cars owners (1) and European luxury car owners (2). The mean score on
3. Are there any significant differences on importance of attributes?
There are several significant differences at the p < 0.05 level (means are not given here):
© 2013 Cengage Learning. All Rights Reserved. May not be scanned, copied or
duplicated, or posted to a publicly accessible website, in whole or in part.
Case Three: Values and the Automobile Market 207
ANOVA
Sum of Squares df Mean Square F Sig.
comfort Between Groups 1.937 2 .969 3.852 .023
safety Between Groups .453 2 .226 .625 .536
power Between Groups 1.601 2 .800 .631 .533
speed Between Groups 8.021 2 4.011 2.418 .093
styling Between Groups 4.005 2 2.003 3.256 .041
durabil Between Groups 2.154 2 1.077 2.472 .088
lowmc Between Groups 14.312 2 7.156 6.088 .003
rely Between Groups .770 2 .385 1.637 .198
warranty Between Groups .670 2 .335 .429 .652
nonpoll Between Groups 3.161 2 1.580 .698 .499
gasmile Between Groups 2.302 2 1.151 .627 .536
© 2013 Cengage Learning. All Rights Reserved. May not be scanned, copied or
duplicated, or posted to a publicly accessible website, in whole or in part.
208 Part Seven: Comprehensive Cases
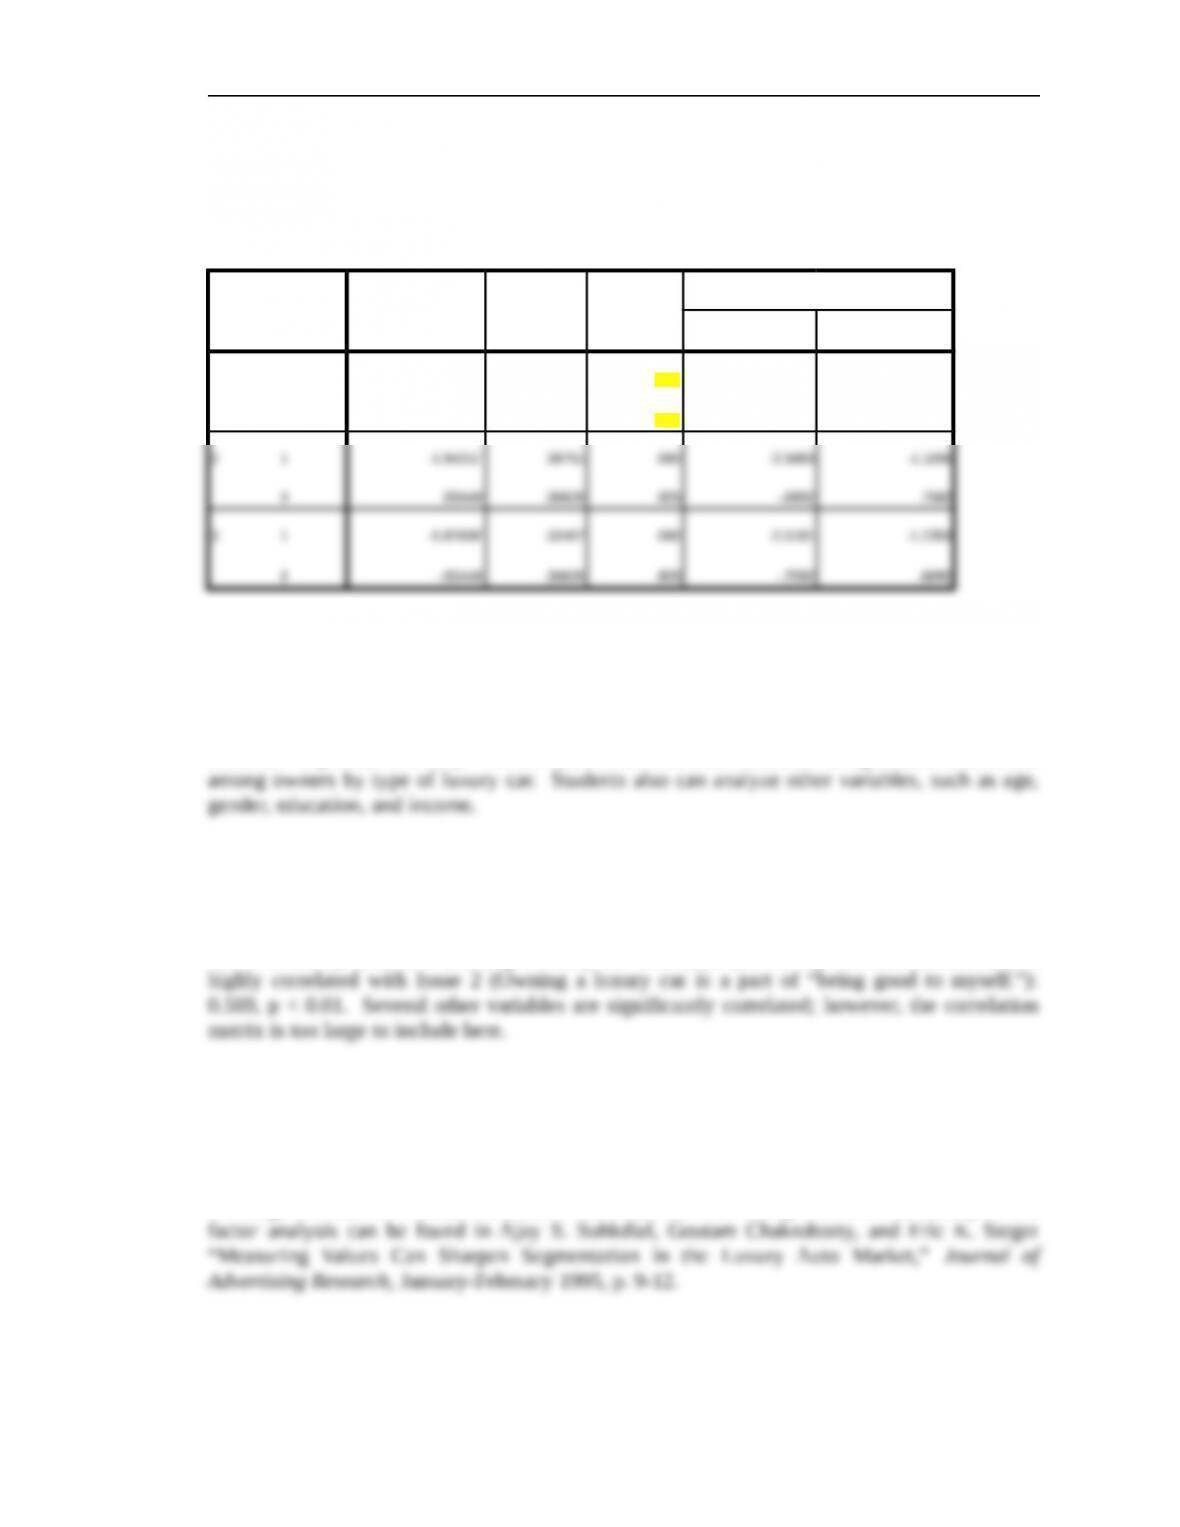
Further analysis of the mean differences on the “speed of repairs” attribute reveals that
American car owners rated this attribute significantly more important than European and
Japanese car owners:
Descriptives
repairs
N Mean Std. Deviation Std. Error
95% Confidence Interval for Mean
Minimum MaximumLower Bound Upper Bound
1 57 5.8421 1.62337 .21502 5.4114 6.2728 1.00 7.00
ANOVA
repairs
Sum of Squares df Mean Square F Sig.
Between Groups 123.694 2 61.847 20.410 .000
© 2013 Cengage Learning. All Rights Reserved. May not be scanned, copied or
duplicated, or posted to a publicly accessible website, in whole or in part.
Case Three: Values and the Automobile Market 209
Multiple Comparisons
repairs
LSD
(I) car (J) car Mean Difference (I-J) Std. Error Sig.
95% Confidence Interval
Lower Bound Upper Bound
1 2 1.84211*.36751 .000 1.1159 2.5683
3 1.87659*.32467 .000 1.2350 2.5181
*. The mean difference is significant at the 0.05 level.
4. Write a short statement to interpret the results of this research.
Students’ responses will vary. However, there were several instances of significant differences
Advanced Questions:
5. Are any of the value scale items highly correlated?
Yes. For example, Issue 1 (Having a luxury car is a major part of my fun and excitement.) is
6. Should multivariate analysis be used to understand the data?
In a situation where a researcher wishes to compare groups, multiple discriminate analysis can
be used. A factor analysis of the issues considered when buying would also be of interest.
Although the data of this case have been modified, results of multiple discriminant analysis and
© 2013 Cengage Learning. All Rights Reserved. May not be scanned, copied or
duplicated, or posted to a publicly accessible website, in whole or in part.