
176 Part Seven: Comprehensive Cases
Part Seven
Comprehensive Cases with Computerized
Databases
Case 1
Running the Numbers: Does It Pay?
Database: Students are instructed to download the data sets for this case from the book’s
website or to request them from their instructor.
Objectives: This case allows the student to consider the ethical dimension in business
research, to develop hypotheses, and to test them.
Summary: Dr. William Ray, a research consultant, has received a government grant to
research how aspects of a student’s college experiences relate to his or her job performance.
The grant is the result of Senator B.G. Shot being lobbied by his constituents that employers
are discriminating against people who do not like math by giving them lower salaries. He
hopes the results will support his legislation making discrimination against those people who
do not like math illegal. The research questions that this particular grant proposal include:
RQ1: Does a student’s liking of quantitative coursework in college affect his or her future
earnings?
RQ2: Do people with an affinity for quantitative courses get promoted more quickly than
those who do not?
An e-mail survey was sent to employees of a Fortune 500 firm, and while respondents were
told their responses will be confidential, the e-mail was coded so that the actual respondents
could be identified by both e-mail address and name. Dr. Ray, however, keeps this information
confidential so the company could not identify any particular employee’s response. Questions
from the survey are given in tables.
Questions
1. Does the grant present Dr. Ray with an ethical dilemma(s) in any way?
Yes. Senator Shot wants research to support his point of view so that it will support his
proposed legislation, which will be received positively by his constituents. Recall from
© 2013 Cengage Learning. All Rights Reserved. May not be scanned, copied or
duplicated, or posted to a publicly accessible website, in whole or in part.

177 Part Seven: Comprehensive Cases
2. Derive at least one hypothesis for each research question listed above. Provide a sound
rationale or theoretical explanation that leads to the hypotheses.
While students’ hypotheses will differ, possible hypotheses for RQ1 could be:
H1: Attitude toward quantitative coursework is related to future earnings.
or
3. Use the data that corresponds to this case to perform an adequate test of each hypothesis.
Interpret the results.
A summated scale for attitude toward math can be computed. X3 and X5 need to be recoded
prior to creating a summed scale, however.
Reliability Statistics
Cronbach’s
Alpha N of Items
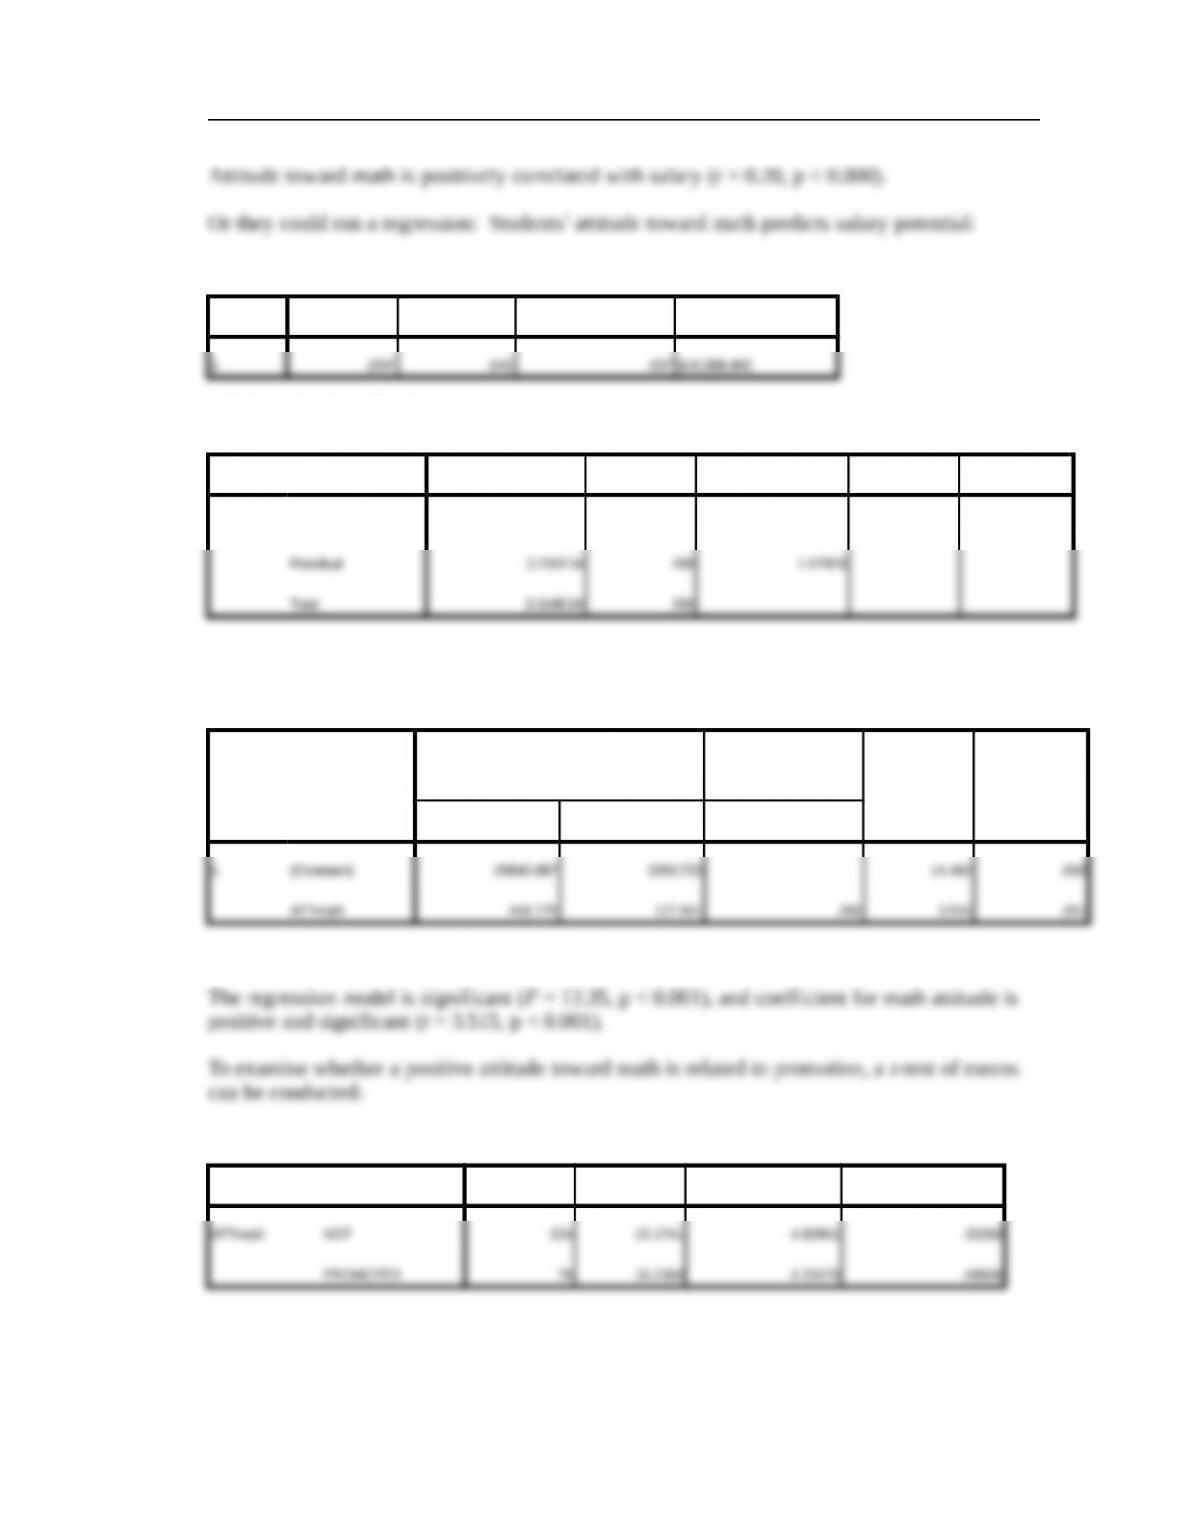
To examine the relationship between attitude toward math and salary, students can examine the
correlation between the two variables:
Correlations
ATTmath SALARY
ATTmath Pearson Correlation 1.000 .200**
**. Correlation is significant at the 0.01 level (1-tailed).
© 2013 Cengage Learning. All Rights Reserved. May not be scanned, copied or
duplicated, or posted to a publicly accessible website, in whole or in part.
Case One: Running the Numbers? Does It Pay?
178
Model Summary
Model R R Square Adjusted R Square Std. Error of the Estimate
a. Predictors: (Constant), ATTmath
ANOVAb
Model Sum of Squares df Mean Square F Sig.
1 Regression 1.334E9 1 1.334E9 12.358 .001a
a. Predictors: (Constant), ATTmath
b. Dependent Variable: SALARY
Coefficientsa
Model
Unstandardized Coefficients
Standardized
Coefficients
t Sig.B Std. Error Beta
a. Dependent Variable: SALARY
Group Statistics
prom N Mean Std. Deviation Std. Error Mean
© 2013 Cengage Learning. All Rights Reserved. May not be scanned, copied or
duplicated, or posted to a publicly accessible website, in whole or in part.
179 Part Seven: Comprehensive Cases
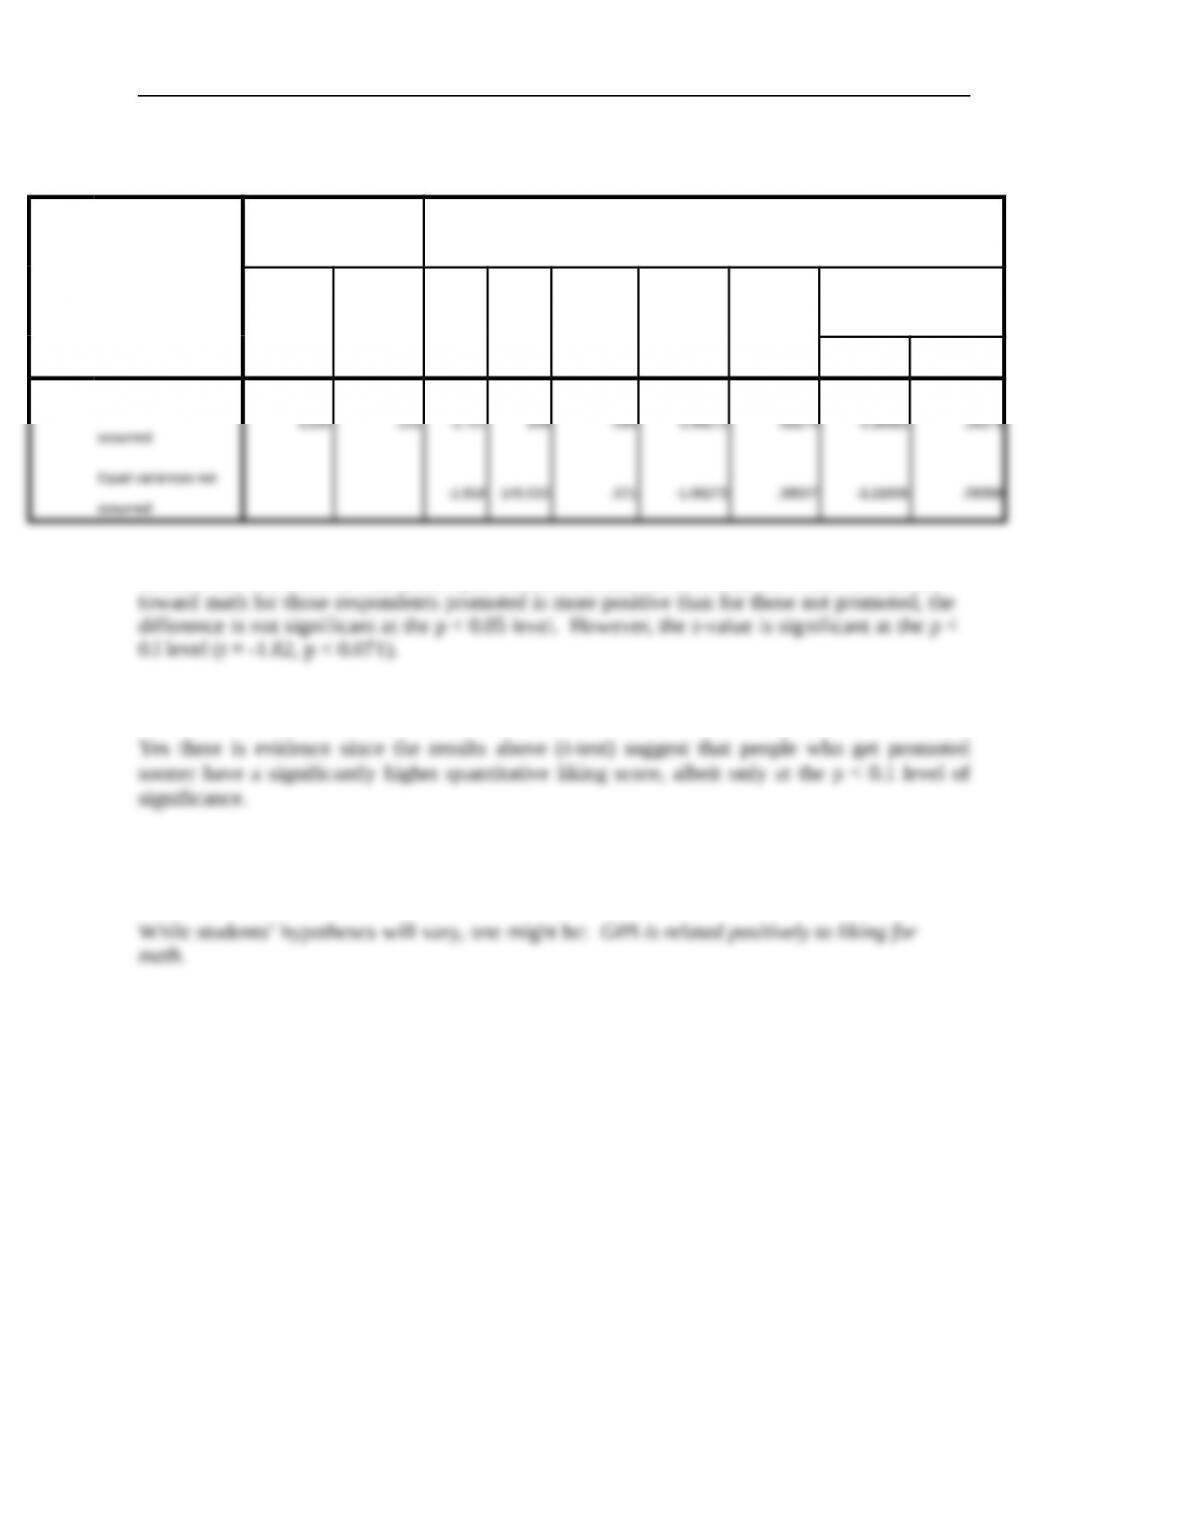
Independent Samples Test
Levene’s Test for Equality of
Variances t-test for Equality of Means
F Sig. t df Sig. (2-tailed)
Mean
Difference
Std. Error
Difference
95% Confidence Interval of
the Difference
Lower Upper
ATTmath Equal variances
2.295 .131 -1.707 298 .089 -1.06273 .62274 -2.28826 .16279
assumed
Because the cell sizes are unequal, equal variance should not be assumed. While the attitude
4. Is there evidence supporting the discrimination claim? Explain.
5. List another hypothesis (unrelated to the research questions in the grant) that could be
tested with the data.
6. Test the hypothesis.
© 2013 Cengage Learning. All Rights Reserved. May not be scanned, copied or
duplicated, or posted to a publicly accessible website, in whole or in part.
Case One: Running the Numbers? Does It Pay?
180
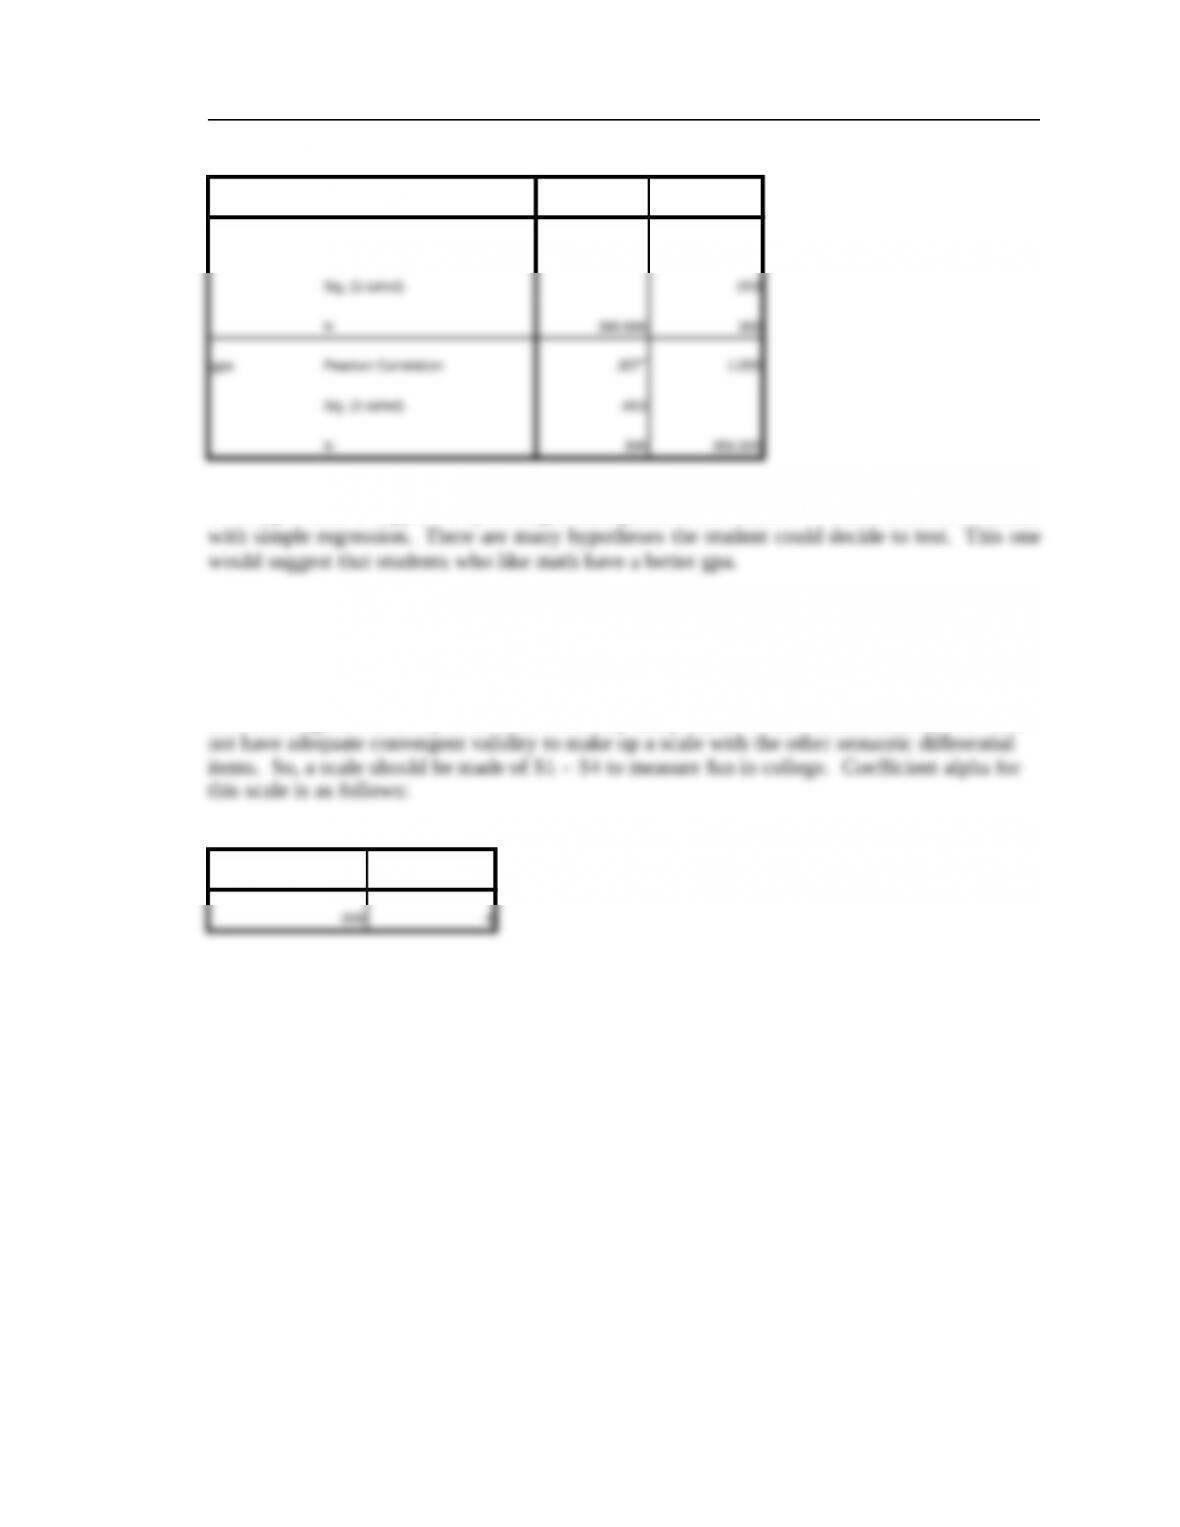
Correlations
ATTmath gpa
ATTmath Pearson Correlation 1.000 .157**
**. Correlation is significant at the 0.01 level (1-tailed).
This hypothesis is supported by the significant positive correlation. It could likewise be tested
7. Considering employees’ attitudes about their college experience, does the amount of fun
that students had in college or the degree to which they thought quantitative classes were a
positive experience relate more strongly to salary?
Either through factor analysis or scale reliability analysis, the student should find that S5 does
Reliability Statistics
Cronbach’s Alpha N of Items
Then, a regression model can be estimated predicting salary (dependent variable) with the
previously computed quantitative scale and the fun scale. The results are as follows:
© 2013 Cengage Learning. All Rights Reserved. May not be scanned, copied or
duplicated, or posted to a publicly accessible website, in whole or in part.
181 Part Seven: Comprehensive Cases
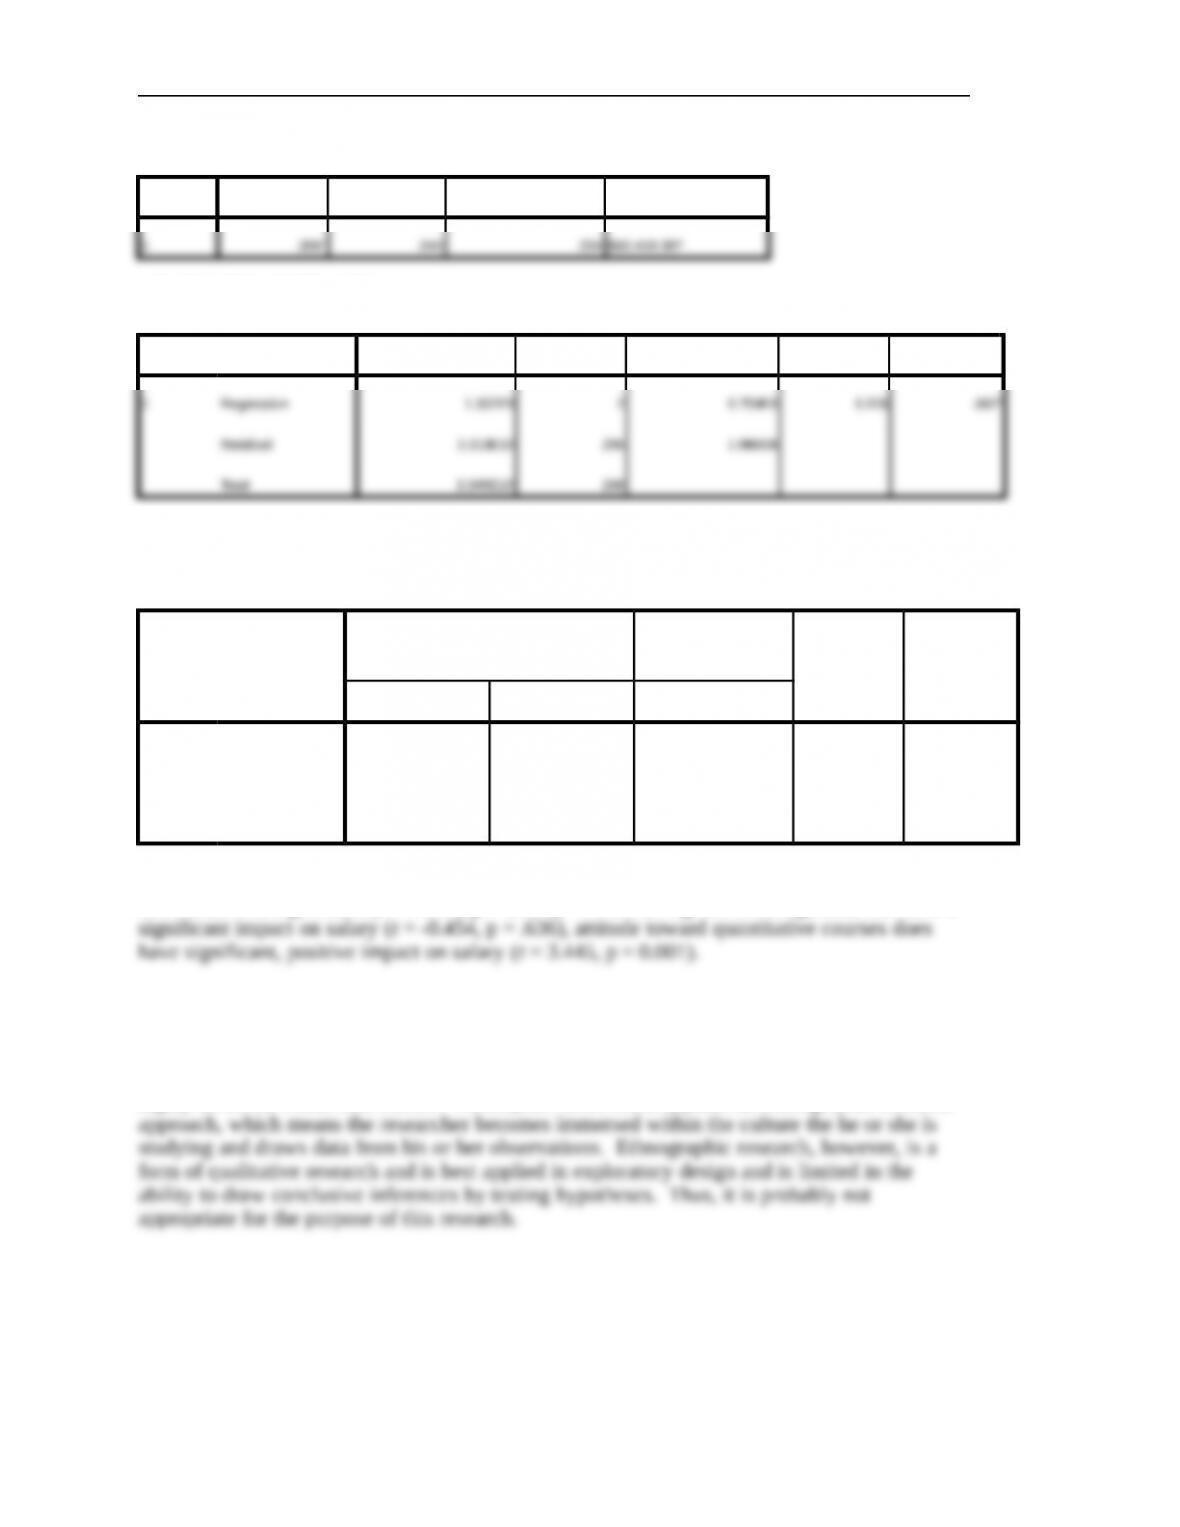
Model Summary
Model R R Square Adjusted R Square Std. Error of the Estimate
a. Predictors: (Constant), ATTmath, Fun
ANOVAb
Model Sum of Squares df Mean Square F Sig.
a. Predictors: (Constant), ATTmath, Fun
b. Dependent Variable: SALARY
Coefficientsa
Model
Unstandardized Coefficients
Standardized
Coefficients
t Sig.B Std. Error Beta
1 (Constant) 29886.160 2085.800 14.328 .000
Fun -44.787 94.538 -.027 -.474 .636
ATTmath 445.023 129.196 .197 3.445 .001
a. Dependent Variable: SALARY
The model F is significant (F = 6.226, p = 0.002). While having fun in college does not have a
8. Would the “problem” that led to the grant be a candidate for ethnographic research?
Explain.
Ethnography represents ways of studying cultures through methods that involve becoming
highly involved within that culture. Participant-observation typifies an ethnographic research
© 2013 Cengage Learning. All Rights Reserved. May not be scanned, copied or
duplicated, or posted to a publicly accessible website, in whole or in part.