7.1 continued.
Operation
s
to
© 2013 Cengage Learning. All
r
ights reserved. No
d
is
t
r
ibution allowed without express
a
u
t
hor
ization.
Year Numerator Denominator Turnover
Ratio
2011 $ 7,624 $ 1,730.5a
7-11Solutions
7.19 b. continued.Accounts Payable Turnover Ratio
Accounts Payable
Year Numerator Denominator Turnover Ratio
2011 $ 7,785a$ 777.5d10.01
c.
significantly during the three-year period. The current and
quick
ratios fluctuated but are well above 1.0. Its cash flow from
2012. The increasing profit margin ultimately provides more
cash than if the profit margin had remained stable.
© 2013 Cengage Learning. All
r
ights reserved. No
d
is
t
r
ibution allowed without express
a
u
t
hor
ization.
7.20 (Geneva, S.A.; calculating and interpreting short-term liquidity
ratios.) (amounts in millions of euros)
a. Current Ratio
Year Numerator Denominator Current
Ratio
2010 € 22,828 € 18,811 1
.
21
Solutions7-12
7.20 a. continued.
Quick Ratio
Year Numerator Denominator Quick
b. Cash Flow from Operations to Current Liabilities Ratio
Cash Flow
from
Operation
s
to
Current
Liabilities
Year Numerator Denominator Ratio
Accounts Receivable Turnover
Ratio
A
cc
o
un
t
s
R
ecei
vab
l
e
© 2013 Cengage Learning. All
r
ights reserved. No
d
is
t
r
ibution allowed without express
a
u
t
hor
ization.
Year Numerator Denominator Turnover
Ratio
7-1Solutions
7.20 b. continued.
Inventory Turnover
Ratio Inventory
Year Numerator Denominator Turnover
Ratio
7.5 continued.
Accounts Payable Turnover Ratio
Accounts Payable
Year Numerator Denominator Turnover Ratio
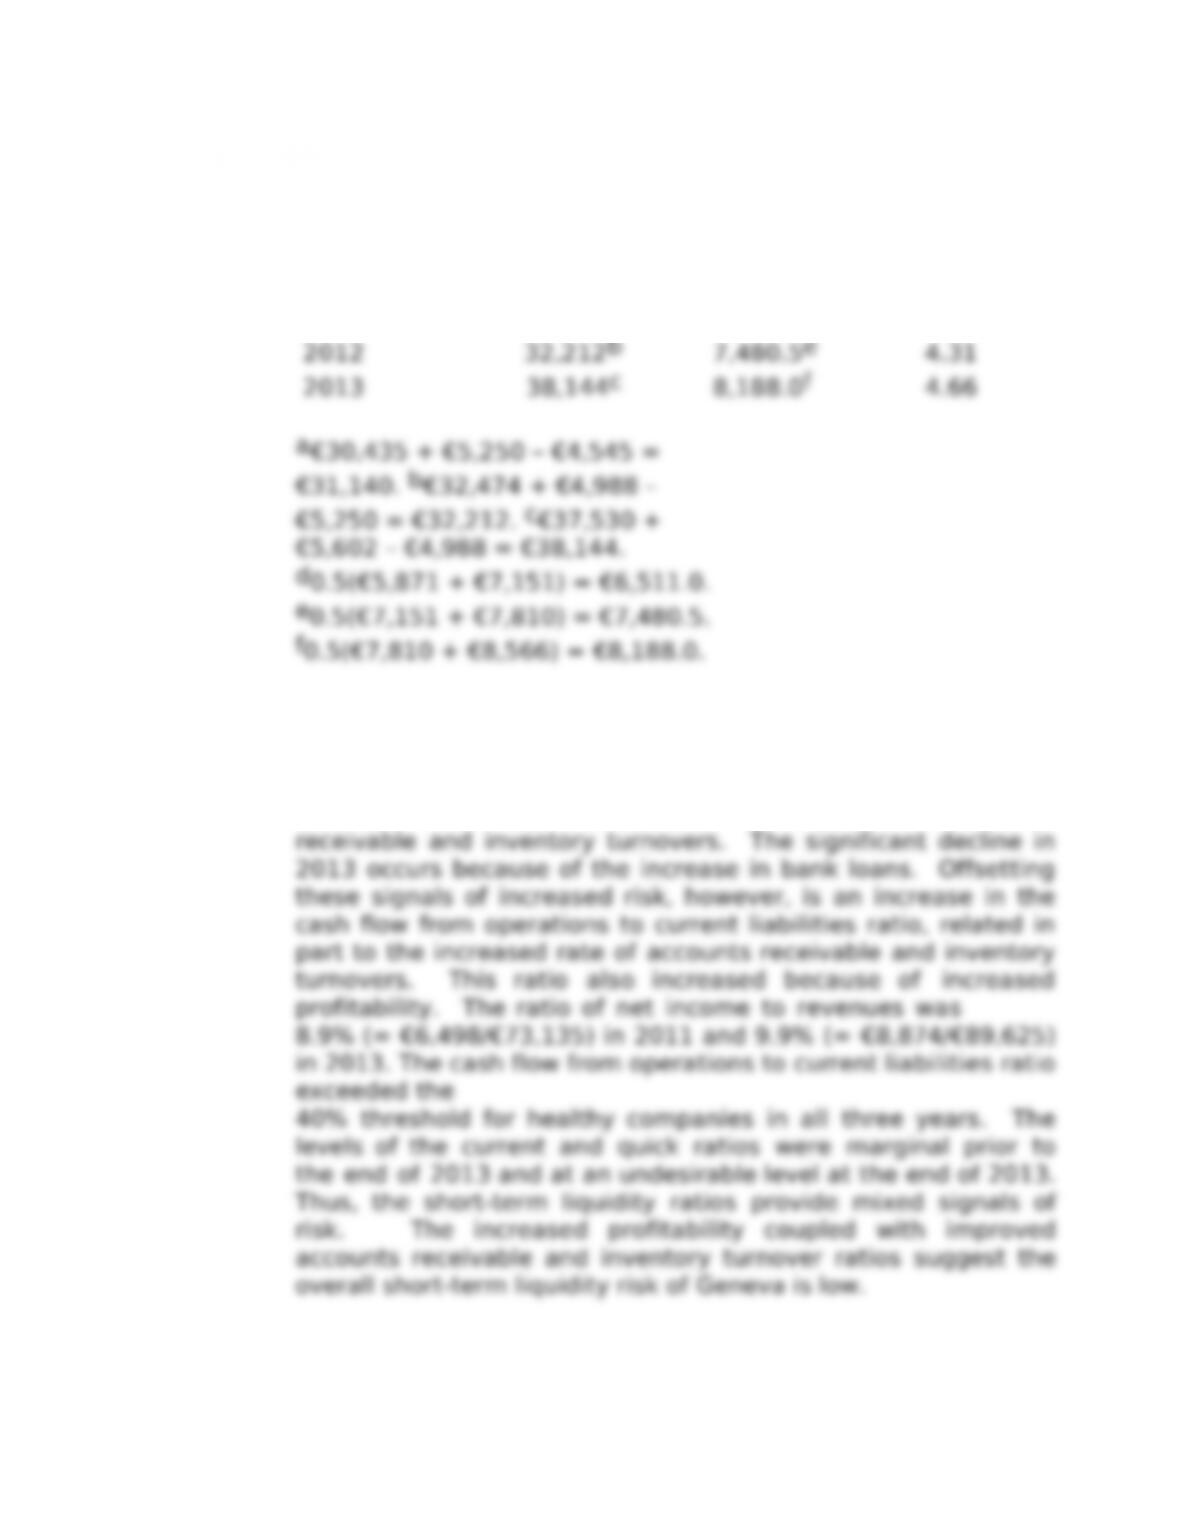
2011 € 31,140a€ 6,511.0d4.78
7-14
c. The current and quick ratios both declined during the last four
years, with a significant decline in 2013. The gradual decline
over time occurs in part because of the increase in the accounts
7.21 (Kyoto Electric; calculating and interpreting long-term liquidity
ratios.) (amounts in billions of Japanese yen)
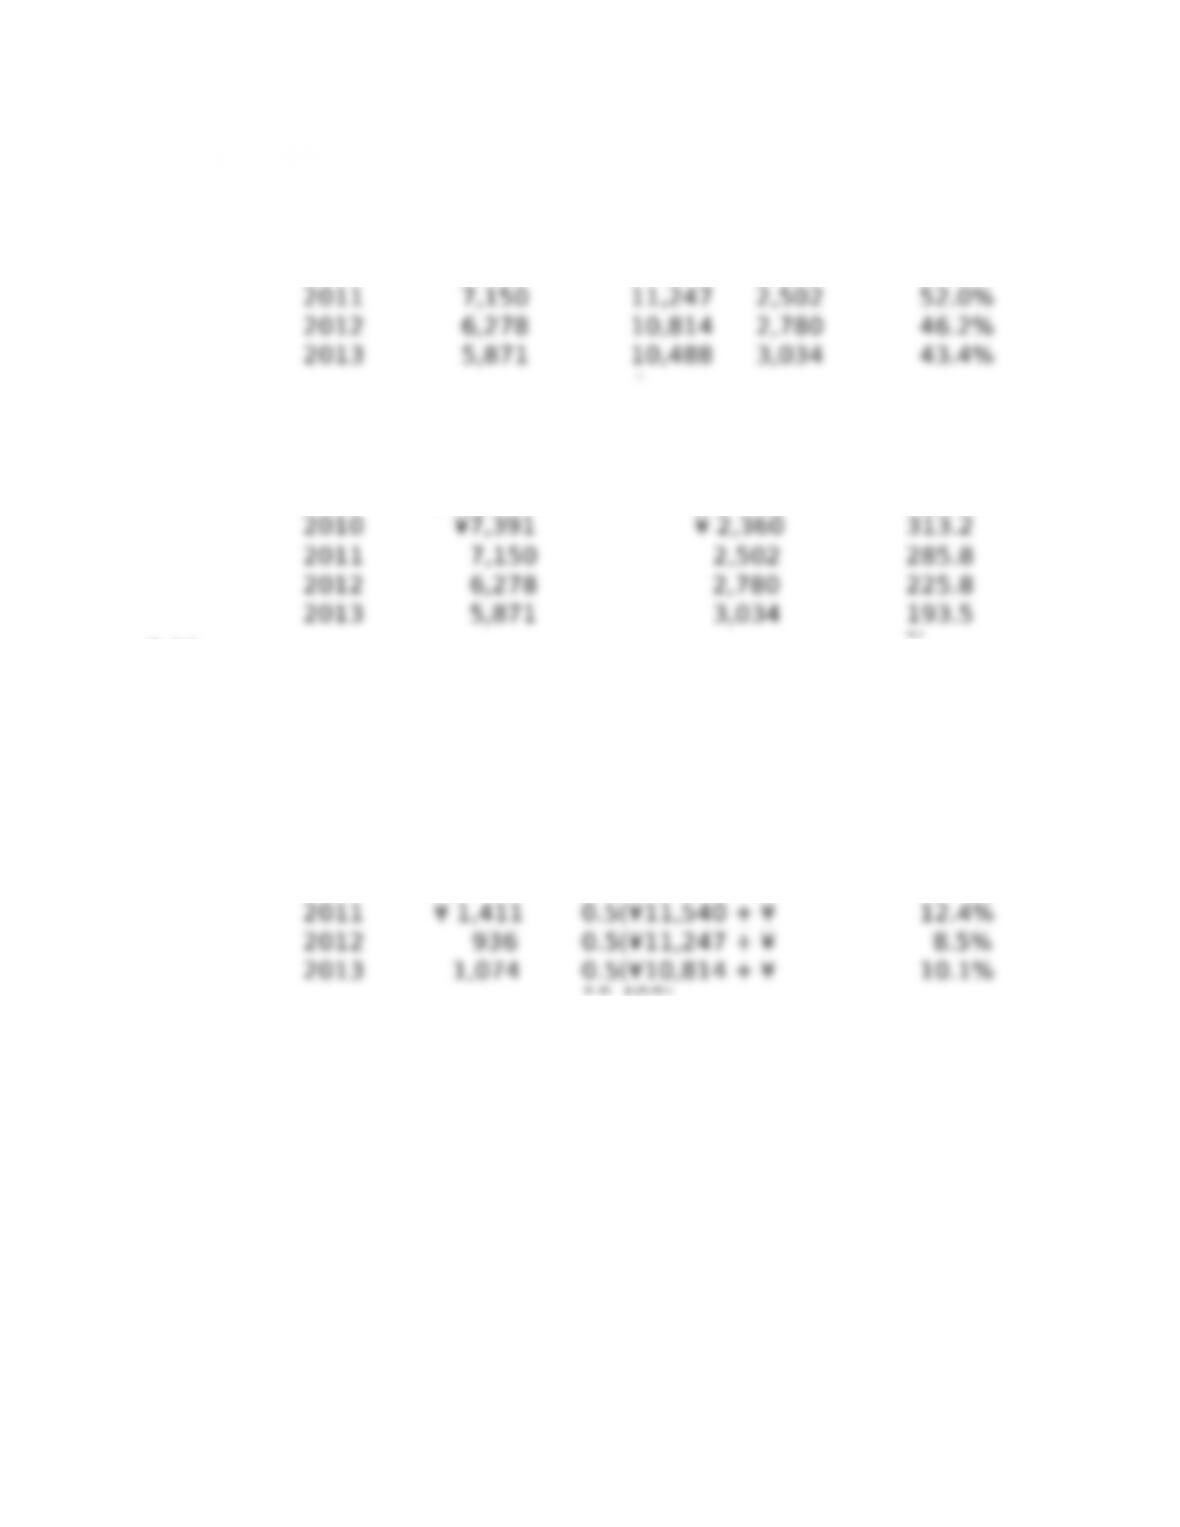
a. Long-Term Debt Ratio
7.6 continued.
Long-Ter
m
Year Numerator Denominator
Debt
Ratio
2010 ¥7,391
¥11,540
+
¥ 2,360 53.2%
2011 7,150
11,247
+
2,502 52.0%
2012 6,278
10,814
+
2,780 46.2%
2013 5,871
10,488
+
3,034 43.4%
Debt-Equity Ratio
De
bt
–
Eq
ui
ty
Year Numerator Denominator Ratio
%
2012 6,278 2,780
225.8
%
2013 5,871 3,034
193.5
%
7-15Solutions
b. Cash Flow from Operations to Total Liabilities Ratio
Cash Flow
from
Operation
s
to Total
Liabilities
Year Numerator Denominator Ratio
0.5(¥11,540 + ¥
0.5(¥11,247 + ¥
0.5(¥10,814 + ¥
0.5(¥11,540 + ¥
0.5(¥11,247 + ¥
0.5(¥10,814 + ¥
285.8
285.8
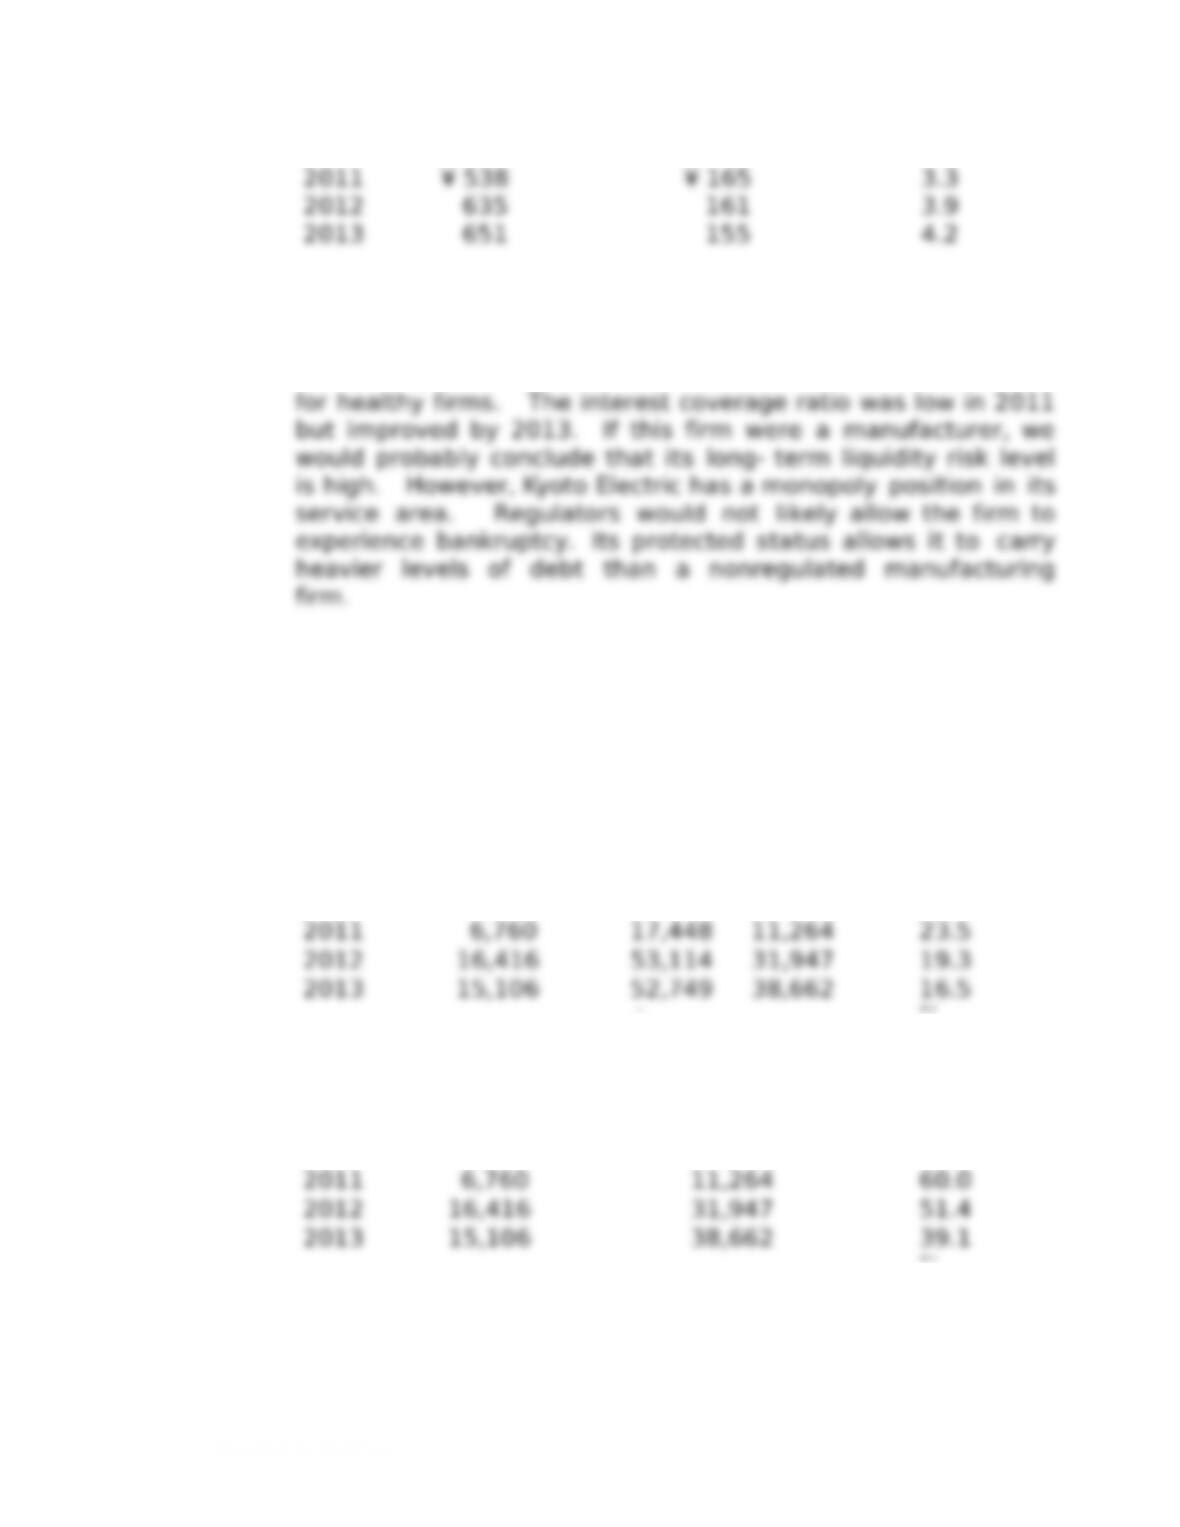
Year Numerator Denominator Ratio Earned
2011 ¥ 538 ¥ 165 3.3
2012 635 161 3.9
2013 651 155 4.2
c. The proportion of long-term debt in the capital structure
declined during the three-year period, but still appears to be
at a high level. The cash flow from operations to average total
liabilities ratio is low, relative to the 20% level commonly found
Solutions7-16
7.22 (Arctagon; calculating and interpreting long-term liquidity ratios.)
(amounts in millions of euros)
a. Long-Term Debt Ratio
L
o
n
g
-Ter
m
Year Numerator Den
om
in
ato
r Debt
Rat
i
o
2010 € 1,206 € 7,76
0
€ 4,301 10.0
© 2013 Cengage Learning. All
r
ights reserved. No
d
is
t
r
ibution allowed without express
a
u
t
hor
ization.
Liabilities
Year Numerator Denominator Ratio
2011 € 6,034
0.5(€ 7,760 + €
47.9%
52,749)
7.25 a.
continued.
Interest Coverage Ratio
Interest Coverage
Year Numerator Denominator Ratio
2011 € 4,160 € 404 1
0.
3
2012 6
,
624 895 7
.
4
2013 11,538 676
17.
1
7-17Solutions
7.22 continued.
c. The long-term debt levels increased significantly during 2011
but steadily declined during 2012 and 2013. Despite the
decline in the debt ratios, the cash flow from operations to
total liabilities ratio declined during the three-year period and
was less than the 20% benchmark for a healthy company at
the end of 2013. The interest coverage ratio is at a healthy
level in all three years. This problem illustrates the
dificulties encountered interpreting financial ratios based on
average amounts for a year when a significant increase
occurs in the numerator or denominator. This problem also
shows the importance of assessing profitability in concert
with assessing risk. Although the long-term debt ratios appear
low for a capital-intensive company, steel companies
experience variations in sales with changes in economic
activity. Because of their high levels of fixed costs, net
income will vary with changes in sales and decrease the level
of long- term debt considered desirable.
7.23 (Effect of various transactions on financial statement ratios.)
Return on Current Liabilities
to
Transaction Equity Ratio
Assets
Ratio
a. No Efect (1) Increase
(1) The current ratio remains the same if it was one to one
Decreas
No
Decreas
No
Decreas
Decreas
No
Decreas
No
Decreas
7.25 a.
prior to the transaction, decreases if it was greater than
(2) The current ratio remains the same if it was equal to one
Solutions7-18
7.24 (Effect of various transactions on financial statement ratios.)
Transaction
Working
Capital
Quick
Ratio
a.
b.
c.
d.
e.
f.
Increas
e
Decreas
e No
Efect
Increase
No
Efect
Increas
e
Decrease
Decrease
Increase
Increase
Decrease
*
*Assumption that quick ratio of acquired business is 0.75 or
greater;
7.25 (Bullseye Corporation; calculating and interpreting profitability
and risk ratios in a time series setting.) (amounts in millions of
US$)
© 2013 Cengage Learning. All
r
ights reserved. No
d
is
t
r
ibution allowed without express
a
u
t
hor
ization.
Year Numerator Denominator Turnover
Ratio
2011 $ 7,624 $ 1,730.5a
7-11Solutions
7.19 b. continued.Accounts Payable Turnover Ratio
Accounts Payable
Year Numerator Denominator Turnover Ratio
2011 $ 7,785a$ 777.5d10.01
c.
significantly during the three-year period. The current and
quick
ratios fluctuated but are well above 1.0. Its cash flow from
2012. The increasing profit margin ultimately provides more
cash than if the profit margin had remained stable.
© 2013 Cengage Learning. All
r
ights reserved. No
d
is
t
r
ibution allowed without express
a
u
t
hor
ization.
7.20 (Geneva, S.A.; calculating and interpreting short-term liquidity
ratios.) (amounts in millions of euros)
a. Current Ratio
Year Numerator Denominator Current
Ratio
2010 € 22,828 € 18,811 1
.
21
Solutions7-12
7.20 a. continued.
Quick Ratio
Year Numerator Denominator Quick
b. Cash Flow from Operations to Current Liabilities Ratio
Cash Flow
from
Operation
s
to
Current
Liabilities
Year Numerator Denominator Ratio
Accounts Receivable Turnover
Ratio
A
cc
o
un
t
s
R
ecei
vab
l
e
© 2013 Cengage Learning. All
r
ights reserved. No
d
is
t
r
ibution allowed without express
a
u
t
hor
ization.
Year Numerator Denominator Turnover
Ratio
7-1Solutions
7.20 b. continued.
Inventory Turnover
Ratio Inventory
Year Numerator Denominator Turnover
Ratio
7.5 continued.
Accounts Payable Turnover Ratio
Accounts Payable
Year Numerator Denominator Turnover Ratio
2011 € 31,140a€ 6,511.0d4.78
7-14
c. The current and quick ratios both declined during the last four
years, with a significant decline in 2013. The gradual decline
over time occurs in part because of the increase in the accounts
7.21 (Kyoto Electric; calculating and interpreting long-term liquidity
ratios.) (amounts in billions of Japanese yen)
a. Long-Term Debt Ratio
7.6 continued.
Long-Ter
m
Year Numerator Denominator
Debt
Ratio
2010 ¥7,391
¥11,540
+
¥ 2,360 53.2%
2011 7,150
11,247
+
2,502 52.0%
2012 6,278
10,814
+
2,780 46.2%
2013 5,871
10,488
+
3,034 43.4%
Debt-Equity Ratio
De
bt
–
Eq
ui
ty
Year Numerator Denominator Ratio
%
2012 6,278 2,780
225.8
%
2013 5,871 3,034
193.5
%
7-15Solutions
b. Cash Flow from Operations to Total Liabilities Ratio
Cash Flow
from
Operation
s
to Total
Liabilities
Year Numerator Denominator Ratio
Year Numerator Denominator Ratio Earned
2011 ¥ 538 ¥ 165 3.3
2012 635 161 3.9
2013 651 155 4.2
c. The proportion of long-term debt in the capital structure
declined during the three-year period, but still appears to be
at a high level. The cash flow from operations to average total
liabilities ratio is low, relative to the 20% level commonly found
Solutions7-16
7.22 (Arctagon; calculating and interpreting long-term liquidity ratios.)
(amounts in millions of euros)
a. Long-Term Debt Ratio
L
o
n
g
-Ter
m
Year Numerator Den
om
in
ato
r Debt
Rat
i
o
2010 € 1,206 € 7,76
0
€ 4,301 10.0
© 2013 Cengage Learning. All
r
ights reserved. No
d
is
t
r
ibution allowed without express
a
u
t
hor
ization.
Liabilities
Year Numerator Denominator Ratio
2011 € 6,034
0.5(€ 7,760 + €
47.9%
52,749)
7.25 a.
continued.
Interest Coverage Ratio
Interest Coverage
Year Numerator Denominator Ratio
2011 € 4,160 € 404 1
0.
3
2012 6
,
624 895 7
.
4
2013 11,538 676
17.
1
7-17Solutions
7.22 continued.
c. The long-term debt levels increased significantly during 2011
but steadily declined during 2012 and 2013. Despite the
decline in the debt ratios, the cash flow from operations to
total liabilities ratio declined during the three-year period and
was less than the 20% benchmark for a healthy company at
the end of 2013. The interest coverage ratio is at a healthy
level in all three years. This problem illustrates the
dificulties encountered interpreting financial ratios based on
average amounts for a year when a significant increase
occurs in the numerator or denominator. This problem also
shows the importance of assessing profitability in concert
with assessing risk. Although the long-term debt ratios appear
low for a capital-intensive company, steel companies
experience variations in sales with changes in economic
activity. Because of their high levels of fixed costs, net
income will vary with changes in sales and decrease the level
of long- term debt considered desirable.
7.23 (Effect of various transactions on financial statement ratios.)
Return on Current Liabilities
to
Transaction Equity Ratio
Assets
Ratio
a. No Efect (1) Increase
(1) The current ratio remains the same if it was one to one
7.25 a.
prior to the transaction, decreases if it was greater than
(2) The current ratio remains the same if it was equal to one
Solutions7-18
7.24 (Effect of various transactions on financial statement ratios.)
Transaction
Working
Capital
Quick
Ratio
a.
b.
c.
d.
e.
f.
Increas
e
Decreas
e No
Efect
Increase
No
Efect
Increas
e
Decrease
Decrease
Increase
Increase
Decrease
*
*Assumption that quick ratio of acquired business is 0.75 or
greater;
7.25 (Bullseye Corporation; calculating and interpreting profitability
and risk ratios in a time series setting.) (amounts in millions of
US$)