© 2013 Cengage Learning. All
r
ights reserved. No
d
is
t
r
ibution allowed without express
a
u
t
hor
ization.
© 2013 Cengage Learning. All
r
ights reserved. No
d
is
t
r
ibution allowed without express
a
u
t
hor
ization.
7.7 Management strives to keep its inventories at a level that is
7.8 The rate of return on equity exceeds (is less than) the rate of
7.9 It would be unusual to have a firm generate superior performance
on both the profit margin and asset turnover dimension. The
reason is that these two ratios typically reflect tradeoffs that are
either imposed on the firm by industry forces (such as barriers to
entry) or by the business models that work well in the industry. For
Solutions7-2
7.10 A firm cannot continually increase the amount of debt in the
capital structure without limit. Increasing the debt level increases
the risk to the common shareholders. These shareholders will not
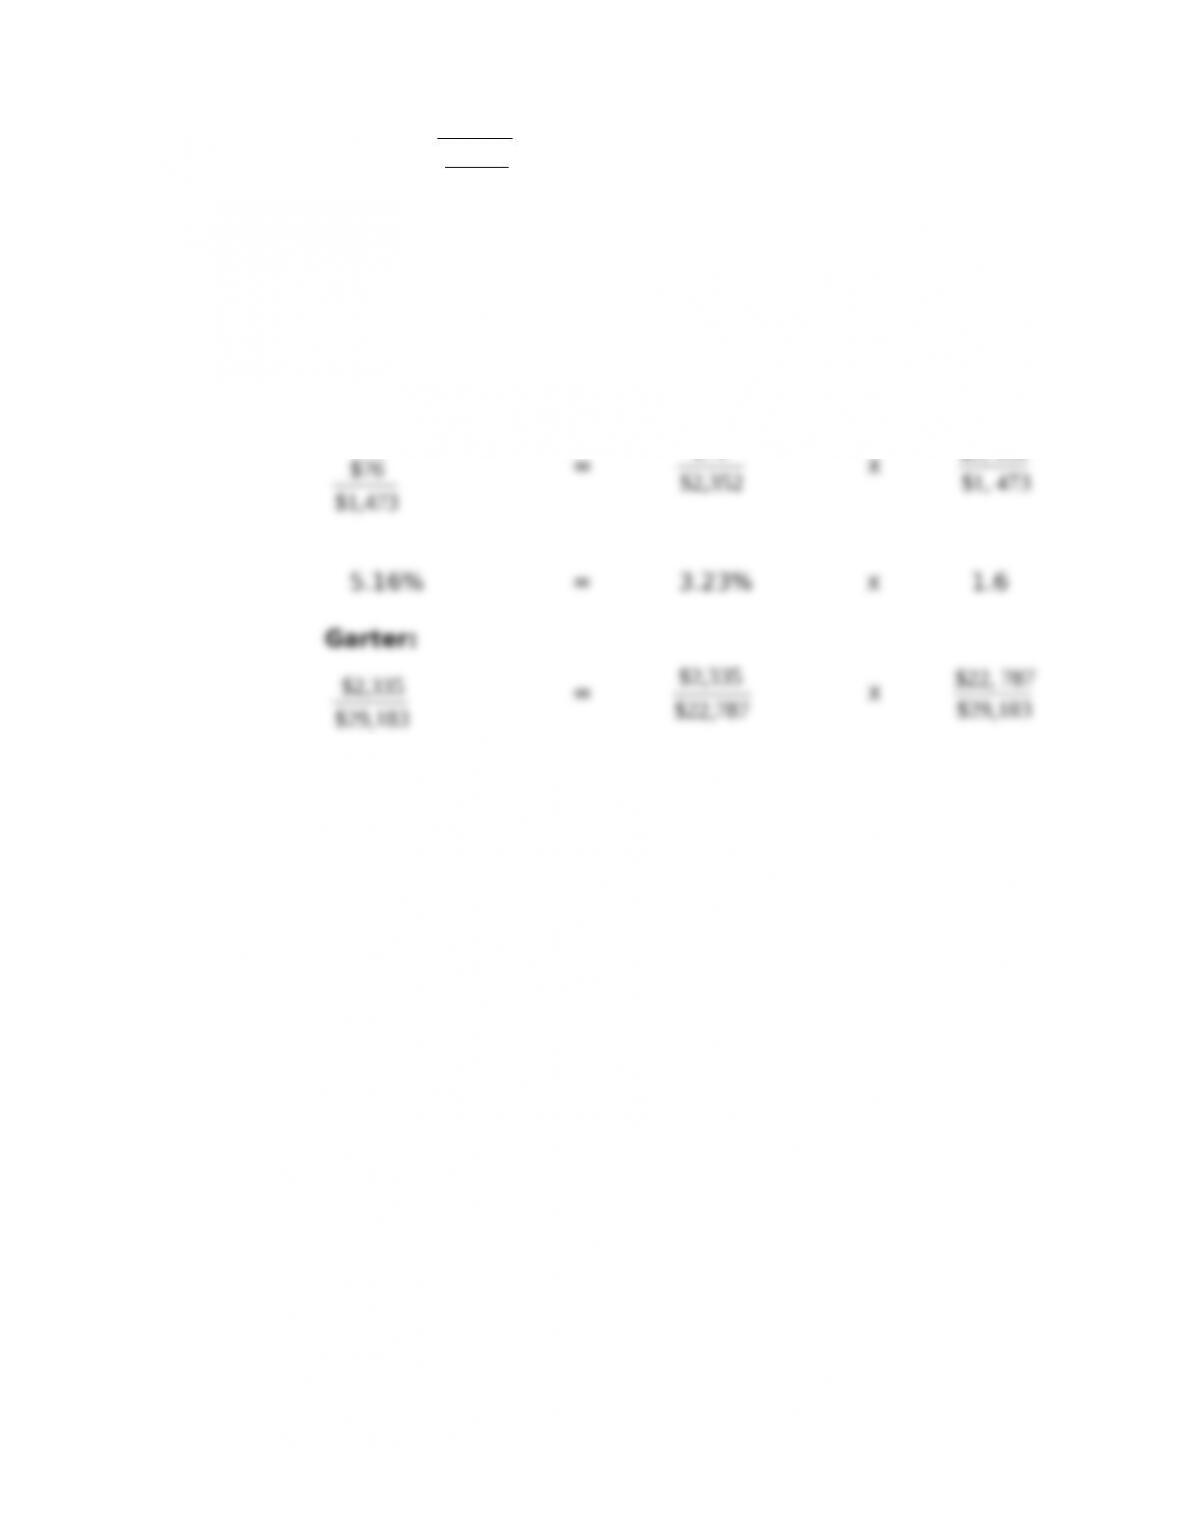
7.11 (Calem and Garter; calculating and disaggregating rate of
return on assets.) (amounts in millions of US$)
a. Calem:
© 2013 Cengage Learning. All
r
ights reserved. No
d
is
t
r
ibution allowed without express
a
u
t
hor
ization.
Garter
:
$76
$1,473
$2,335
$29,183
= 5.16%.
= 8.00%.
b. Total
Assets
Return on Assets = Profit Margin
X
Turnover
Ratio
Ca
le
m:
$2,
352
$29,183
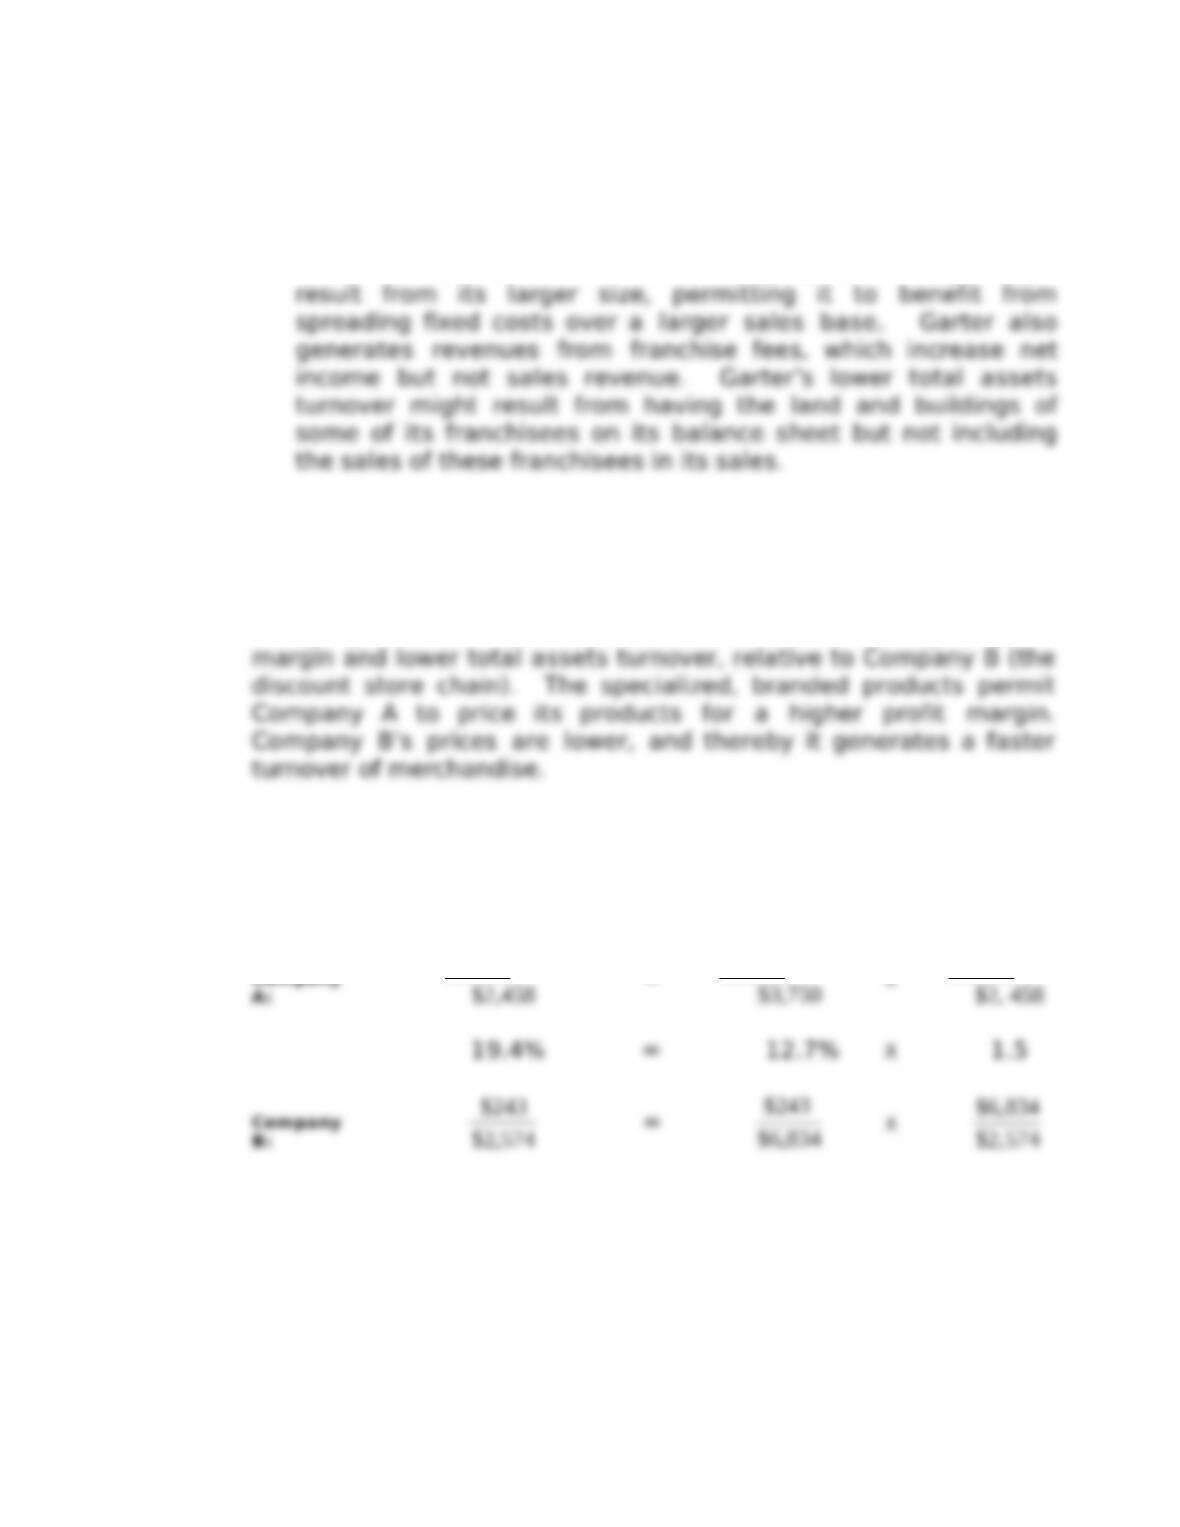
8.00%=10.24%X 0.8
c. Garter has a higher ROA, the result of a higher profit offset by a
lower total assets turnover. Garter’s higher profit margin might
7-3Solutions
7.12 (Profitability analysis for two types of retailers.) (amounts in
millions of
US$)
Company A is the specialty retailer because of its higher profit
Total
Assets
Turnover
Ratio
Company
$476
X
$3,
750
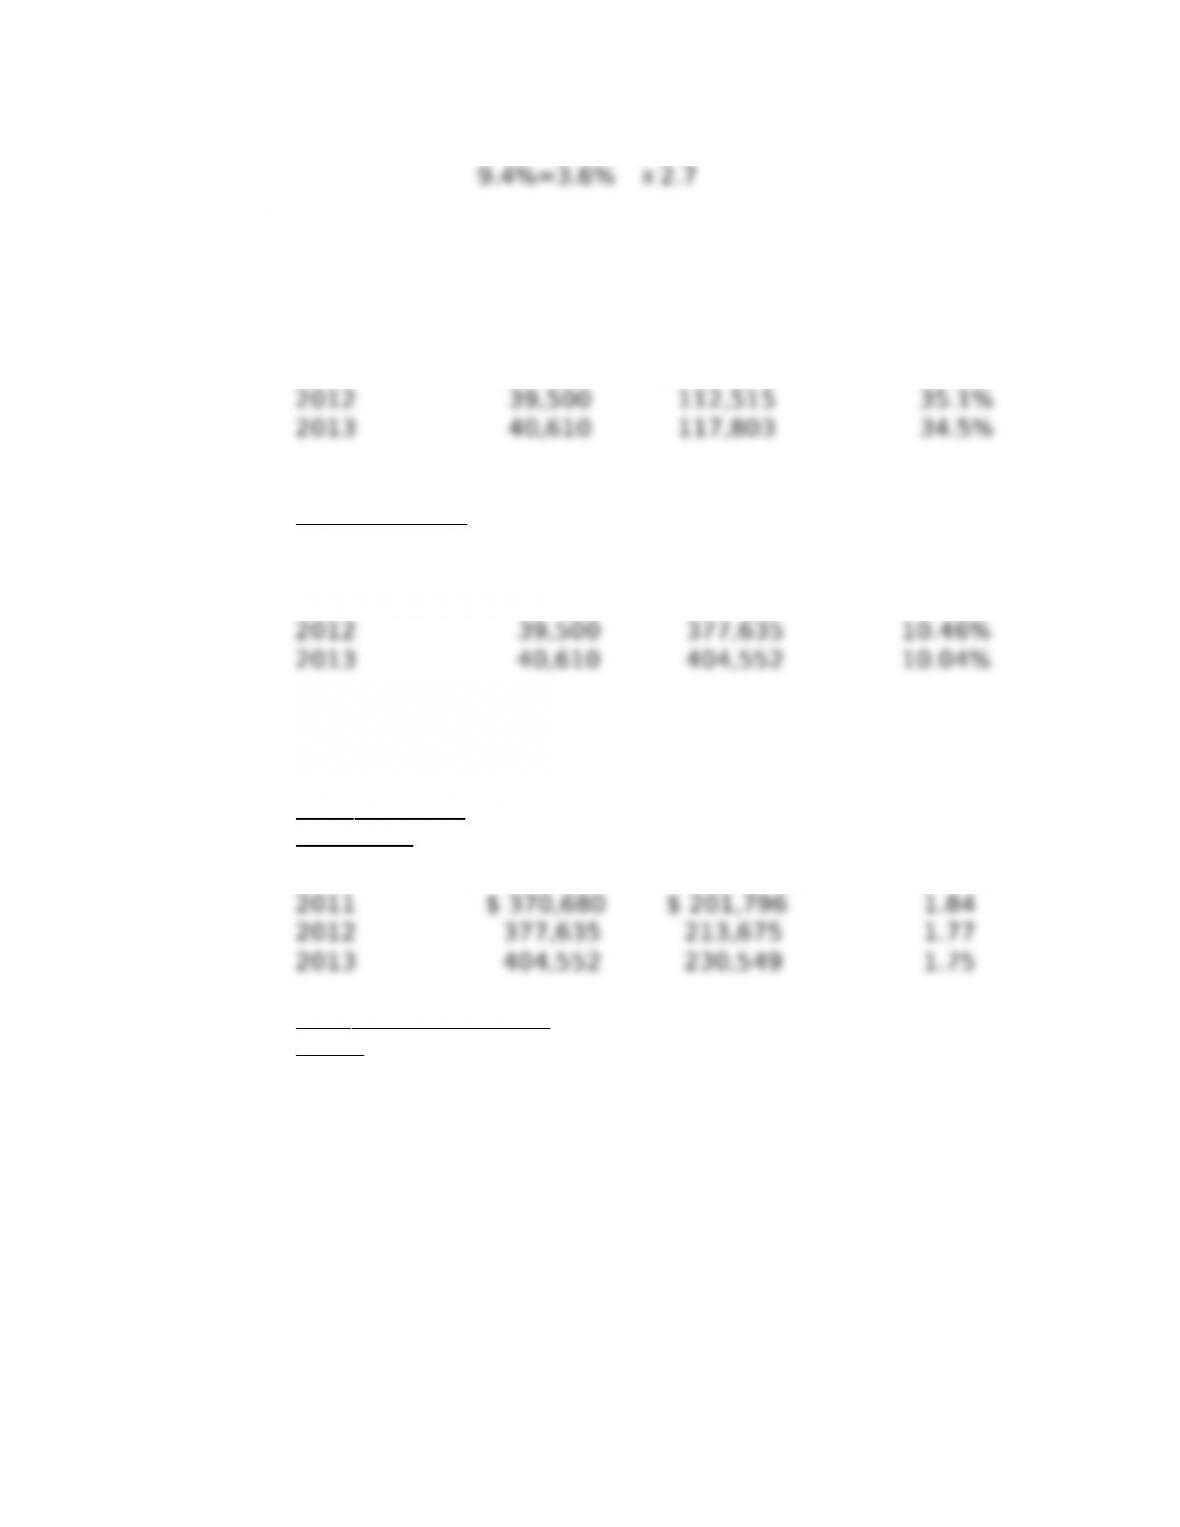
7.13 (Mobilex; calculating and disaggregating rate of return on
common shareholders’ equity.) (amounts in millions of US$)
a. Return
on
Year Numerator Denominator Equity
2011 $ 36,130 $ 106,471 33.9%
b. Pr o
f i
t M a r g i n
Year
2011
Nu
m
er
ato
r
$
Denominator
$ 370,680
Profit
Ma
r
g
in
Solutions7-4
7.13 b. continued.
T o
t a l A ss e
t s
T u r n o ve r Total Assets
Year Numerator Denominator Turnover
F i n a n c i a l L e v
e r a g
e
R a t i o Financial
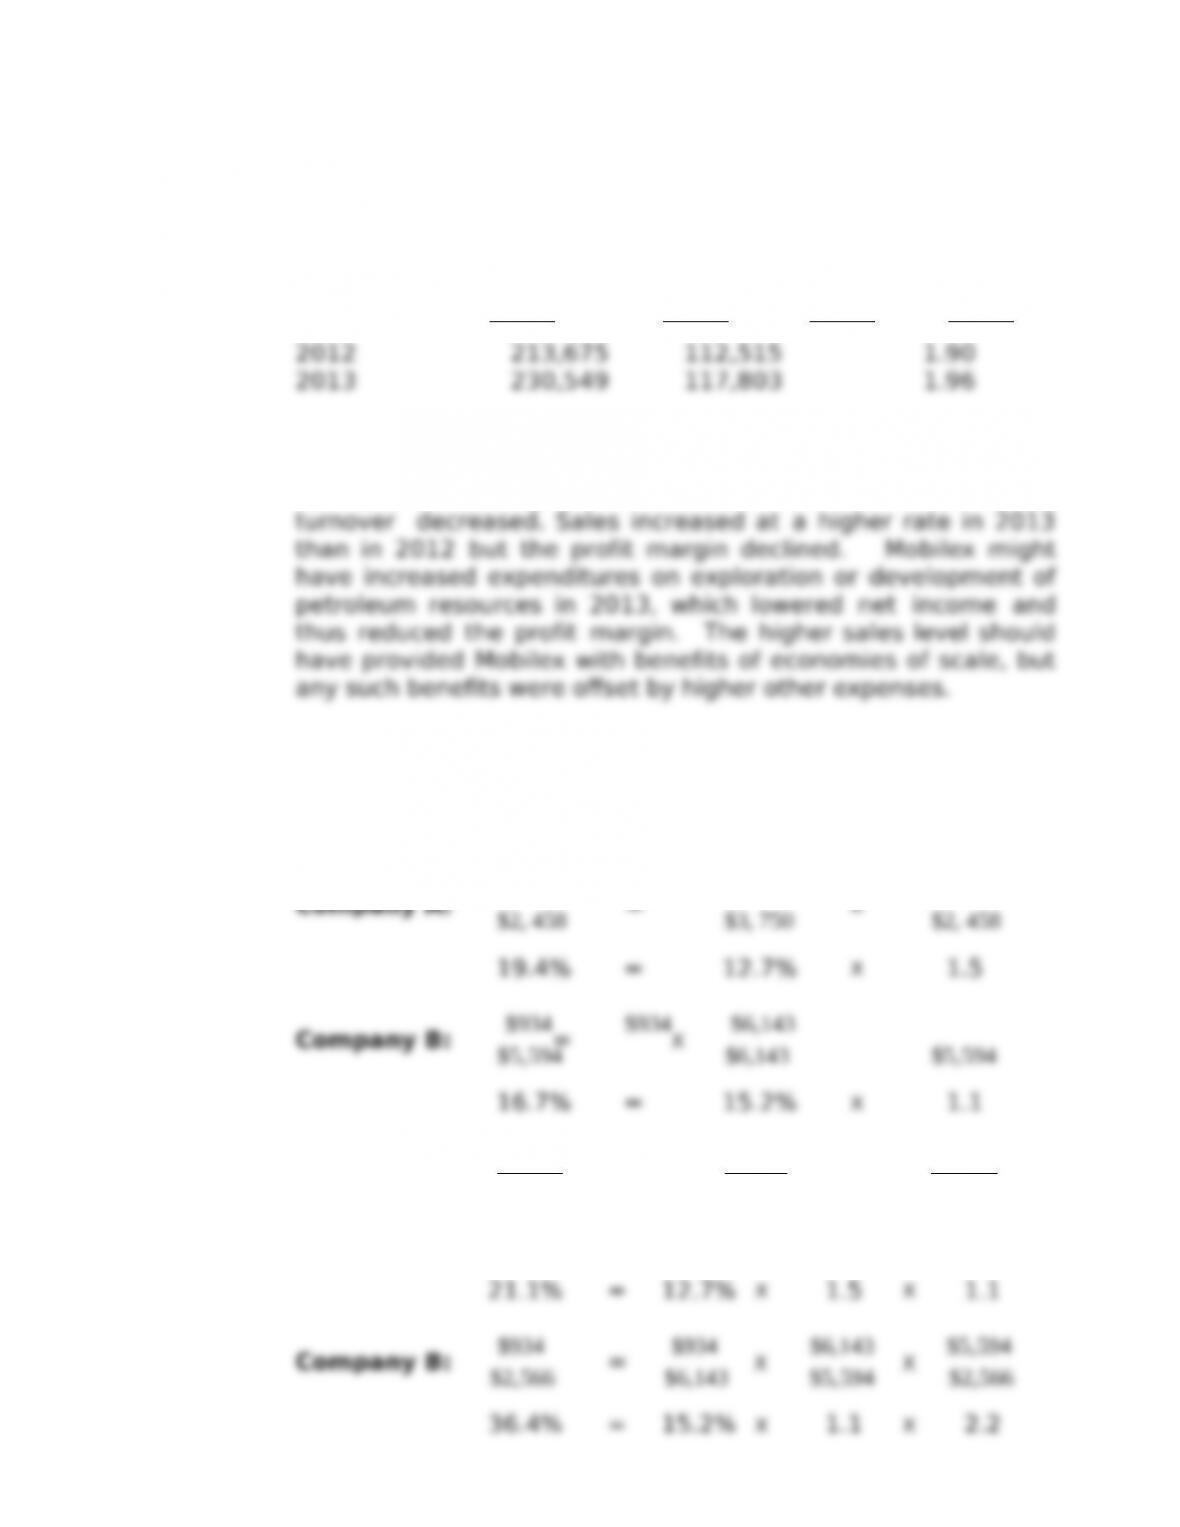
7.6 continued.
b. T
ota
l
X Assets
Turn
ov
er
Fin
a
nci
a
l
X
Leverage
Rat
i
o
Return
o
n
Eq
ui
ty
= Profit
Margin
Retur
n
on
Assets
=
Profit
X
Total
A
sse
t
s
Turn
ov
er
Company A: $476 =$476 X
$3,
750
Year Numerator Denominator Leverage Ratio
2011 $ 201,796 $ 106,471 1.90
c. The rate of return on equity was relatively steady during the
three years. Between 2011 and 2012, the profit margin and
the financial leverage ratio increased but the total assets
7.14 (Profitability analysis for two companies.) (amounts in millions of
US$)
a.
7-5Solutions
Company A: $476
$2,256 =$476
$3,
750
X
$3,
750
$2,
458
X
$2,
458
$2,256
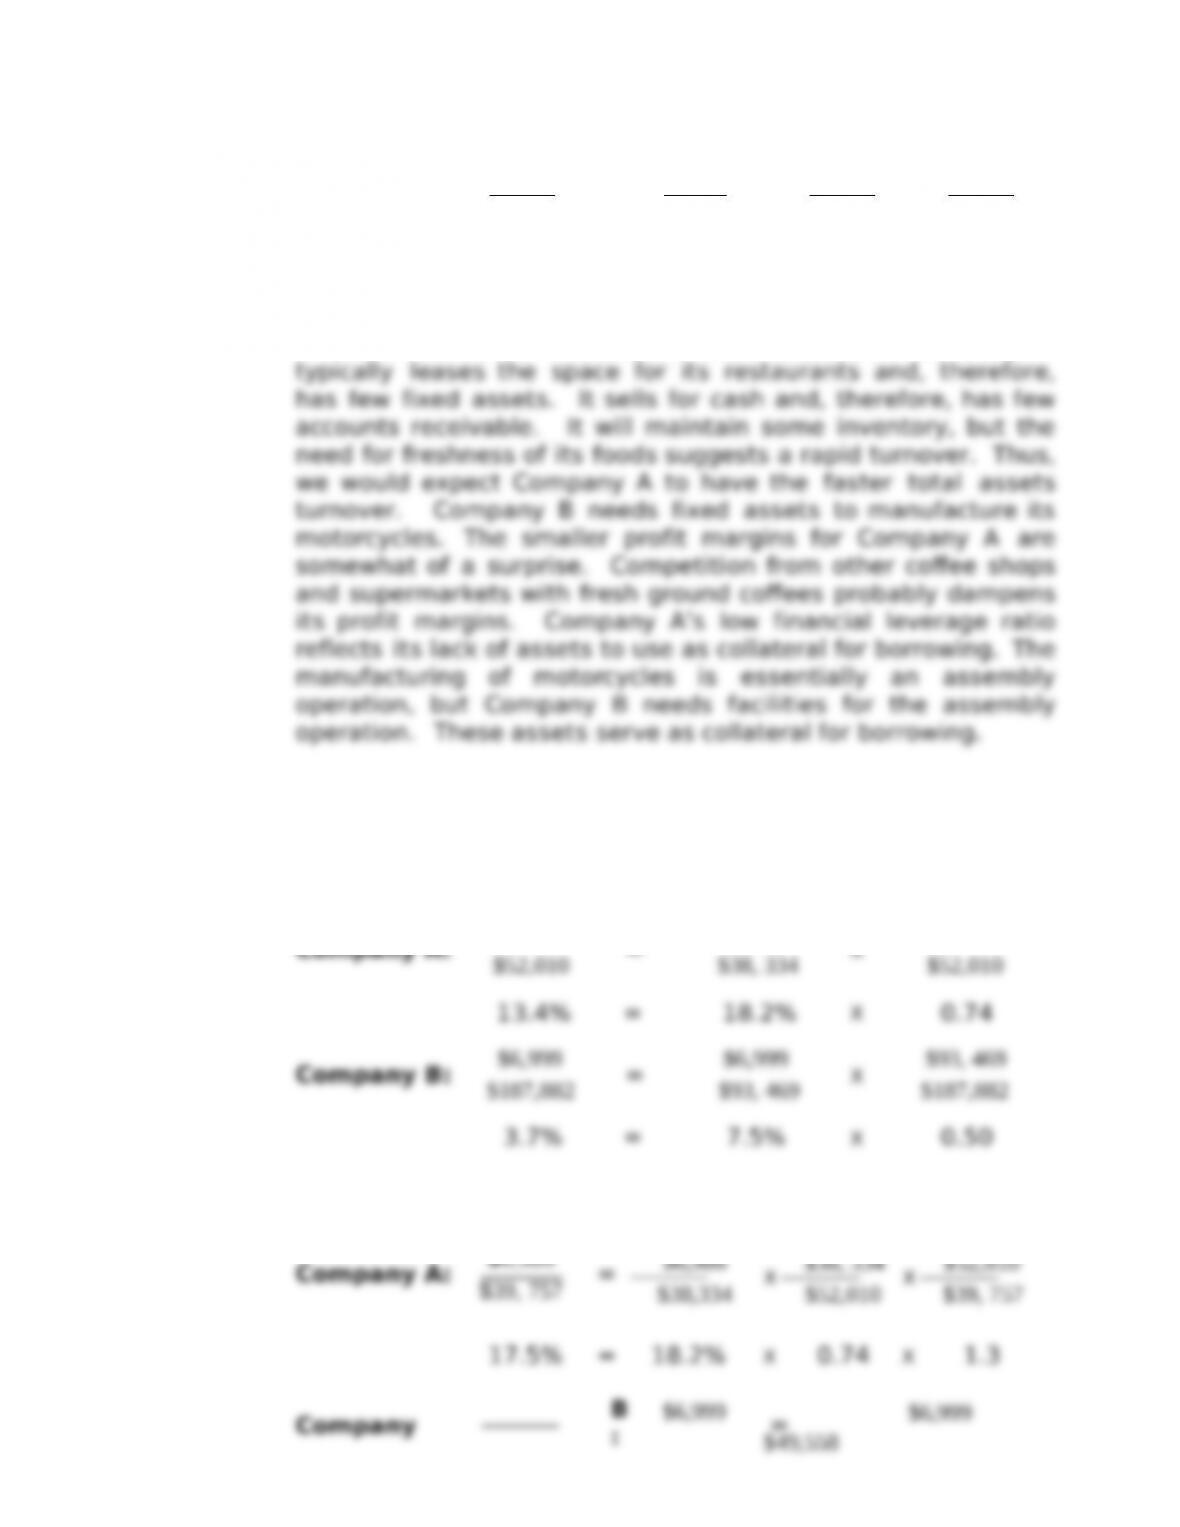
7.7 continued.
b. T
ota
l
X Assets
Turn
ov
er
Fin
a
nci
a
l
X
Leverage
Rat
i
o
Return
o
n
Eq
ui
ty
= Profit
Margin
Retur
n
on
Assets
=
Profit
X
Total
A
sse
t
s
Turn
ov
er
Company A: $6,986 =$6,986 X
$38,
334
c. Company A is the operator of cofee shops, and Company B
is the brand-name motorcycle manufacturer. Company A
7.15 (Profitability analysis for two companies.) (amounts in millions of
US$)
a.
Solutions7-6
$6,986
$38,
334
$52,010

7.8 continued.
b. T
ota
l
X Assets
Turn
ov
er
Fin
a
nci
a
l
X
Leverage
Rat
i
o
Return
o
n
Eq
ui
ty
= Profit
Margin
$93,469
$93,
469
X
$187
,882 $187,882
X
$49,558
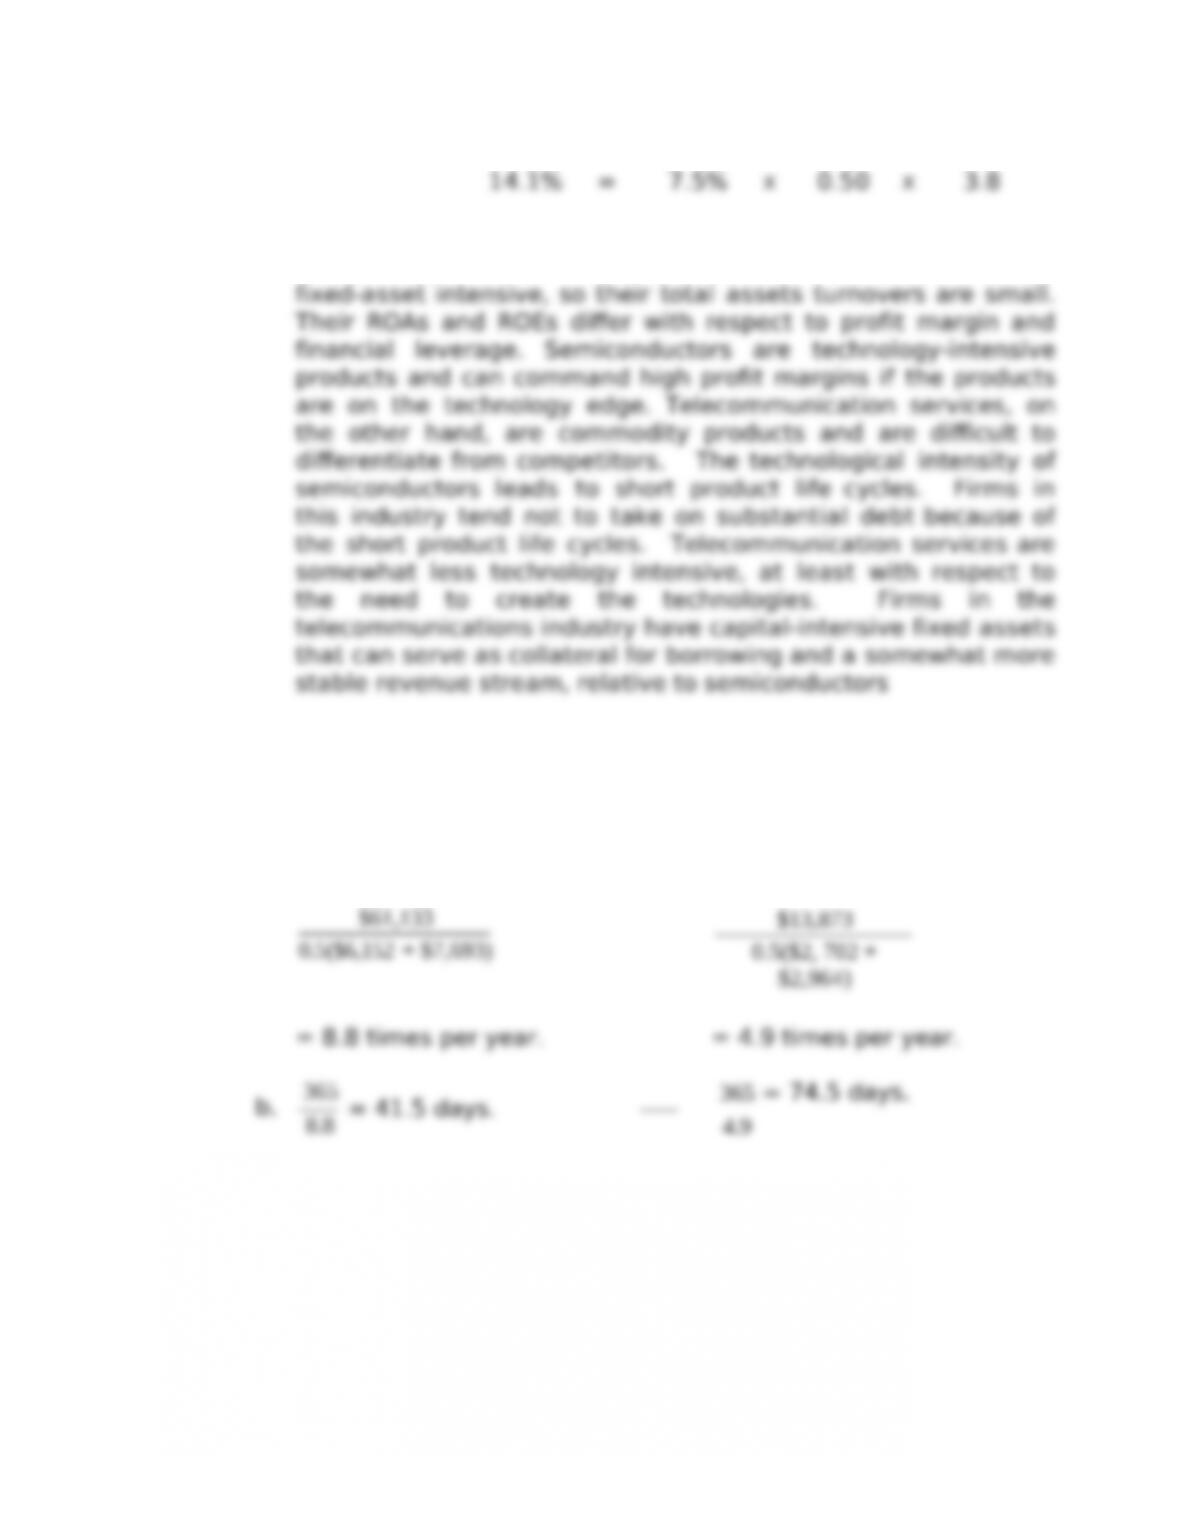
© 2013 Cengage Learning. All
r
ights reserved. No
d
is
t
r
ibution allowed without express
a
u
t
hor
ization.
c. Company A is the semiconductor manufacturer and Company B
is the telecommunications provider. Both of these firms are
7-Solutions
7.16 (Delta, Inc., and SunnyDay Company; analyzing accounts
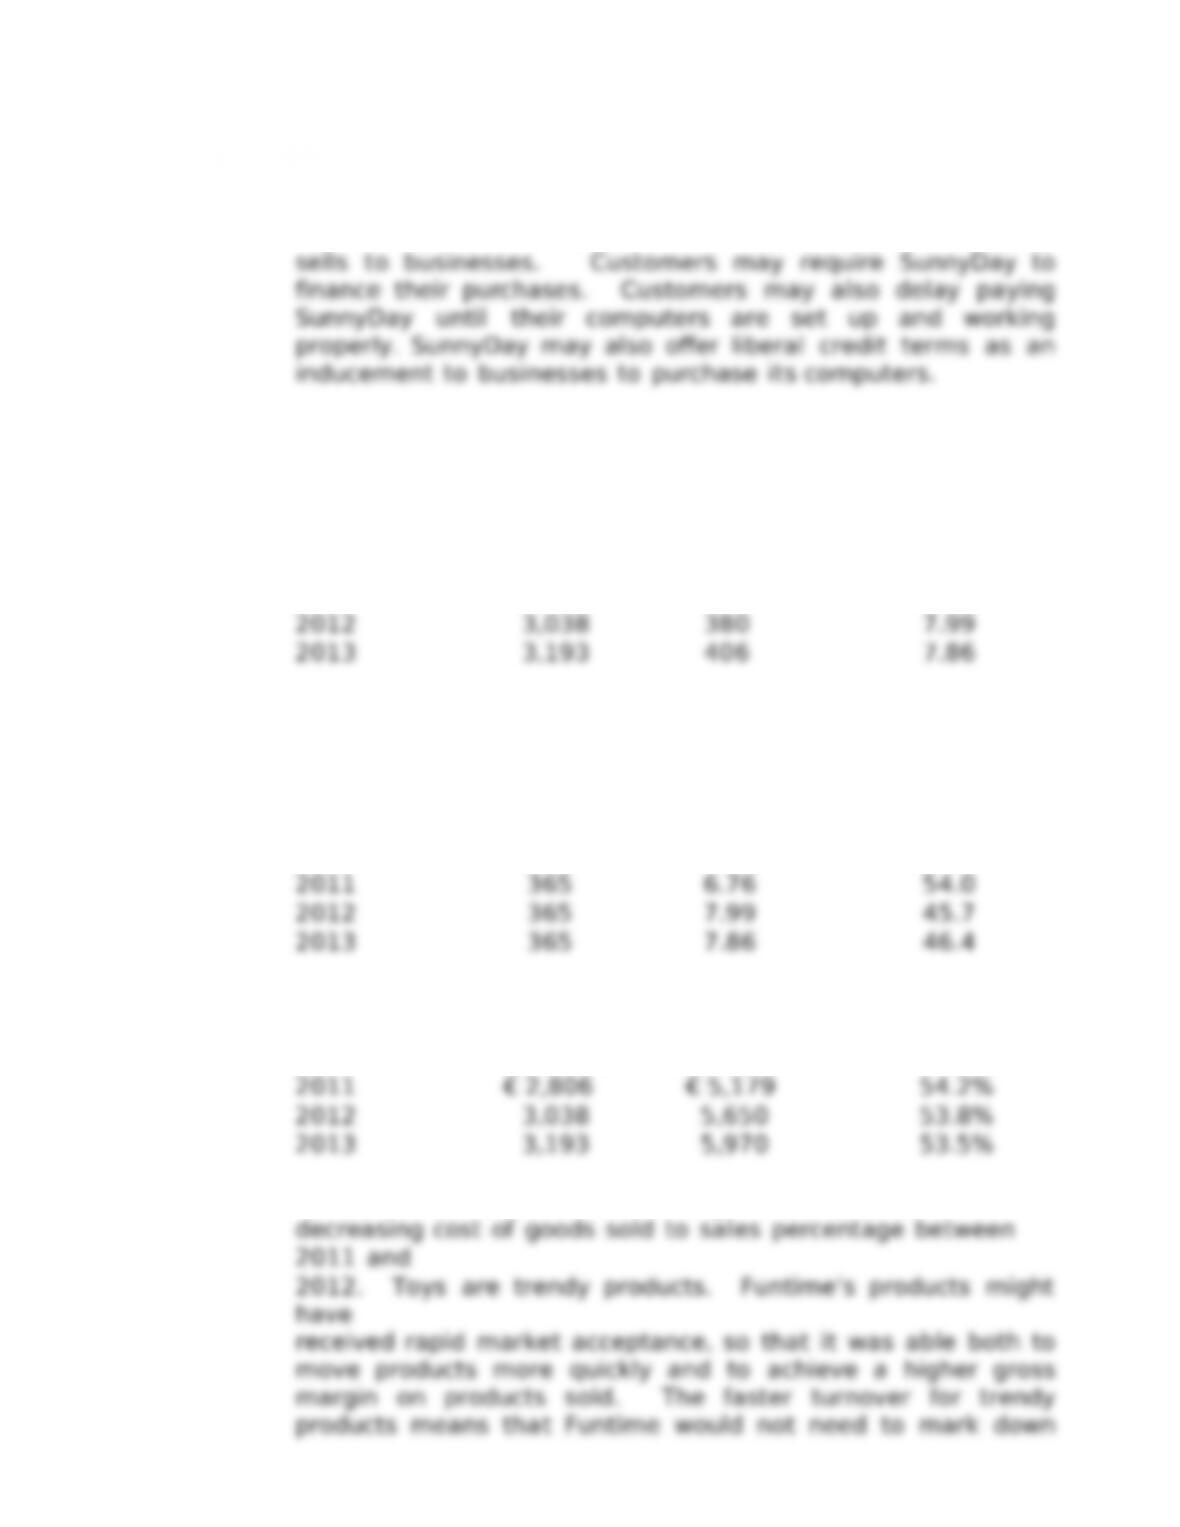
receivable for two companies.) (amounts in millions of US$)
a. Delta, Inc. SunnyDay
b
.
8.8 = 41.5 days. 365
4.9
7.17
continued.
c. Delta sells primarily to individuals who pay with credit cards.
Delta collects these accounts receivable quickly. SunnyDay
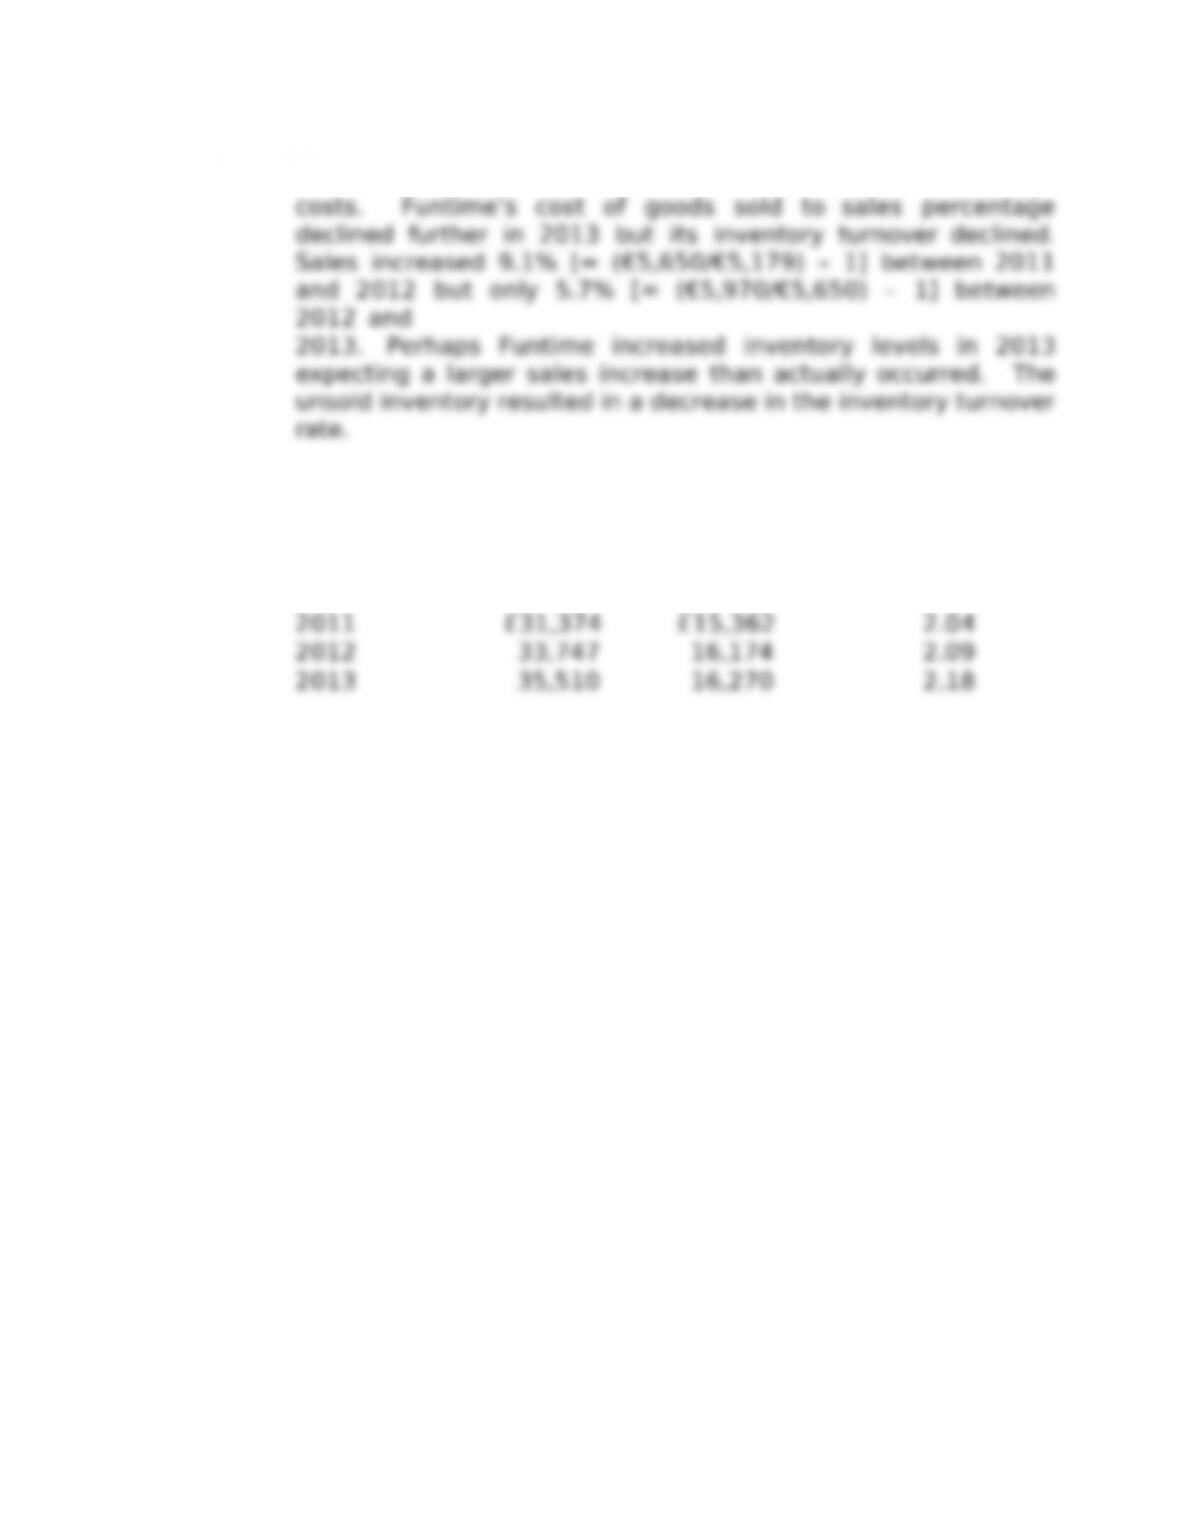
7.17 (Funtime, Inc.; analyzing inventories over three years.)
(amounts
in millions of euros)
a. Invento
r
y
Year Numerator Denominator Turnover
2011 € 2,806 € 415 6.76
Solutions7-8
b.
Year Numerator Denominator
D
ay
s
I
n
v
en
to
r
y
Hel
d
c.
Year Numerator Denominator
Cost o
f
Goods
Sold
d. Funtime experienced an increasing inventory turnover and a
7.18
continued.
products in order to sell them or to incur additional storage
7.18 (Mickey Group; analyzing fixed-asset turnover over three years.)
(amounts in millions of pounds sterling)
a. Fixed
Asset
Year Numerator Denominator Turnover
7-9 Solutions
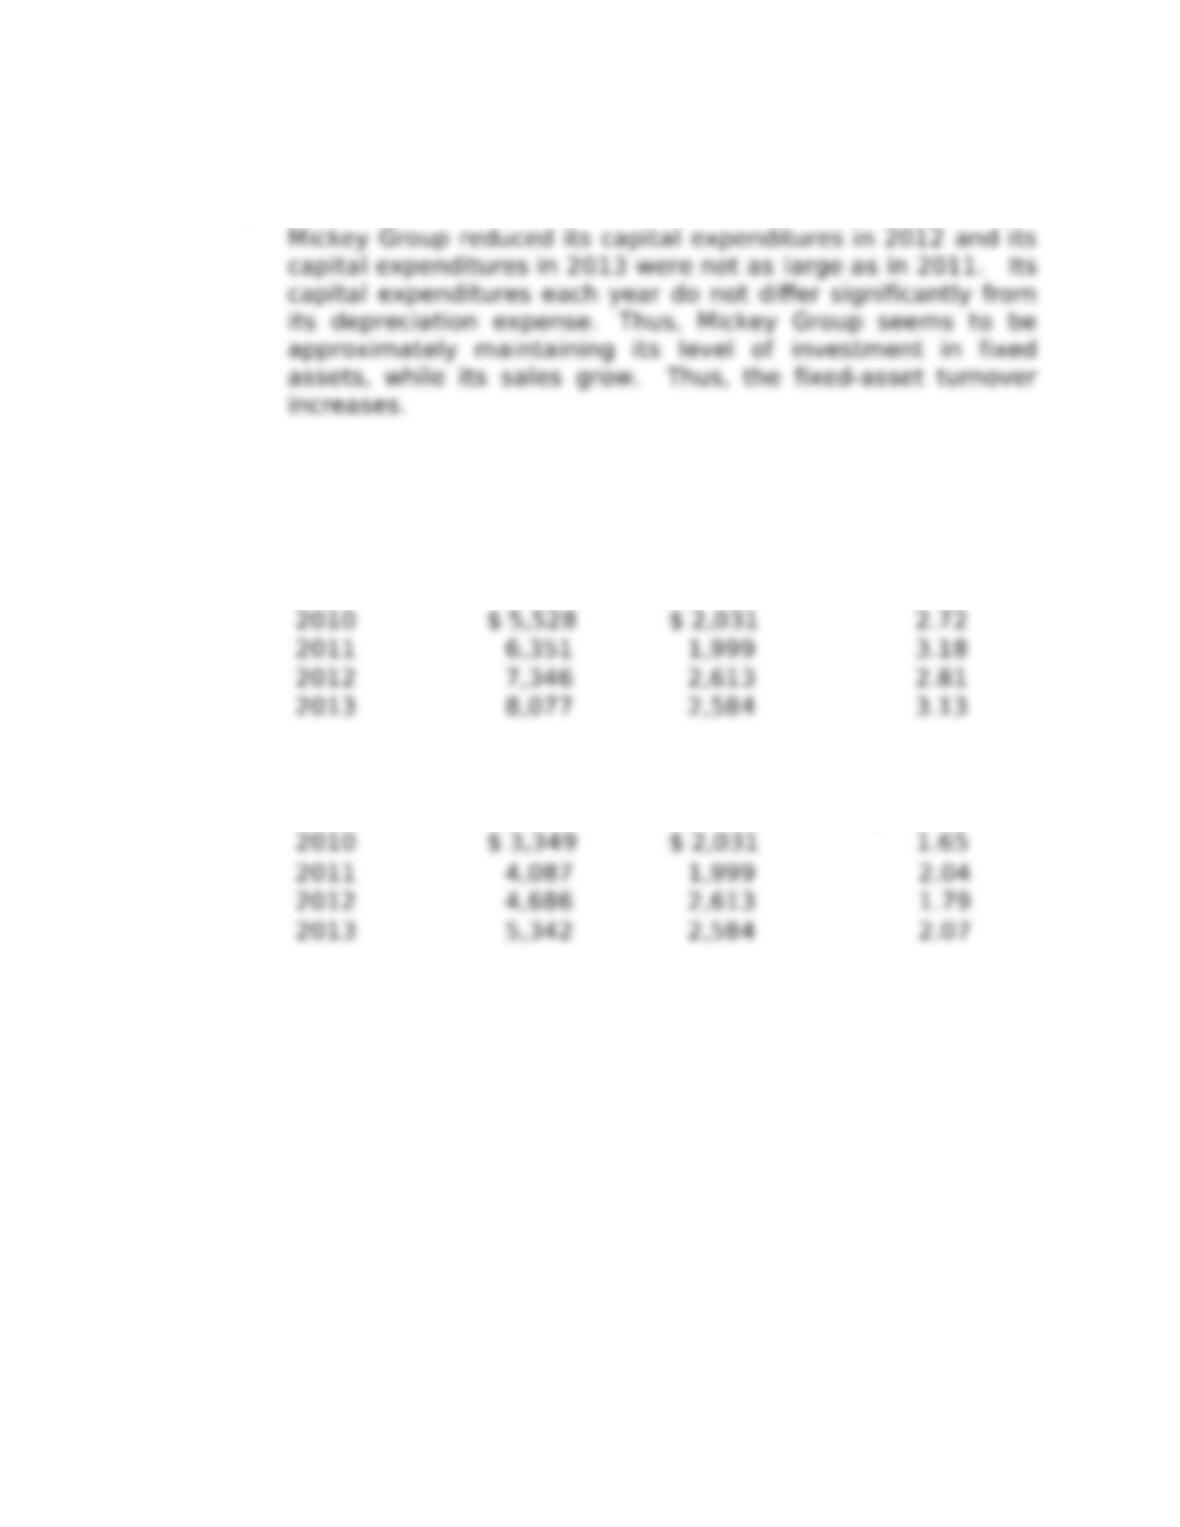
b. The fixed-asset turnover increased during the three-year
period.
7.19 (FleetSneak; calculating and interpreting short-term liquidity
ratios.) (amounts in millions of US$)
a. Current Ratio
Year Numerator Denominator Current
Quick Ratio
Year
Numerator
Denominator
Quick
Rat
i
o
© 2013 Cengage Learning. All
r
ights reserved. No
d
is
t
r
ibution allowed without express
a
u
t
hor
ization.
7.7 Management strives to keep its inventories at a level that is
7.8 The rate of return on equity exceeds (is less than) the rate of
7.9 It would be unusual to have a firm generate superior performance
on both the profit margin and asset turnover dimension. The
reason is that these two ratios typically reflect tradeoffs that are
either imposed on the firm by industry forces (such as barriers to
entry) or by the business models that work well in the industry. For
Solutions7-2
7.10 A firm cannot continually increase the amount of debt in the
capital structure without limit. Increasing the debt level increases
the risk to the common shareholders. These shareholders will not
7.11 (Calem and Garter; calculating and disaggregating rate of
return on assets.) (amounts in millions of US$)
a. Calem:
© 2013 Cengage Learning. All
r
ights reserved. No
d
is
t
r
ibution allowed without express
a
u
t
hor
ization.
Garter
:
$76
$1,473
$2,335
$29,183
= 5.16%.
= 8.00%.
b. Total
Assets
Return on Assets = Profit Margin
X
Turnover
Ratio
Ca
le
m:
$2,
352
$29,183
8.00%=10.24%X 0.8
c. Garter has a higher ROA, the result of a higher profit offset by a
lower total assets turnover. Garter’s higher profit margin might
7-3Solutions
7.12 (Profitability analysis for two types of retailers.) (amounts in
millions of
US$)
Company A is the specialty retailer because of its higher profit
Total
Assets
Turnover
Ratio
Company
$476
X
$3,
750
7.13 (Mobilex; calculating and disaggregating rate of return on
common shareholders’ equity.) (amounts in millions of US$)
a. Return
on
Year Numerator Denominator Equity
2011 $ 36,130 $ 106,471 33.9%
b. Pr o
f i
t M a r g i n
Year
2011
Nu
m
er
ato
r
$
Denominator
$ 370,680
Profit
Ma
r
g
in
Solutions7-4
7.13 b. continued.
T o
t a l A ss e
t s
T u r n o ve r Total Assets
Year Numerator Denominator Turnover
F i n a n c i a l L e v
e r a g
e
R a t i o Financial
7.6 continued.
b. T
ota
l
X Assets
Turn
ov
er
Fin
a
nci
a
l
X
Leverage
Rat
i
o
Return
o
n
Eq
ui
ty
= Profit
Margin
Retur
n
on
Assets
=
Profit
X
Total
A
sse
t
s
Turn
ov
er
Company A: $476 =$476 X
$3,
750
Year Numerator Denominator Leverage Ratio
2011 $ 201,796 $ 106,471 1.90
c. The rate of return on equity was relatively steady during the
three years. Between 2011 and 2012, the profit margin and
the financial leverage ratio increased but the total assets
7.14 (Profitability analysis for two companies.) (amounts in millions of
US$)
a.
7-5Solutions
Company A: $476
$2,256 =$476
$3,
750
X
$3,
750
$2,
458
X
$2,
458
$2,256
7.7 continued.
b. T
ota
l
X Assets
Turn
ov
er
Fin
a
nci
a
l
X
Leverage
Rat
i
o
Return
o
n
Eq
ui
ty
= Profit
Margin
Retur
n
on
Assets
=
Profit
X
Total
A
sse
t
s
Turn
ov
er
Company A: $6,986 =$6,986 X
$38,
334
c. Company A is the operator of cofee shops, and Company B
is the brand-name motorcycle manufacturer. Company A
7.15 (Profitability analysis for two companies.) (amounts in millions of
US$)
a.
Solutions7-6
$6,986
$38,
334
$52,010
7.8 continued.
b. T
ota
l
X Assets
Turn
ov
er
Fin
a
nci
a
l
X
Leverage
Rat
i
o
Return
o
n
Eq
ui
ty
= Profit
Margin
$93,469
$93,
469
X
$187
,882 $187,882
X
$49,558
© 2013 Cengage Learning. All
r
ights reserved. No
d
is
t
r
ibution allowed without express
a
u
t
hor
ization.
c. Company A is the semiconductor manufacturer and Company B
is the telecommunications provider. Both of these firms are
7-Solutions
7.16 (Delta, Inc., and SunnyDay Company; analyzing accounts
receivable for two companies.) (amounts in millions of US$)
a. Delta, Inc. SunnyDay
b
.
8.8 = 41.5 days. 365
4.9
7.17
continued.
c. Delta sells primarily to individuals who pay with credit cards.
Delta collects these accounts receivable quickly. SunnyDay
7.17 (Funtime, Inc.; analyzing inventories over three years.)
(amounts
in millions of euros)
a. Invento
r
y
Year Numerator Denominator Turnover
2011 € 2,806 € 415 6.76
Solutions7-8
b.
Year Numerator Denominator
D
ay
s
I
n
v
en
to
r
y
Hel
d
c.
Year Numerator Denominator
Cost o
f
Goods
Sold
d. Funtime experienced an increasing inventory turnover and a
7.18
continued.
products in order to sell them or to incur additional storage
7.18 (Mickey Group; analyzing fixed-asset turnover over three years.)
(amounts in millions of pounds sterling)
a. Fixed
Asset
Year Numerator Denominator Turnover
7-9 Solutions
b. The fixed-asset turnover increased during the three-year
period.
7.19 (FleetSneak; calculating and interpreting short-term liquidity
ratios.) (amounts in millions of US$)
a. Current Ratio
Year Numerator Denominator Current
Quick Ratio
Year
Numerator
Denominator
Quick
Rat
i
o