8. The effect of the management of the operating cycle on the firm’s profitability.
a.
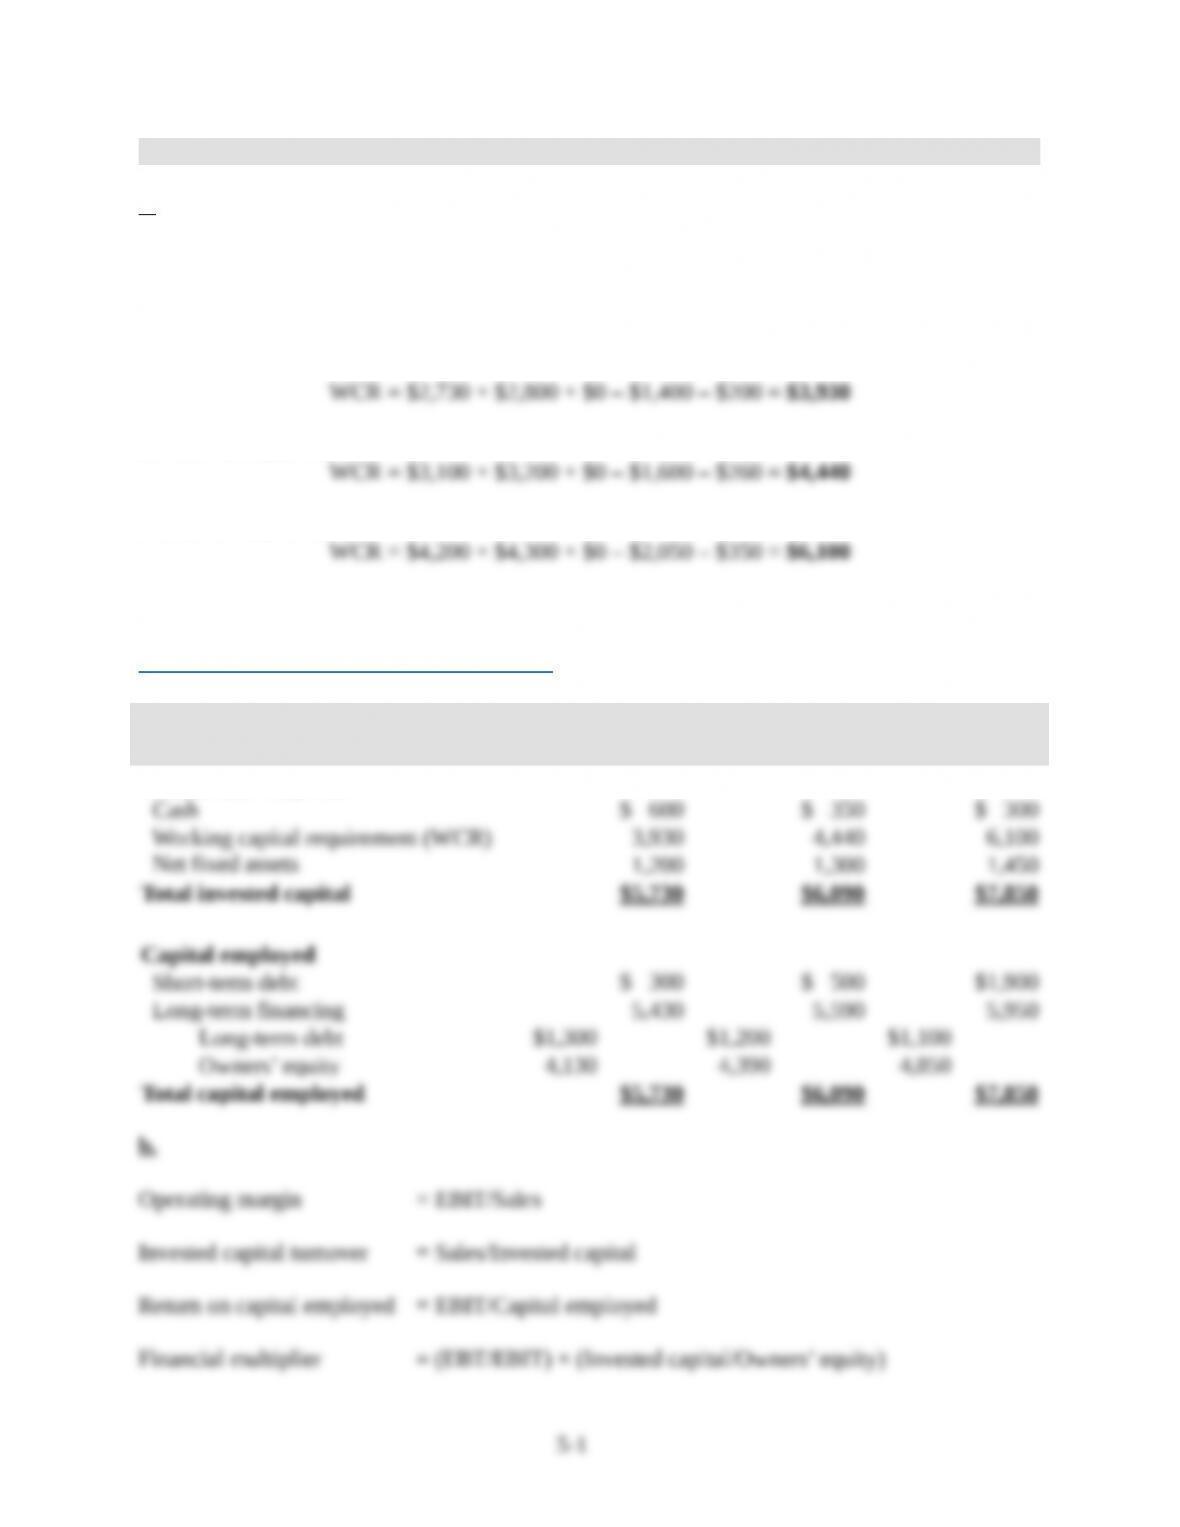
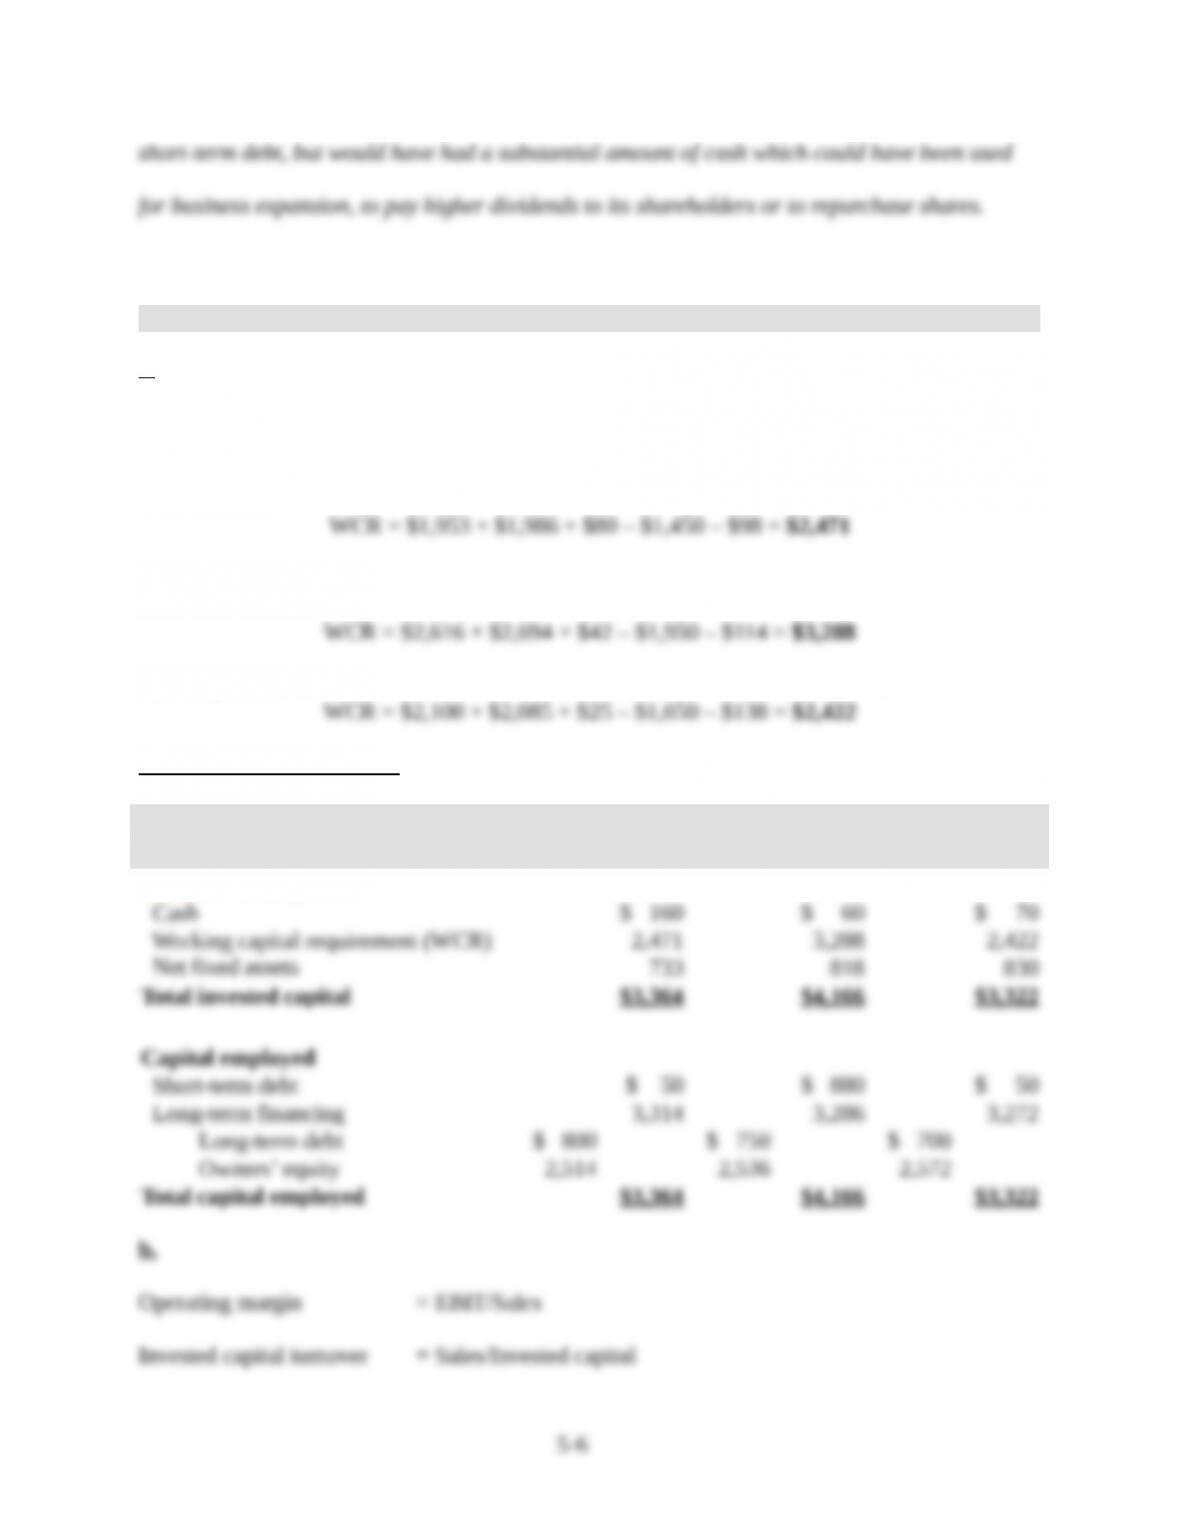
Working capital requirement (WCR) = Accounts receivable + Inventories + Prepaid expenses
– Accounts payable – Accrued expenses
December 31, 2008
December 31, 2009
December 31, 2010
Managerial balance sheets
in thousands
December 31,
2008
December 31,
2009
December 31,
2010
Invested capital
Cash
Working capital requirement (WCR)
Total invested capital
$5,730
$6,090
$7,850
Capital employed
Short-term debt
$ 300 $ 500 $1,900
Long-term financing
5,430
5,590
5,950
Long-term debt
$1,300 $1,200 $1,100
Owners’ equity
4,130 4,390 4,850
Total capital employed
$5,730
$6,090
$7,850
b.
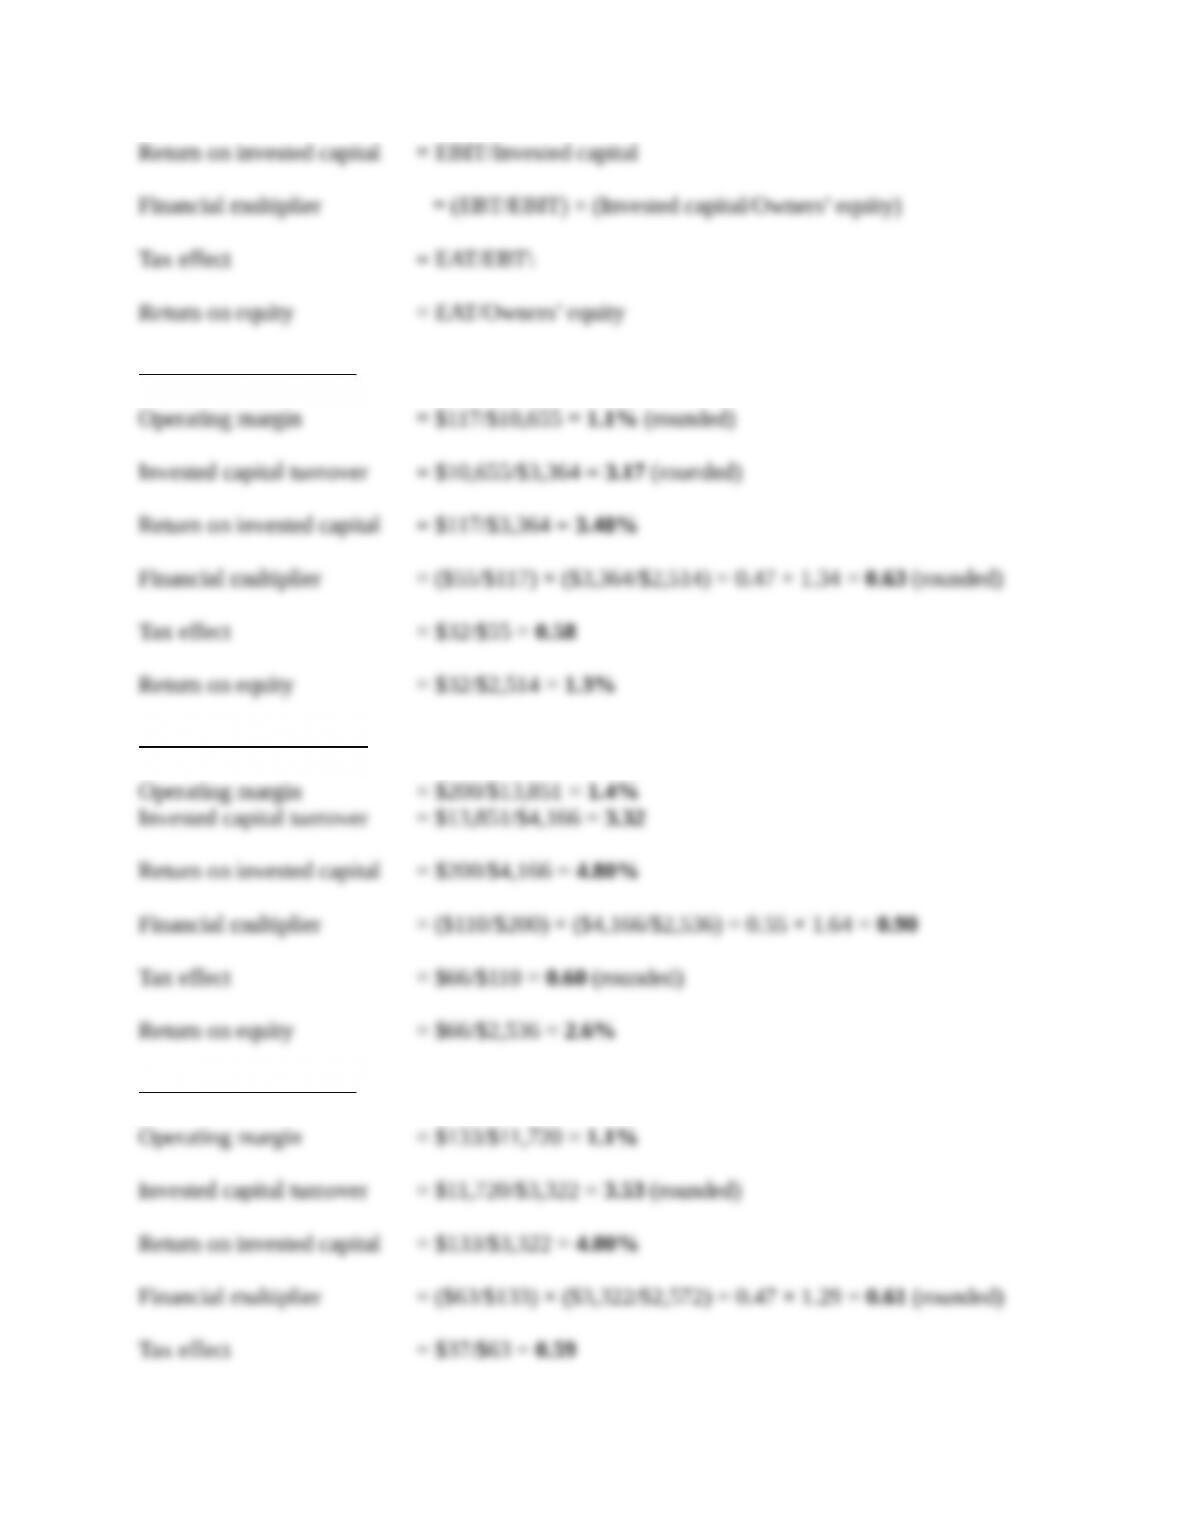
Operating margin = EBIT/Sales
Invested capital turnover = Sales/Invested capital
5-1
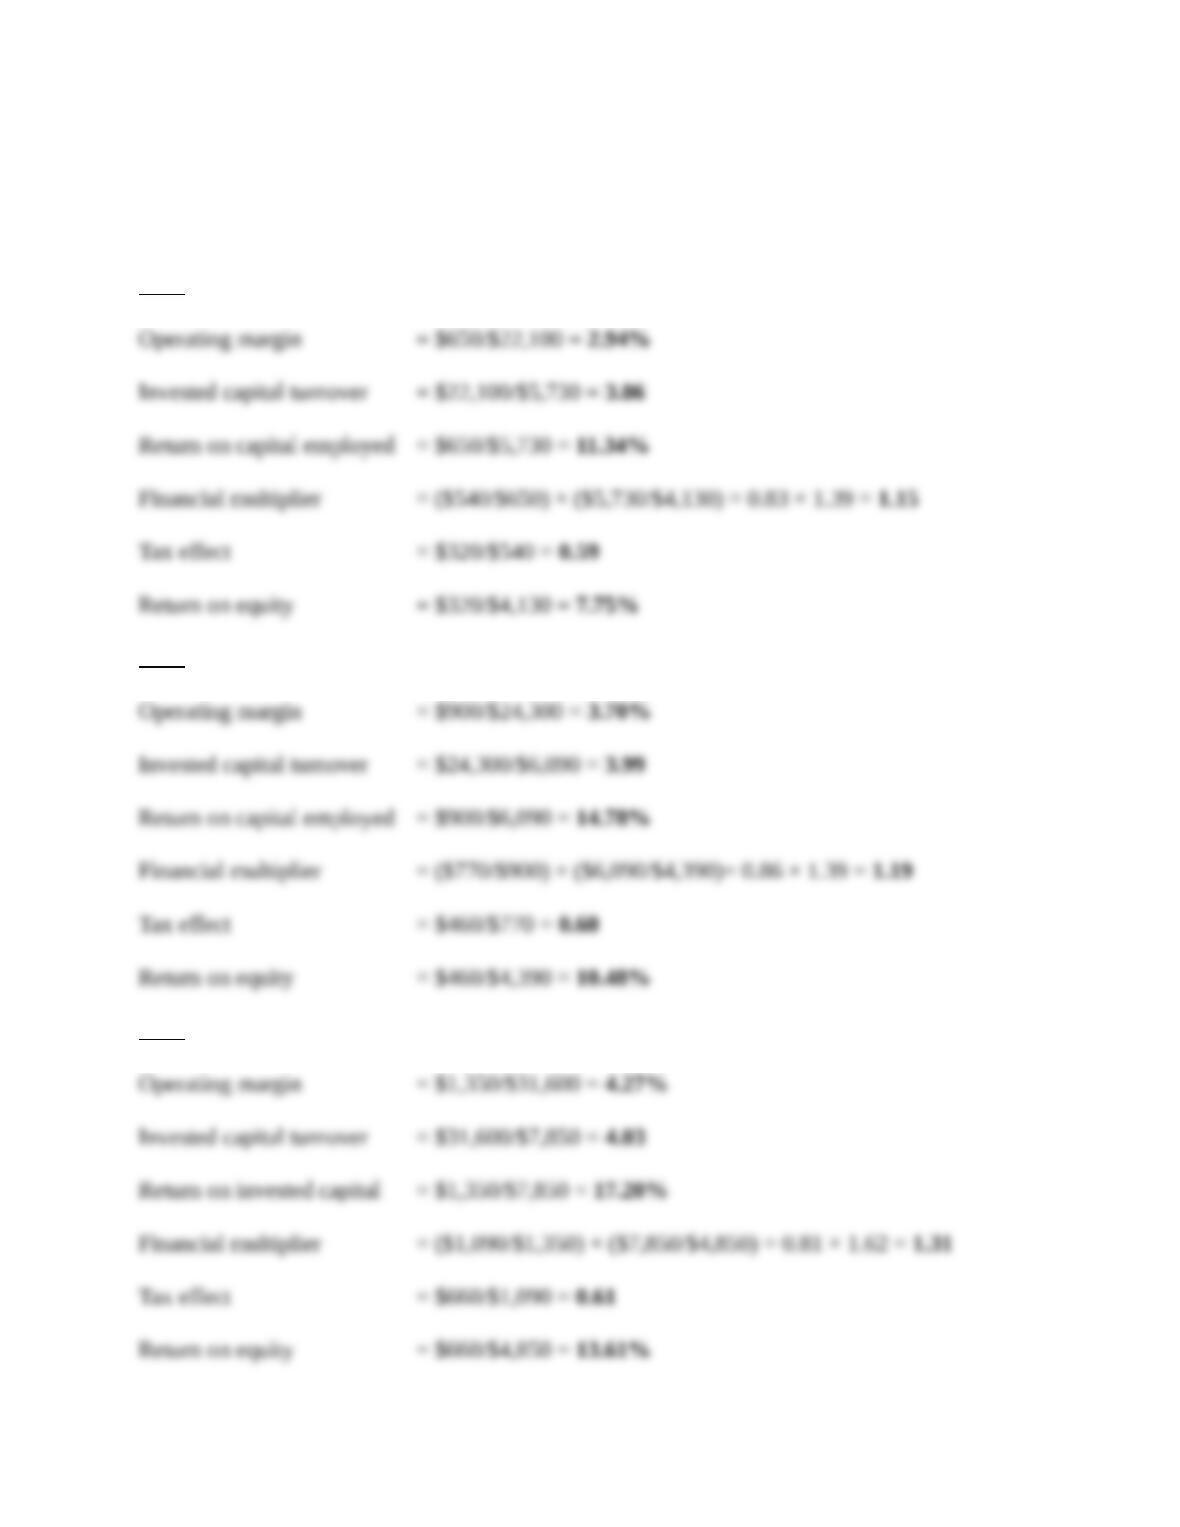
Tax effect = EAT/EBT
Return on equity = EAT/Owners’ equity
2008
2009
2010
5-2
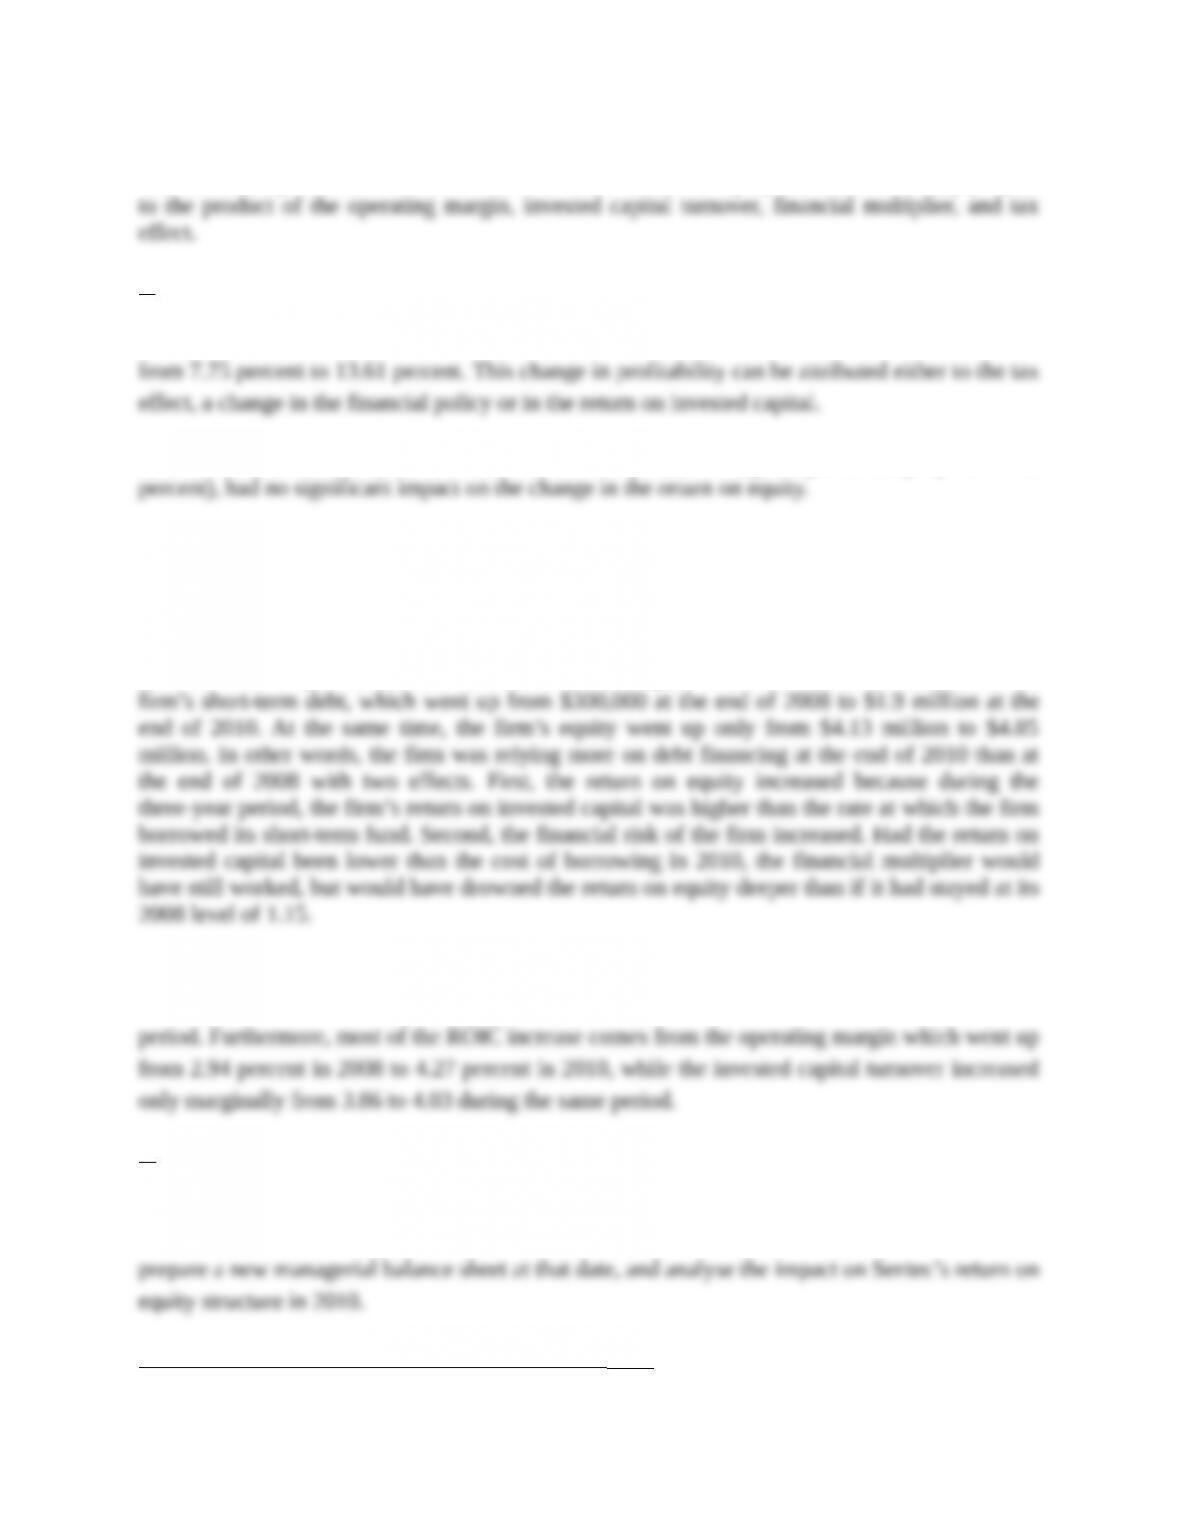
The relationship between these ratios and the firm’s return on equity is that ROE is simply equal
c.
Note the drastic increase of the return on equity which nearly doubles between 2008 and 2010,
The tax effect, which stayed between 0.59 to 0.61 (i.e., reducing the profitability by 41 to 39
The financial multiplier, which increased the return on invested capital by 15 percent in 2008,
increased it by 31 percent in 2010, thus improving the profitability of the firm. Had the return on
invested capital been 11.34 percent in 2010 as in 2008, the return on equity would have been
equal to 9.06 percent (11.34% 1.31 0.61), which indicates that the change in the financial
multiplier explains 22.35 percent of the change in the return on equity ([9.06% – 7.75%]/
[13.61% – 7.75%]). The increase in the financial multiplier was the result of the increase in the
The return on invested capital (ROIC), which increased drastically from 11.34 percent in 2008 to
17.20 percent in 2010, was the main driver of the increase of the firm’s profitability during that
d.
From the data on the industry, we can compute what Sentec’s working capital requirement would
have been at the end of 2010 if it had the same activity ratios as the average of its competitors,
Pro forma working capital requirement (WCR)12/31/10
5-3
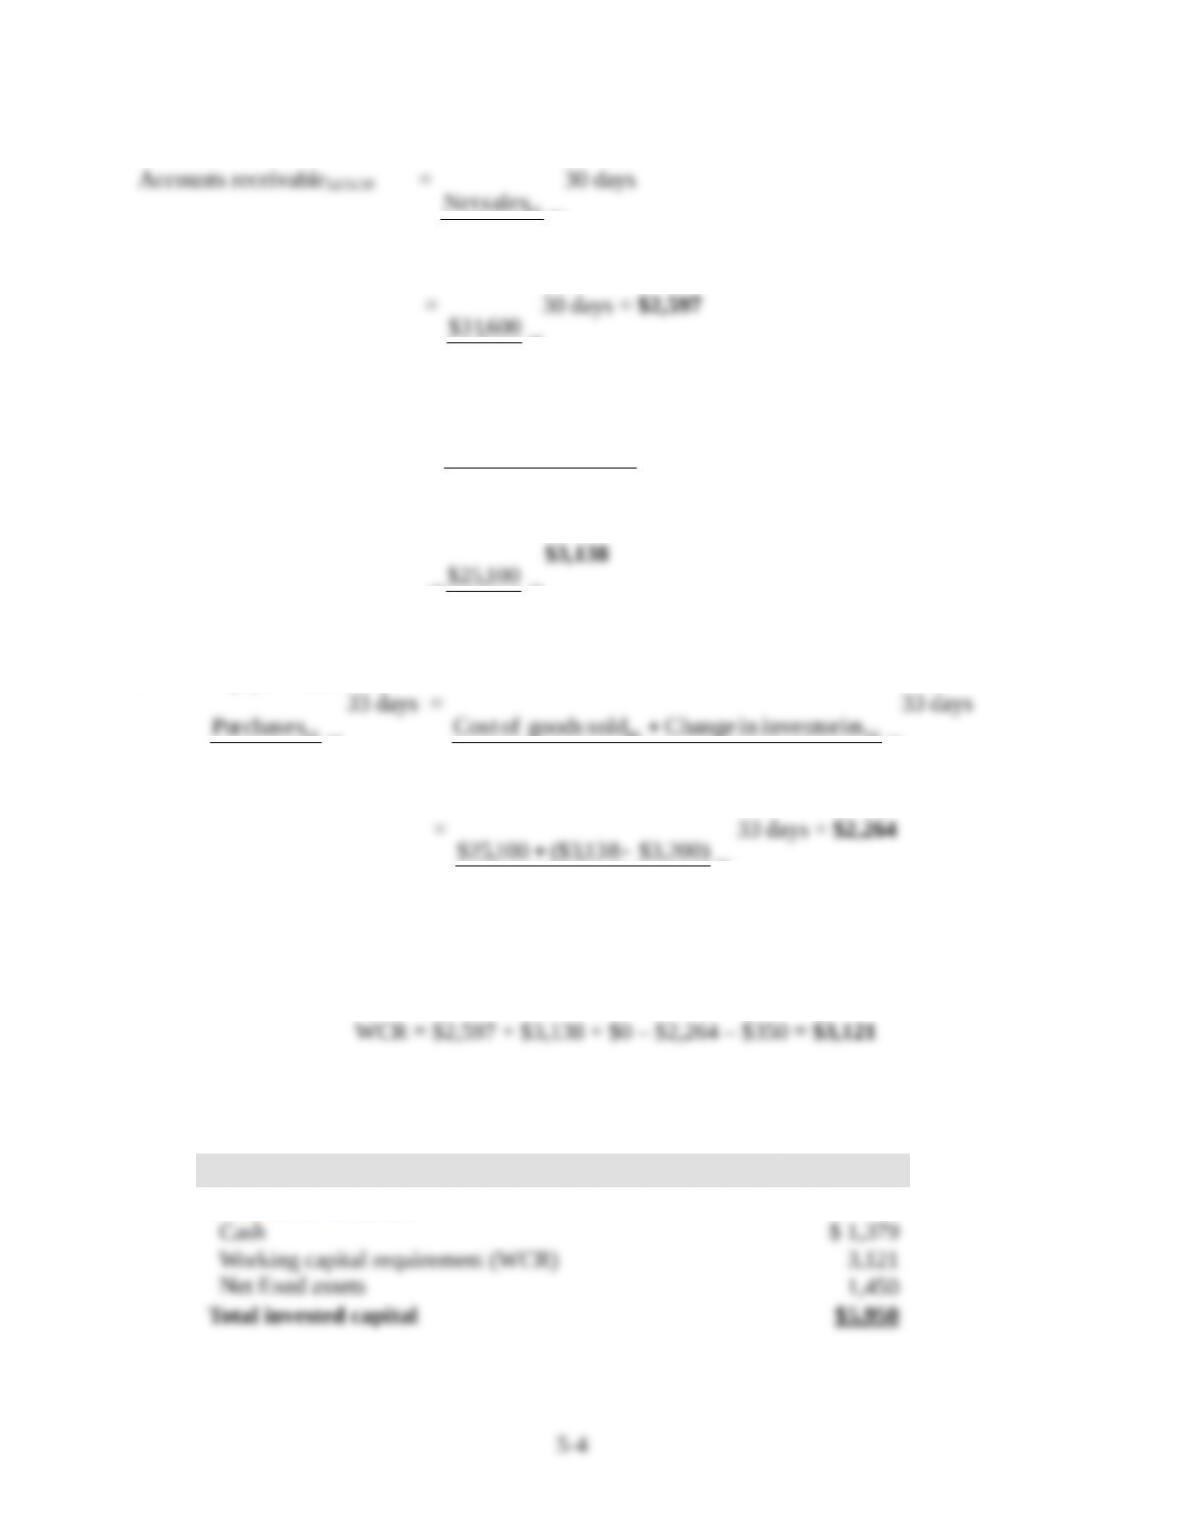
365
salesNet
10
=
365
600,31$
30 days = $2,597
Inventories 12/31/10 =
8
sold goods ofCost
10
8
100,25$
$3,138
Accounts payable12/31/10 =
365
Purchases
10
365
sinventoriein Changesold goods ofCost
1010
=
365
)200,3$138,3($100,25$
33 days = $2,264
Working capital requirement (WCR) = Accounts receivable + Inventories + Prepaid expenses
– Accounts payable – Accrued expenses
Pro forma managerial balance sheet
in thousands December 31, 2010
Invested capital
Capital employed
Short-term debt
Long-term financing
5,950
Long-term debt
Owners’ equity
Total capital employed
$5,950
Note that the amount of long-term financing ($5,950) would have been higher than the
investment in fixed assets and in the operating cycle ($1,450 + $3,121 = $4,571). Sentec Inc.
would not have needed any short-term debt, and had $1,379 million (5,950 – $4,571) in cash.
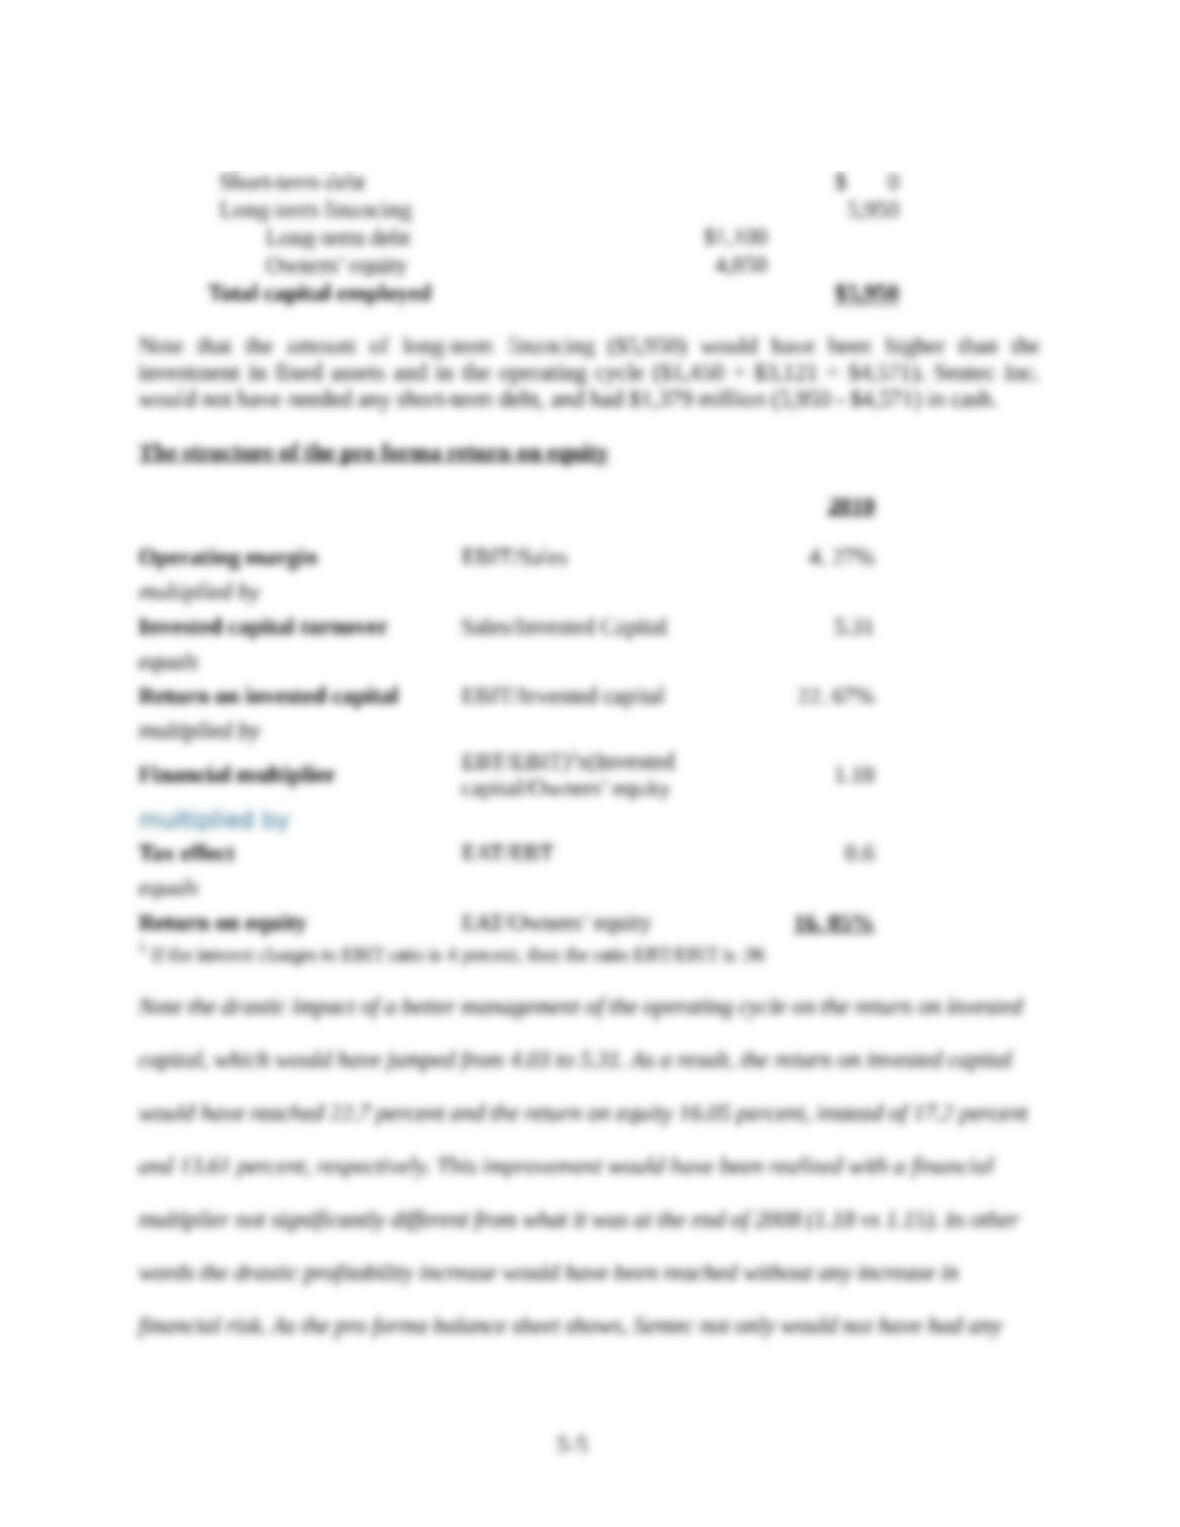
The structure of the pro forma return on equity
1 If the interest charges to EBIT ratio is 4 percent, then the ratio EBT/EBIT is .96
Note the drastic impact of a better management of the operating cycle on the return on invested
capital, which would have jumped from 4.03 to 5.31. As a result, the return on invested capital
would have reached 22.7 percent and the return on equity 16.05 percent, instead of 17.2 percent
5-5
9. Seasonal business.
a.
Working capital requirement (WCR) = Accounts receivable + Inventories + Prepaid expenses
– Accounts payable – Accrued expenses
June 30, 2009
December 31, 2009
June 30, 2010
Managerial balance sheets
in thousands
June 30,
2009
December 31,
2009
June 30,
2010
Invested capital
6 Months to 6/30/2009
6 Months to 12/31/2009
6 Months to 6/30/2010
5-7
c.
Return on equity is higher in the second part of the year than in the first half (2.6 percent versus
1.3/1.4 percent) for the following reasons:
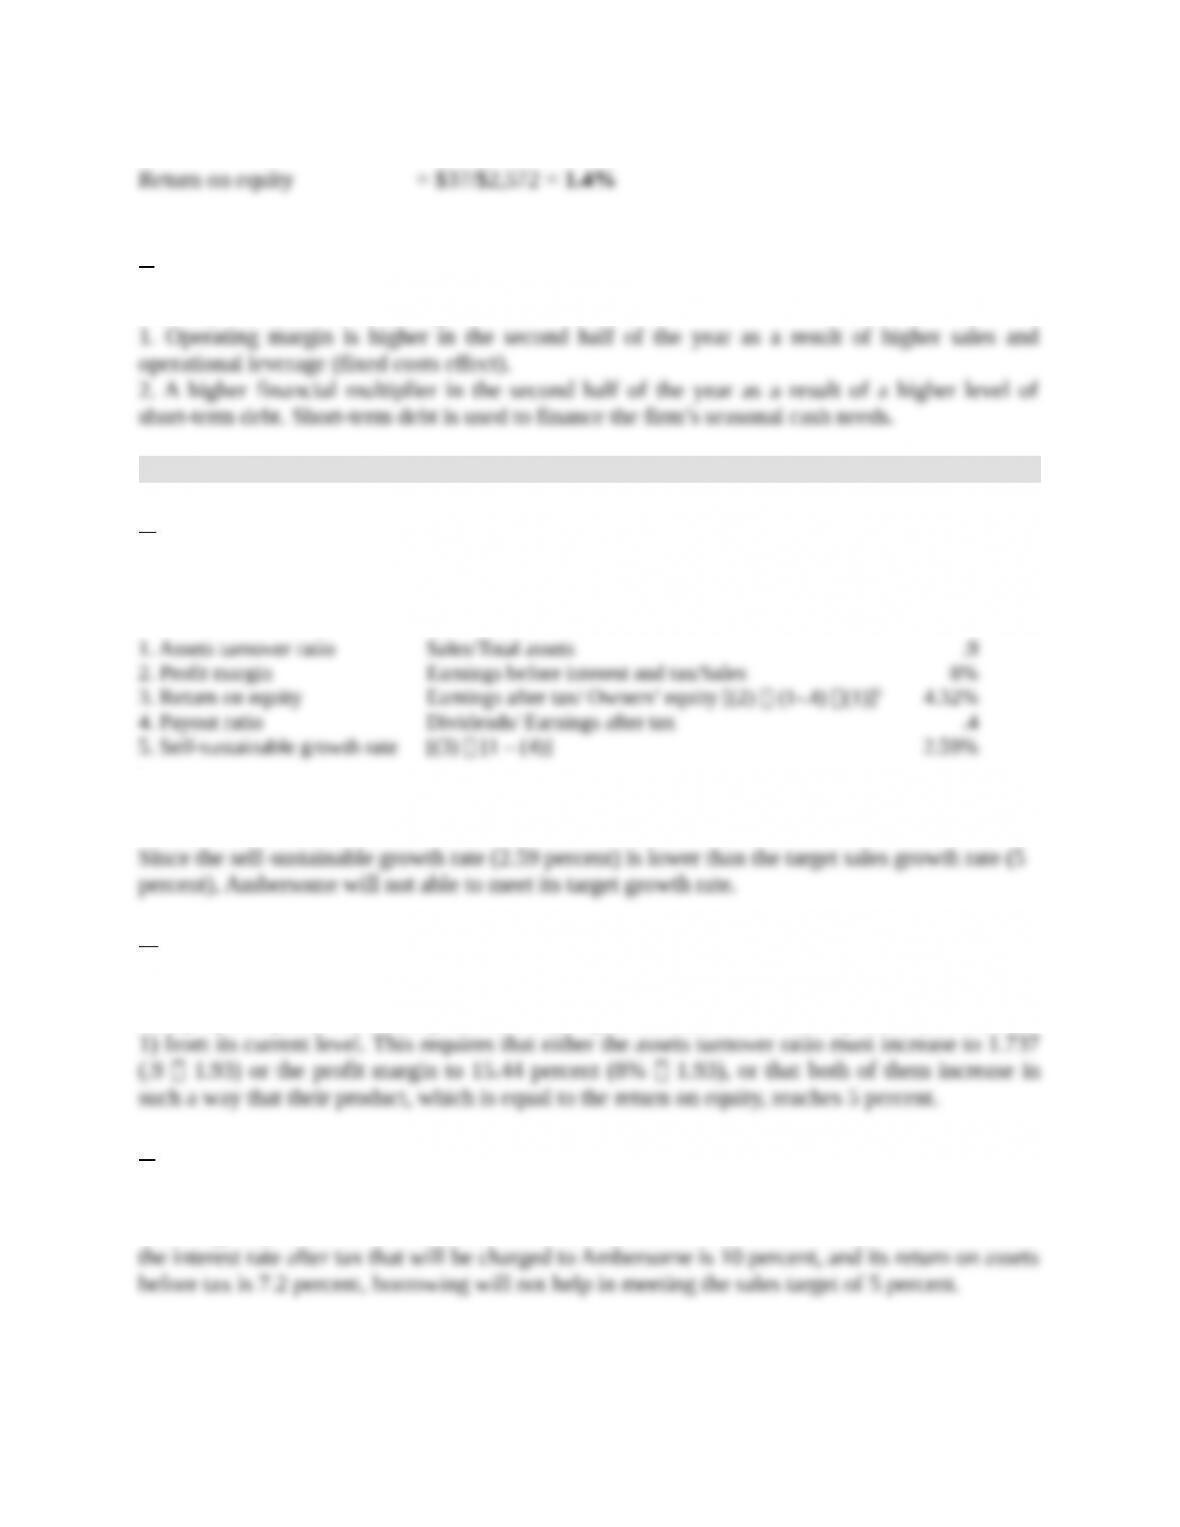
10. Self-sustainable growth rate.
a.
The five percent target growth rate would be attainable only if the firm’s self-sustainable growth rate is at least equal to 5 percent. Ambersome’s
self-sustainable rate can be computed as follows:
1 Since Ambersome has not debt, its earnings after tax is earnings before interest and tax (1-tax rate of 40 percent)
and owners’ equity = total assets.
b.
Ambersome would have to increase its asset turnover ratio or its profit margin so that its return
on equity is equal to at least 5 percent, which represents an increase of 93 percent (5%/2.59% –
c.
The firm’s return on equity, and as a result, its self-sustainable rate, would increase through debt
financing only if the rate at which the firm can borrow is lower than the return on assets. Since
5-8