6. From the statement of cash flows (FASB 95) to the cash-flow statement (direct
approach).
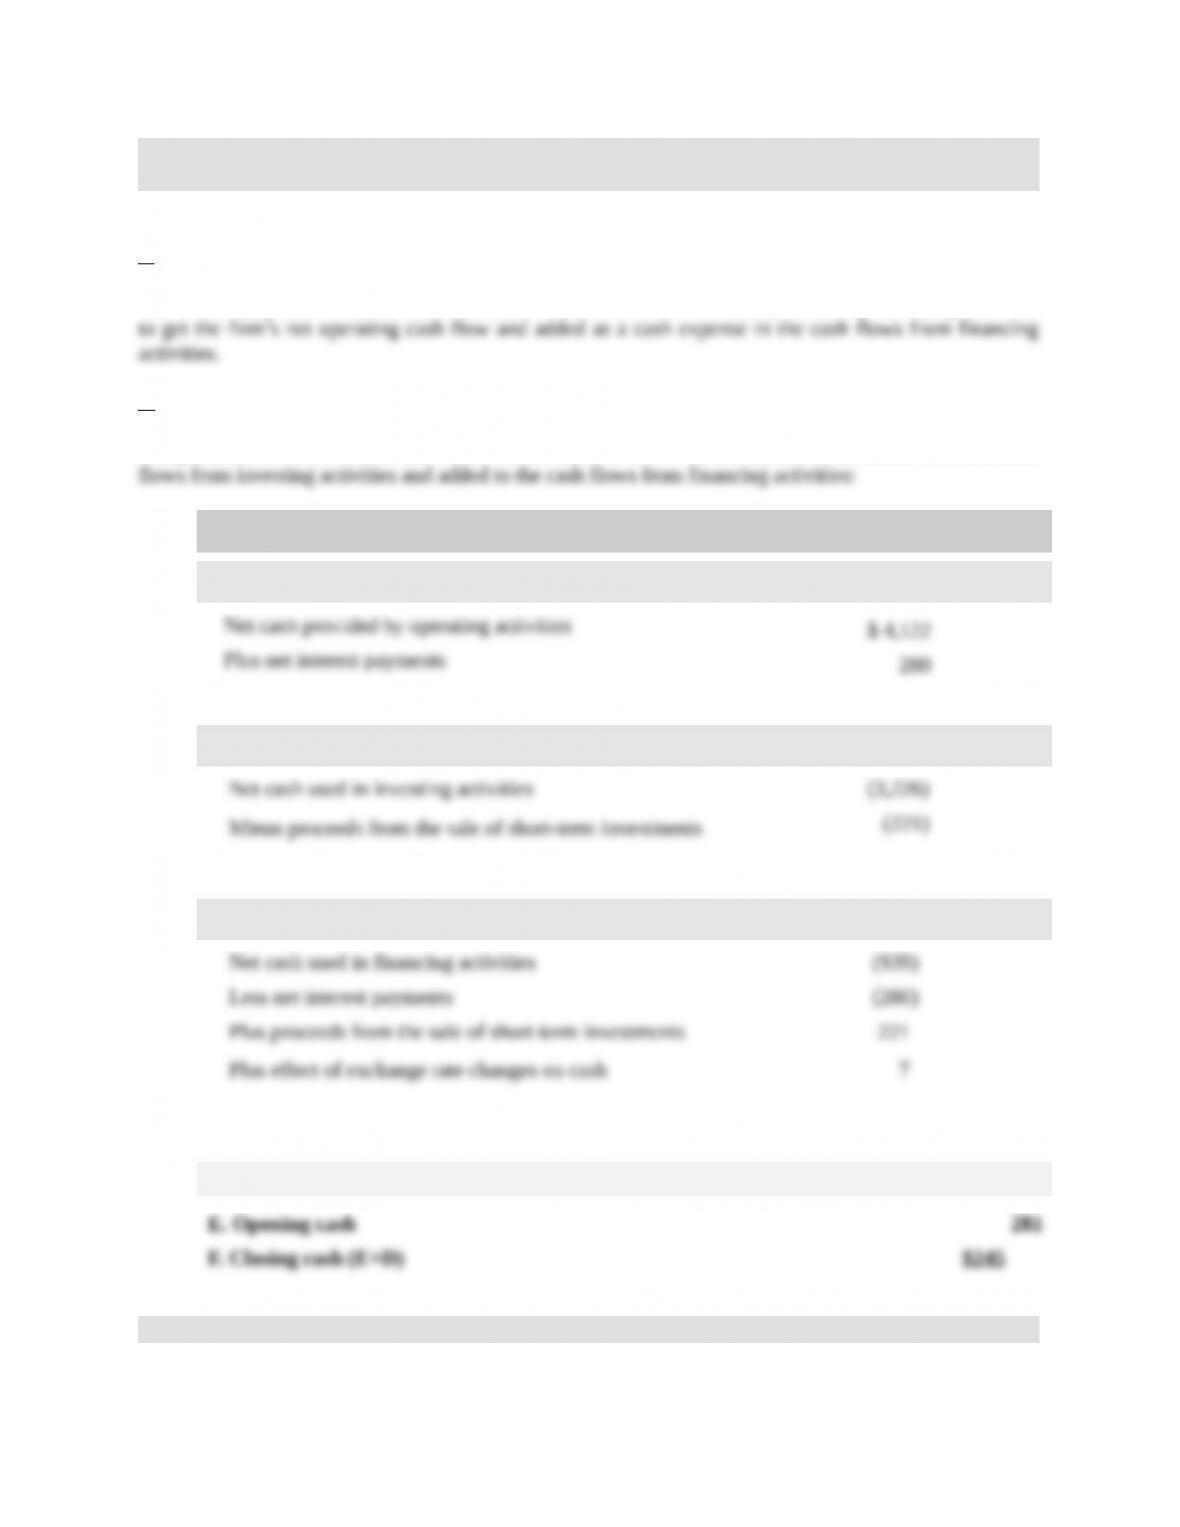
There are two adjustments to make on the FASB 95 statement to prepare the firm’s cash flow statement:
a.
The interest payments of $280 millions must be deducted to the net cash provided by operating activities
b.
The proceeds from the sale of short-term investments of $221 million should be deducted from the cash
in millions 2008
Cash flows from operating activities
A. Net operating cash flow $4,402
Cash flows from investing activities
B. Net cash flow from investing activities (3,447)
Cash flows from financing activities
C. Net cash flow from financing activities (991)
D. Total net cash flow (A+B+C) (36)
7. Direct versus indirect approach to cash-flow estimation.
4-1
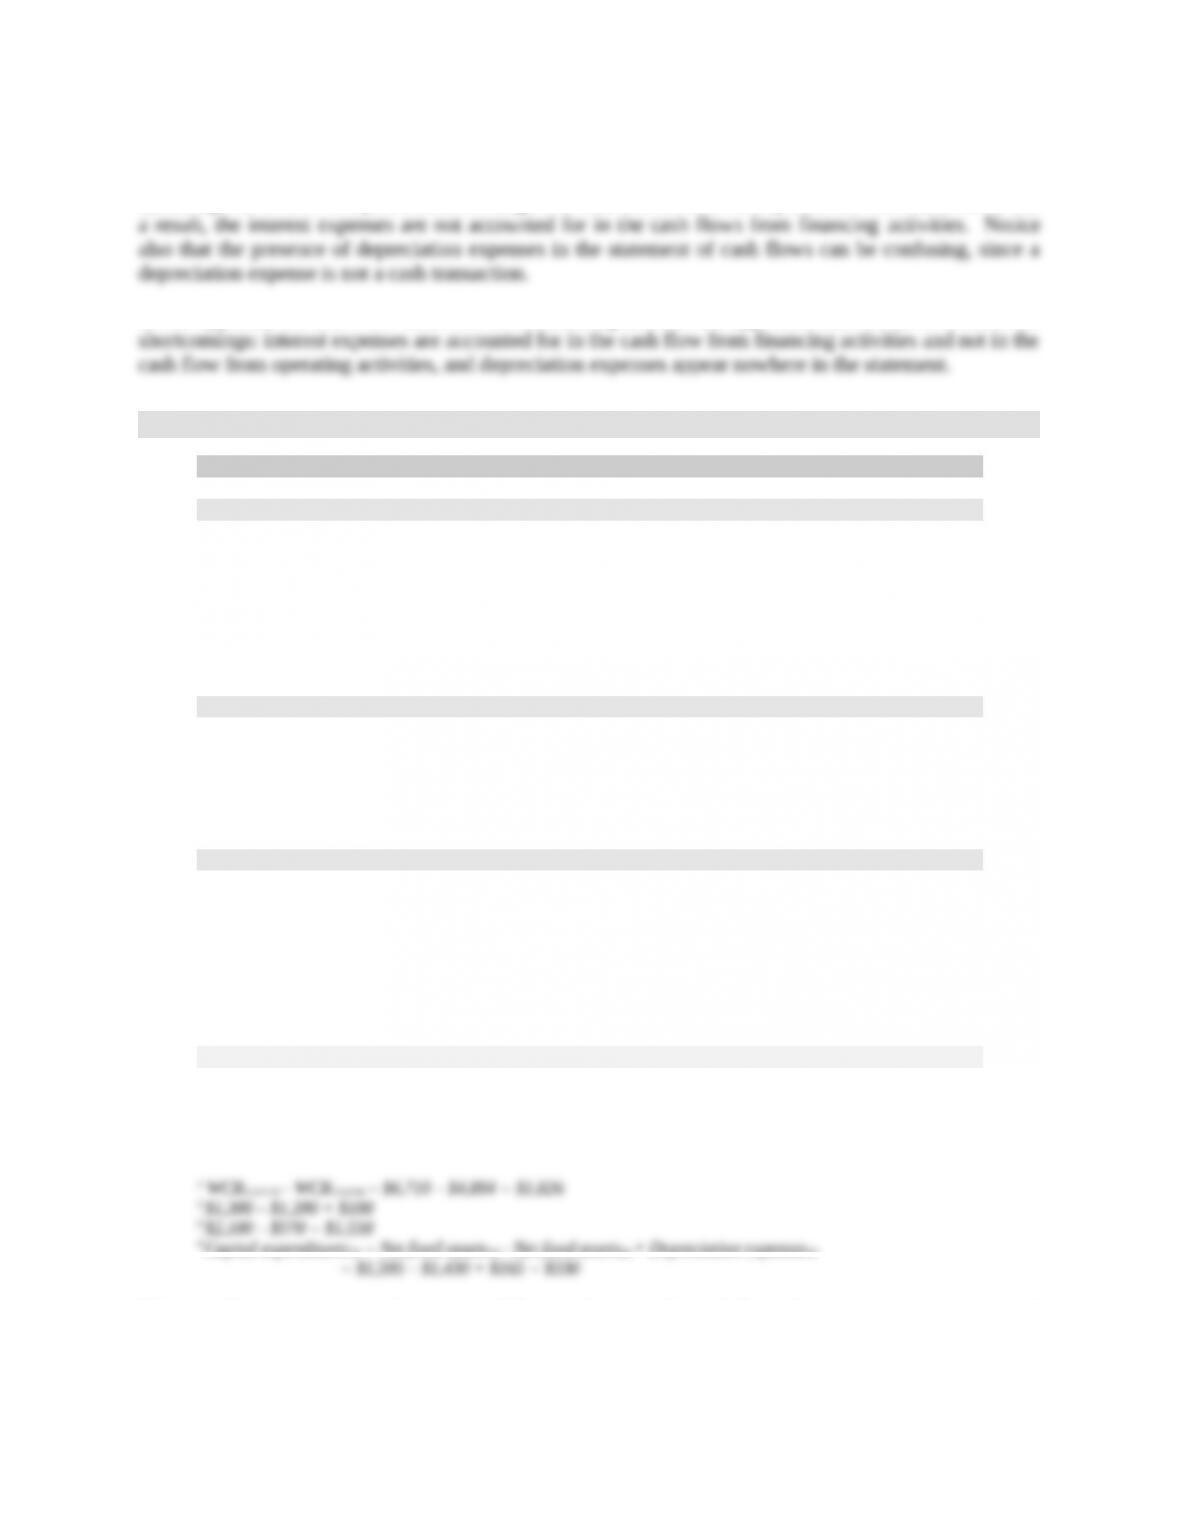
The FASB 95 method is a form of the indirect approach (see Exhibit 4.7). Note that interest expenses are
considered as a consequence of the operating activities of the firm since the net cash provided by
operating activities is computed from earnings after tax and the interest expenses are not added back. As
At the opposite, the cash-flow statement built according to the direct approach does not suffer from these
8. Another version of the cash-flow statement.
in thousands
2010
Cash flows from operating activities
(+) Net sales
$34,760
(–) Cost of goods sold
(27,610)
(–) Selling, general, and administrative expenses
(5,500)
(–) Tax expense
(473)
(–) Change in working capital requirement1
(1,826)
A. Net operating cash flow (NOCF)
($649)
Nondiscretionary cash flows
(–) Long-term debt repaid2
(100)
(–) Interest payments
(286)
B. Nondiscretionary cash flows
($386)
C. Cash flow for strategic decisions (A + B)
($1,035)
Discretionary cash flows
(+) Increase in long-term borrowings
0
(+) Increase in short-term borrowings3
1,530
(–) Capital expenditures4
(330)
(–) Dividend payments
(220)
D. Discretionary cash flows
$980
E. Total net cash flow (C + D)
($55)
F. Opening cash
$385
G. Closing cash (E + D)
$330
1 WCR12/31/10 – WCR12/3109 = $6,710 – $4,884 = $1,826
2 $1,300 – $1,200 = $100
3 $2,100 – $570 = $1,530
4 Capital expenditures10 = Net fixed assets10 – Net fixed assets09 + Depreciation expenses10
This cash-flow statement emphasizes the difference between the cash flows that are related to contractual
obligations, such as debt repayment and interest payments, and the cash flows that are related to decisions
that are at the discretion of management, such as capital expenditures, new financing decisions and
4-2
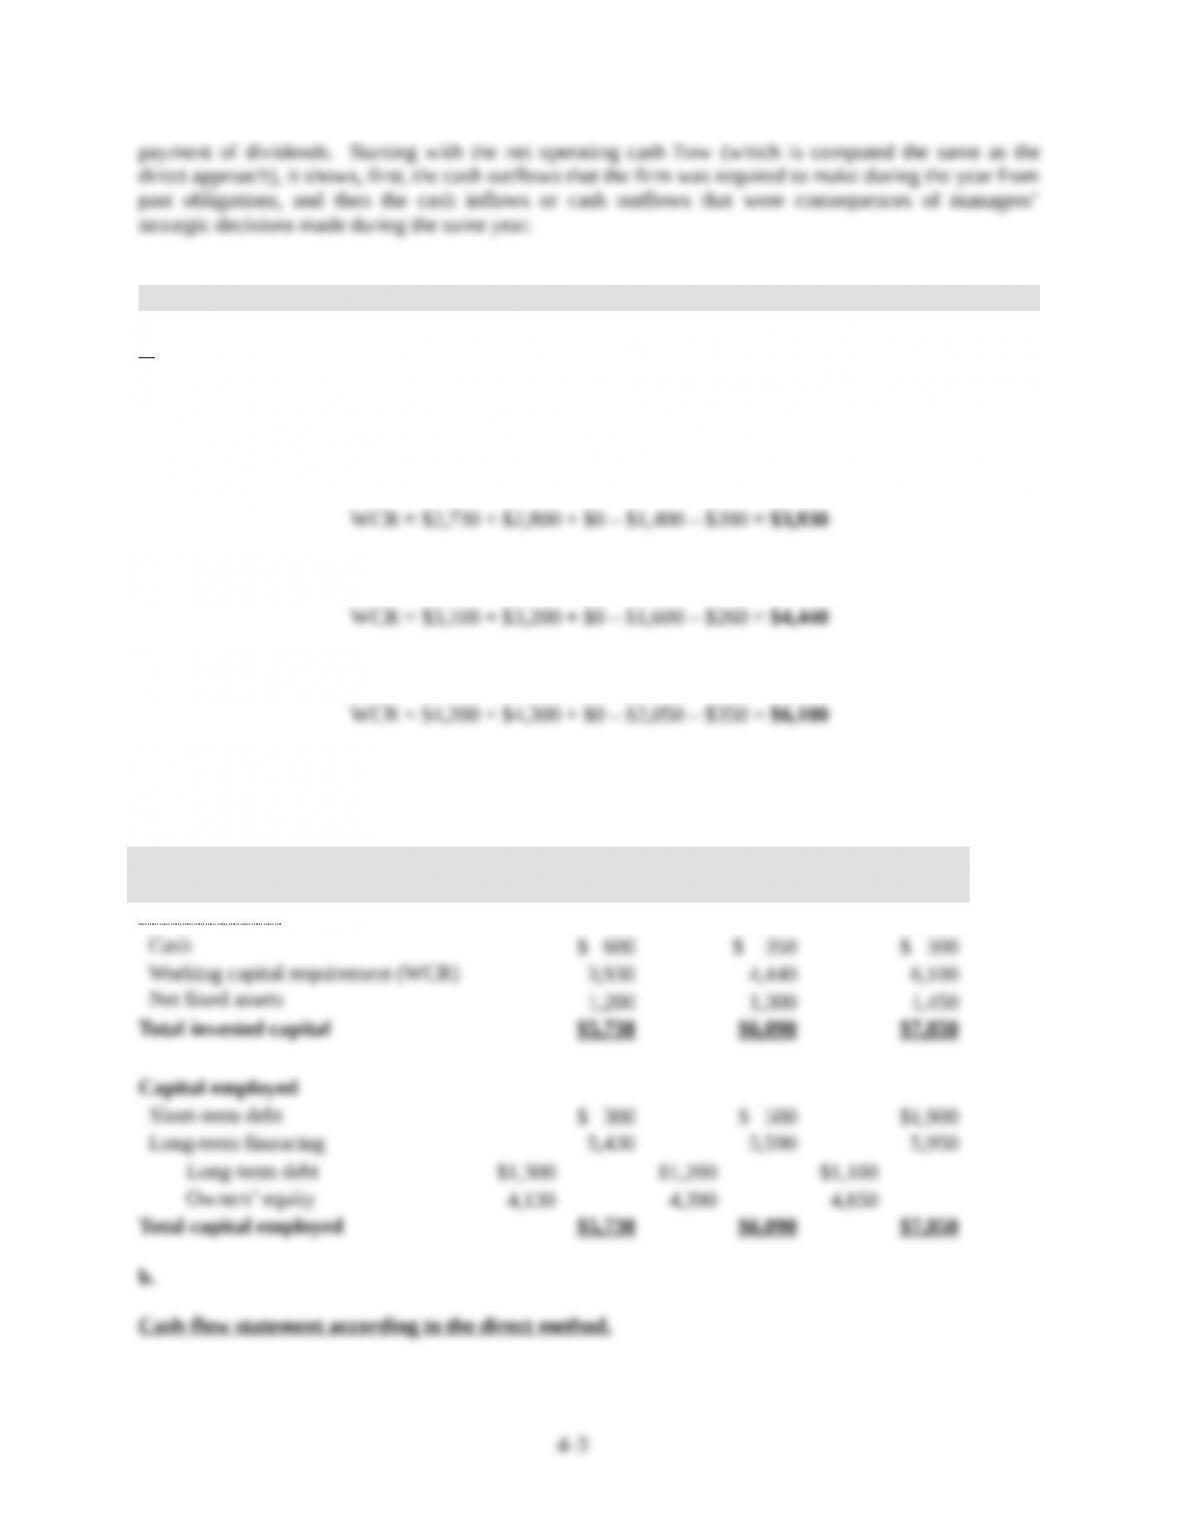
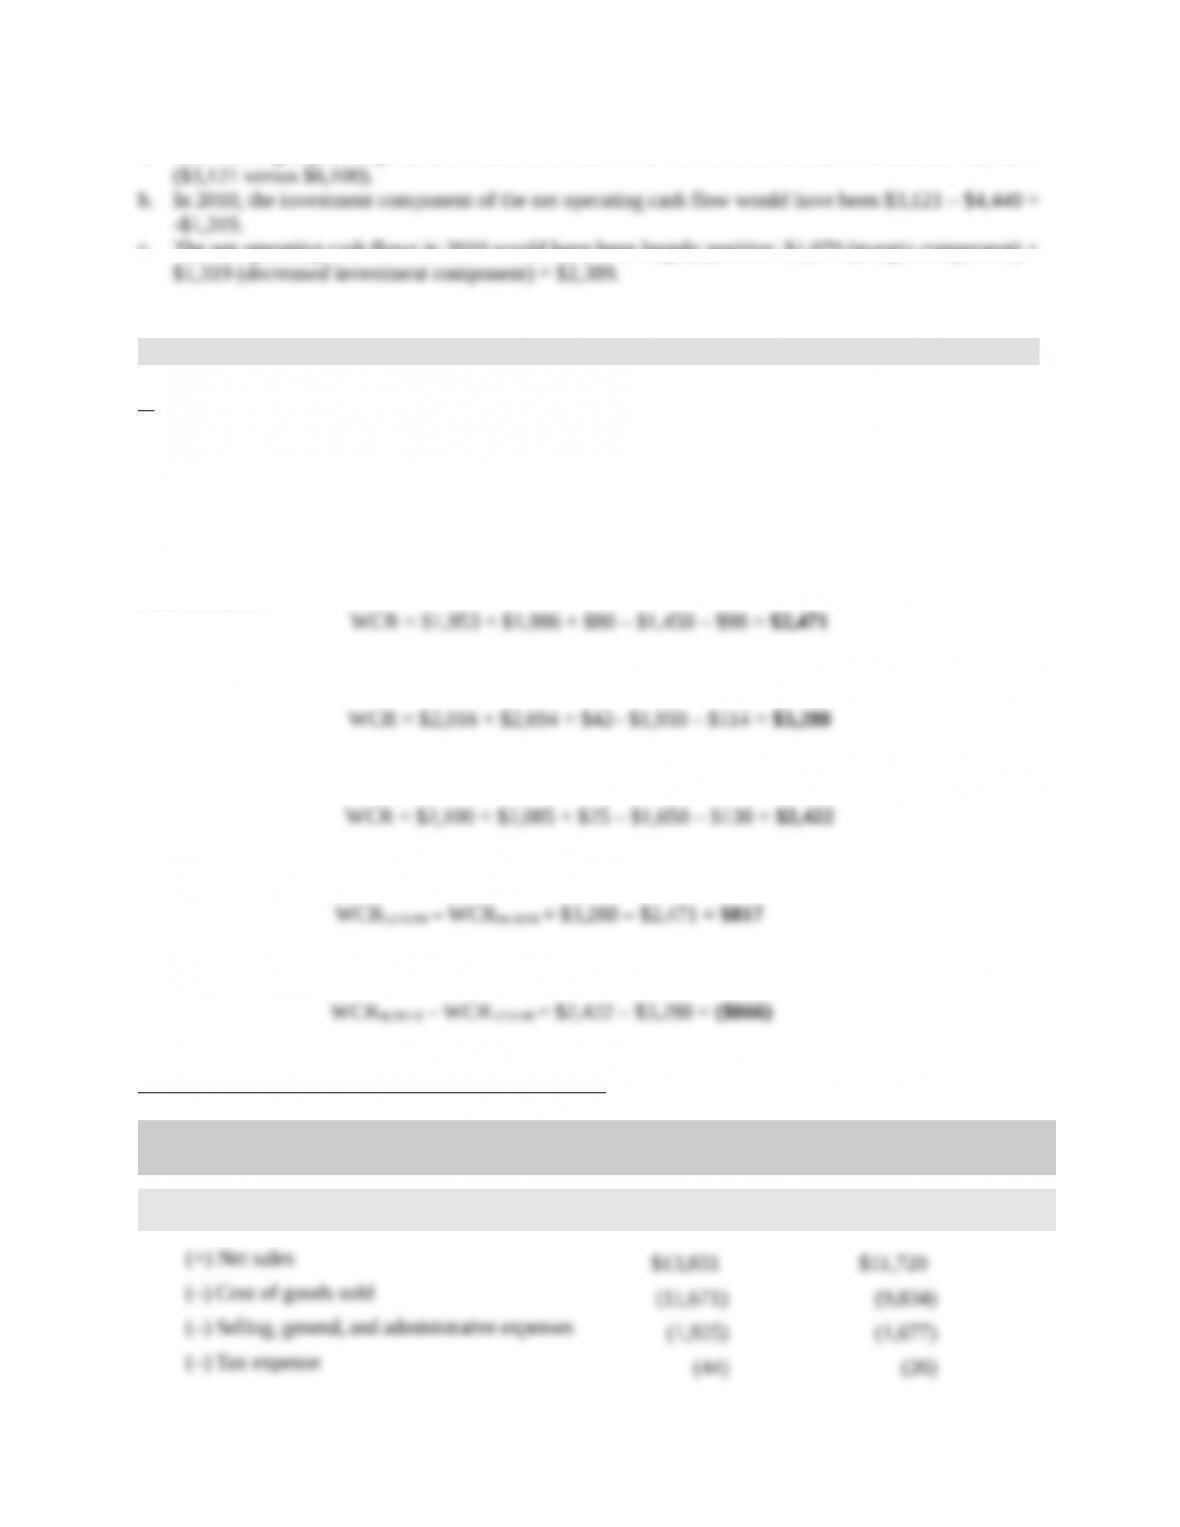
9. The effect of the management of the operating cycle on the firm’s cash flows.
a.
Working capital requirement (WCR) = Accounts receivable + Inventories + Prepaid expenses
– Accounts payable – Accrued expenses
December 31, 2008:
December 31, 2009:
December 31, 2010:
Managerial balance sheet
in thousands December, 31,
2008
December 31,
2009
December 31,
2010
Invested capital

in thousands 2009 2010
Cash flows from operating activities
4-4
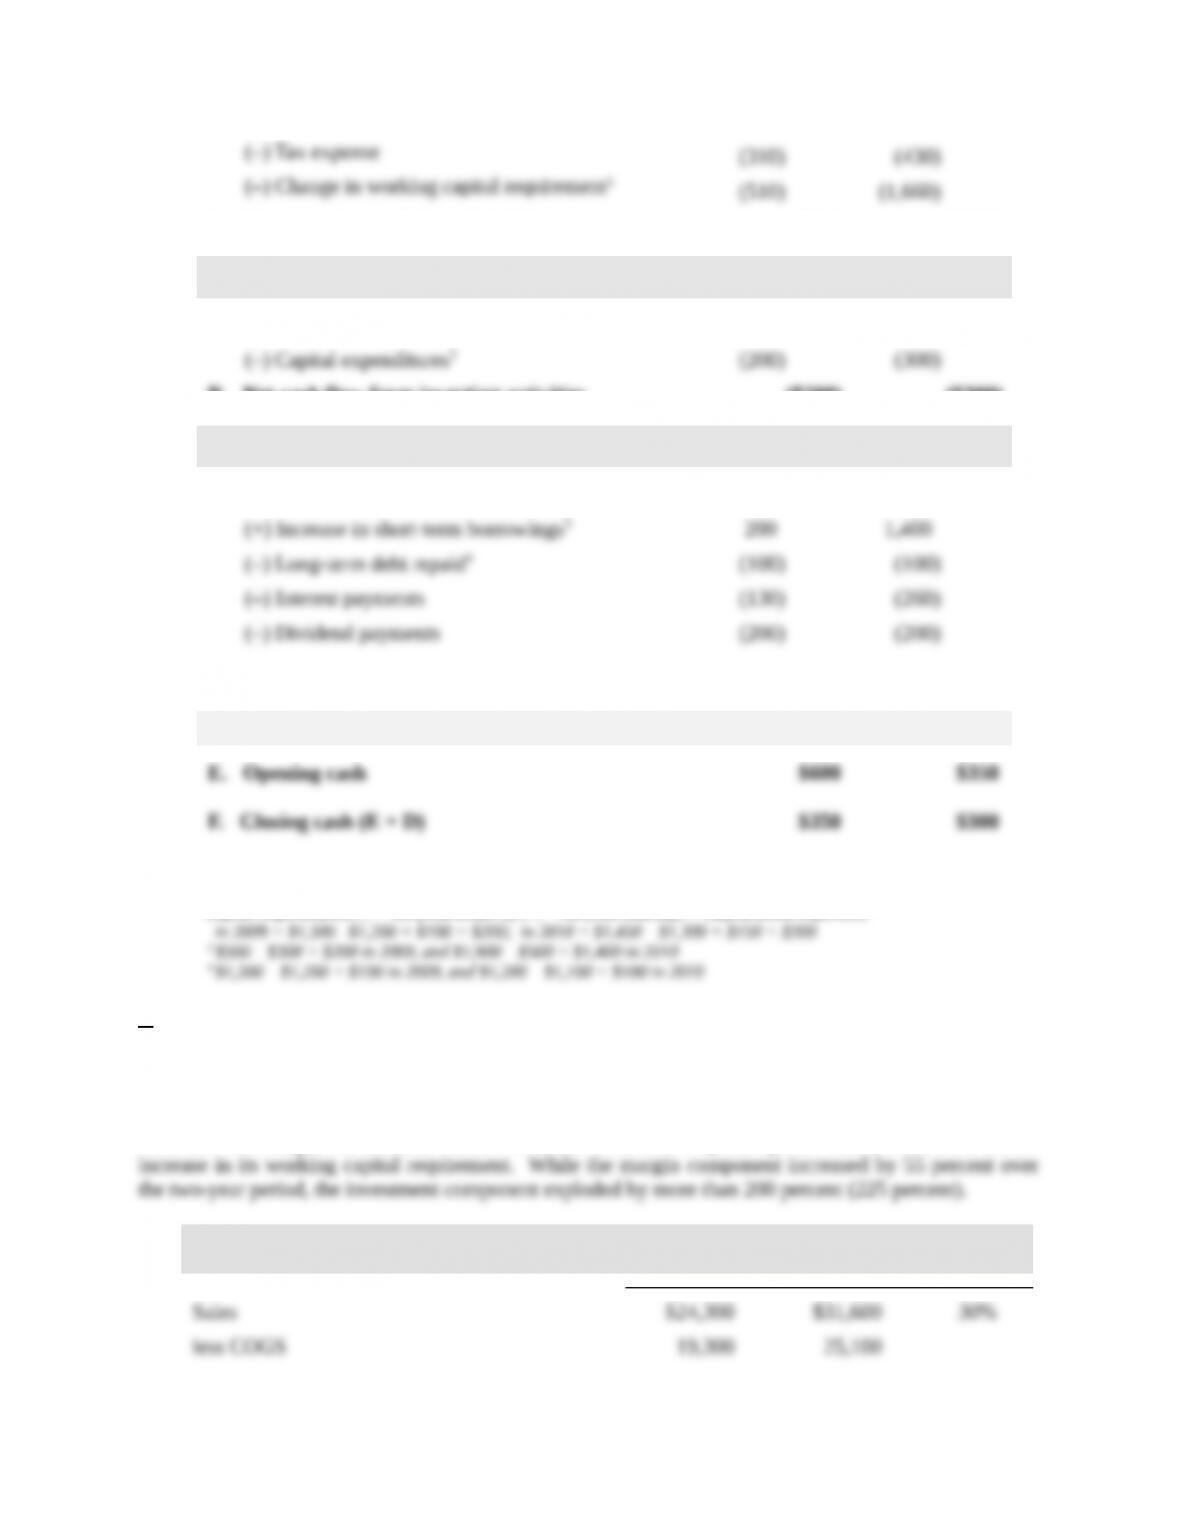
A. Net operating cash flow (NOCF) $180 ($590)
Cash flows from investing activities
(+) Sale of fixed assets 0 0
B. Net cash flow from investing activities ($200) ($300)
Cash flows from financing activities
(+) Increase in long-term borrowings 0 0
C. Net cash flow from financing activities ($230) $840
D. Total net cash flow (A + B + C) ($250) ($50)
1 WCR end t + 1 – WCR end t; in 2009 = $4,440 – $3,930 = $510; in 2010 = $6,100 – $4,440 = $510
2 Capital expenditurest + 1 = Net fixed assets end t + 1 – Net fixed assetsend t + Depreciation expensest:
c.
The drastic decrease in the operating cash flow from a positive $180,000 in 2009 to a negative $590,000
in 2010 can originates either from its margin component or its investment component, or both.
From the following table, it is clear that the decrease in the firm’s operating cash flow came from a drastic
in thousands 2009 2010
Percent
change
4-5
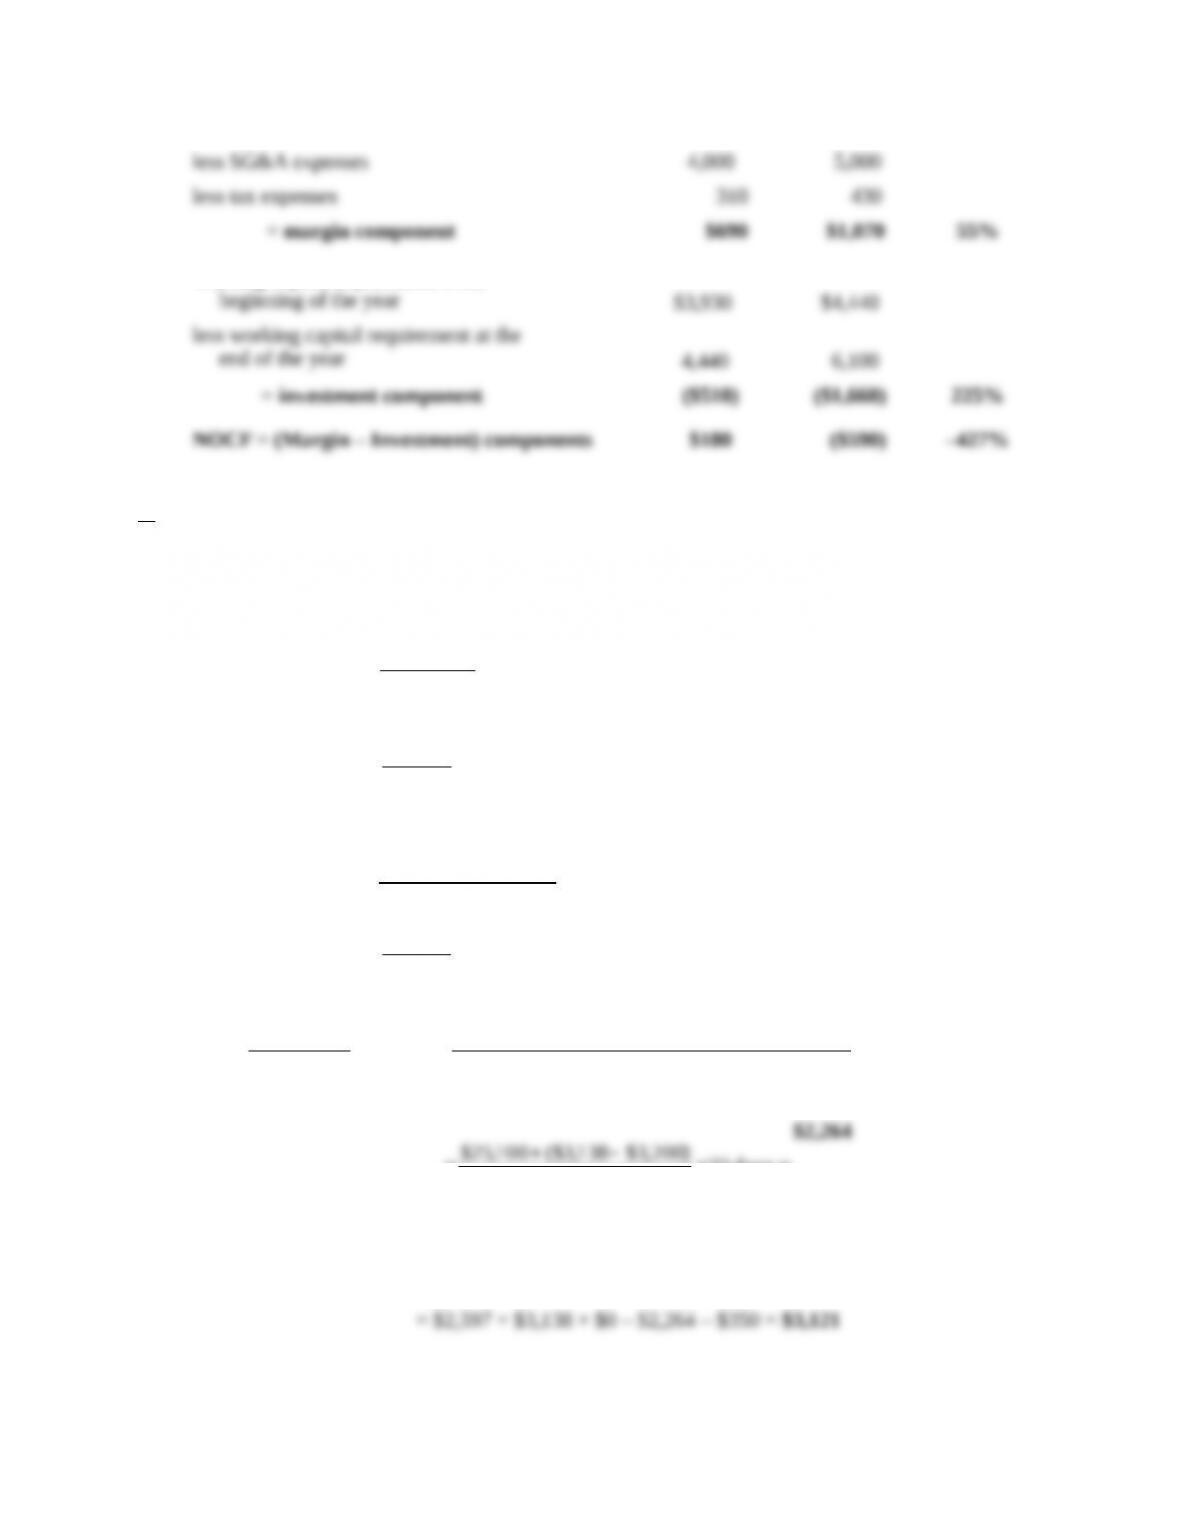
Working capital requirement at the
d.
If Sentec Inc. had managed its operating cycle with the same efficiency as the average firm in the sector,
we would have (in $ thousands):
Accounts receivable12/31/10 =
days30
365
salesNet
10
$2,597 days30
365
600,31$
Inventory 12/31/10 =
8
soldgoodsofCost
10
$ 3,13 8
8
100,25$
Accounts payable12/31/10 =
days33
365
sinventorieinChangesoldgoodsofCost
days33
365
Purchases
101010
days33
365
)200,3$138,3($100,25$
$2,264
Working capital requirement = Accounts receivable + Inventories + Prepaid expenses
– Accounts payable – Accrued expenses
Note:
4-6
a. The working capital requirement would have been over half of what it was on December 31, 2010
c. The net operating cash flows in 2010 would have been largely positive: $1,070 (margin component) +
10. Seasonal business.
a.
To prepare the cash-flow statement, we need to compute the change in the firm’s working capital
requirement (WCR) during the two six-month periods.
Working capital requirement (WCR) = Accounts receivable + Inventories + Prepaid expenses
– Accounts payable – Accrued expenses
June 30, 2009:
December 31, 2009:
June 30, 2010:
Change in WCR during the six months ending 12/31/09:
Change in WCR during the six months ending 06/30/10
Cash-flow statement according to the direct method
in thousands Six months ending
12/31/09
Six months ending
06/30/10
Cash flows from operating activities
4-7
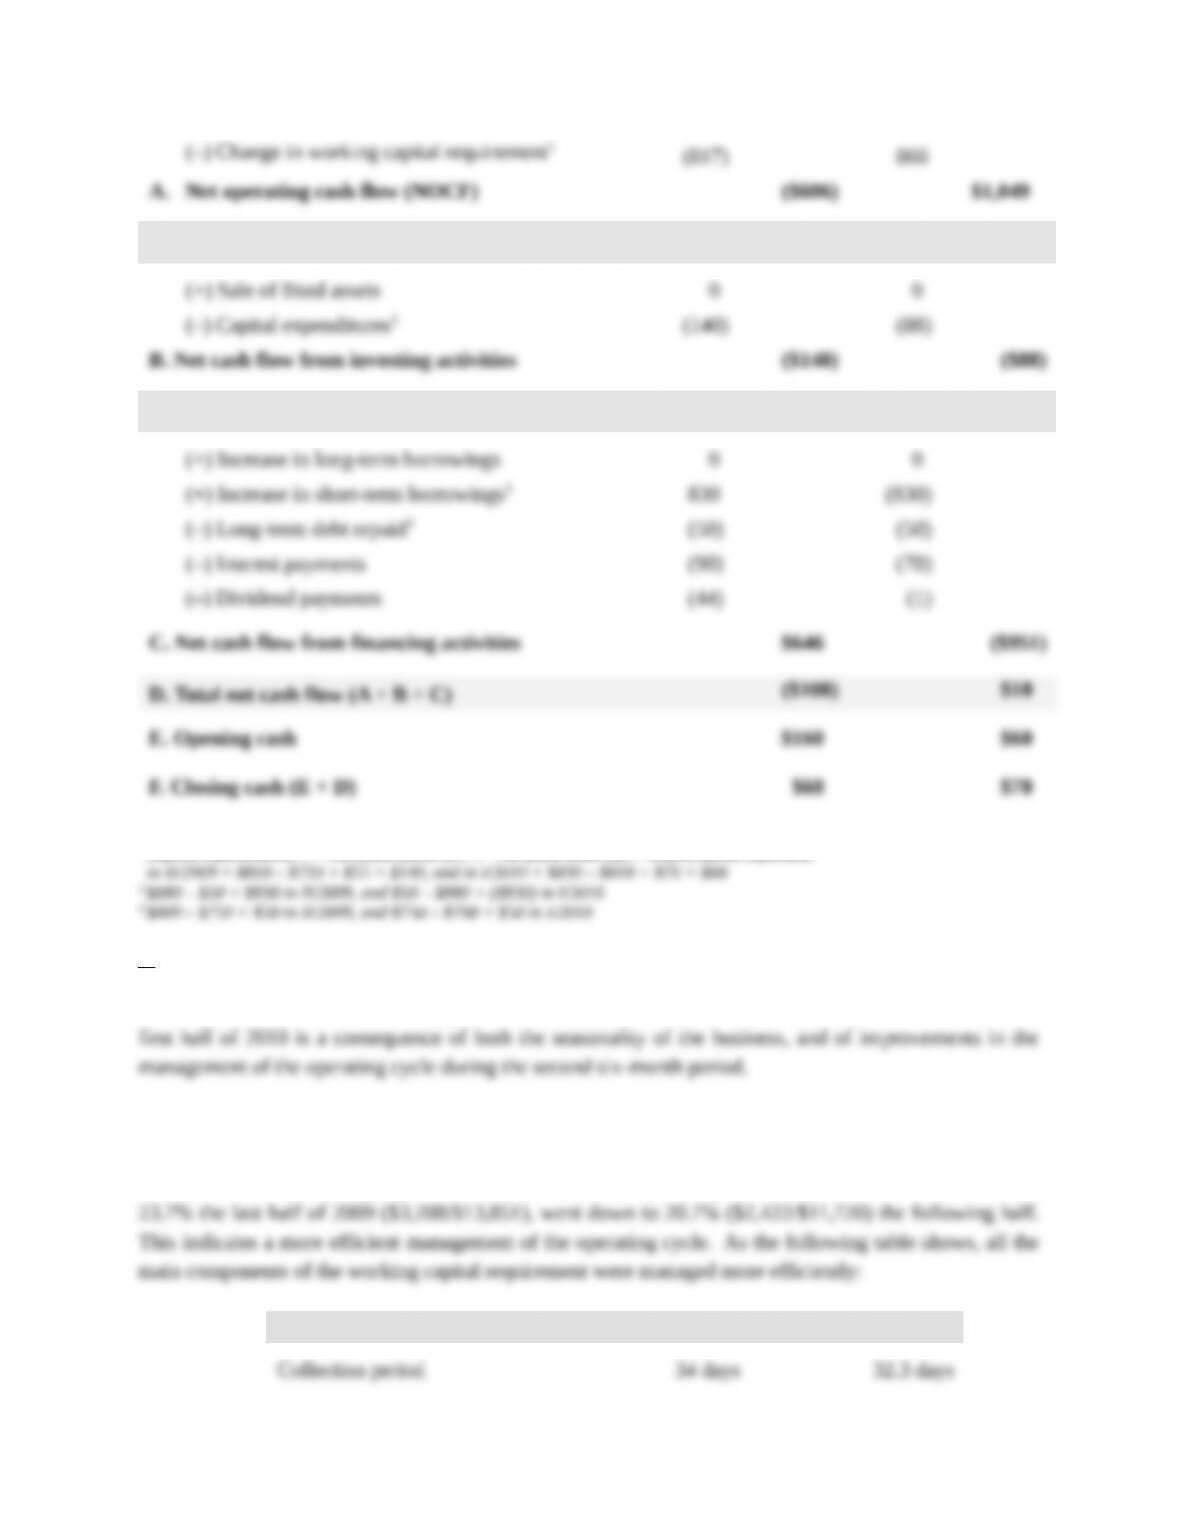
Cash flows from investing activities
Cash flows from financing activities
1 See above table
2 Capital expenditurest + 1 = Net fixed assets end t + 1 – Net fixed asset send t + Depreciation expensest:
b.
The total net cash flow which changed from –$100,000 to +$10,000 from the second half of 2009 to the
Sales were higher in the first part than in the second part of the year ($13.851 million versus $11.720
million). As a result, the firm had to invest more in its operating cycle in the first six months than in the
last six months, other things equal. Further, the working capital requirement-to-revenue ratio, which was
December 31, 2009 June 30, 2010
4-8
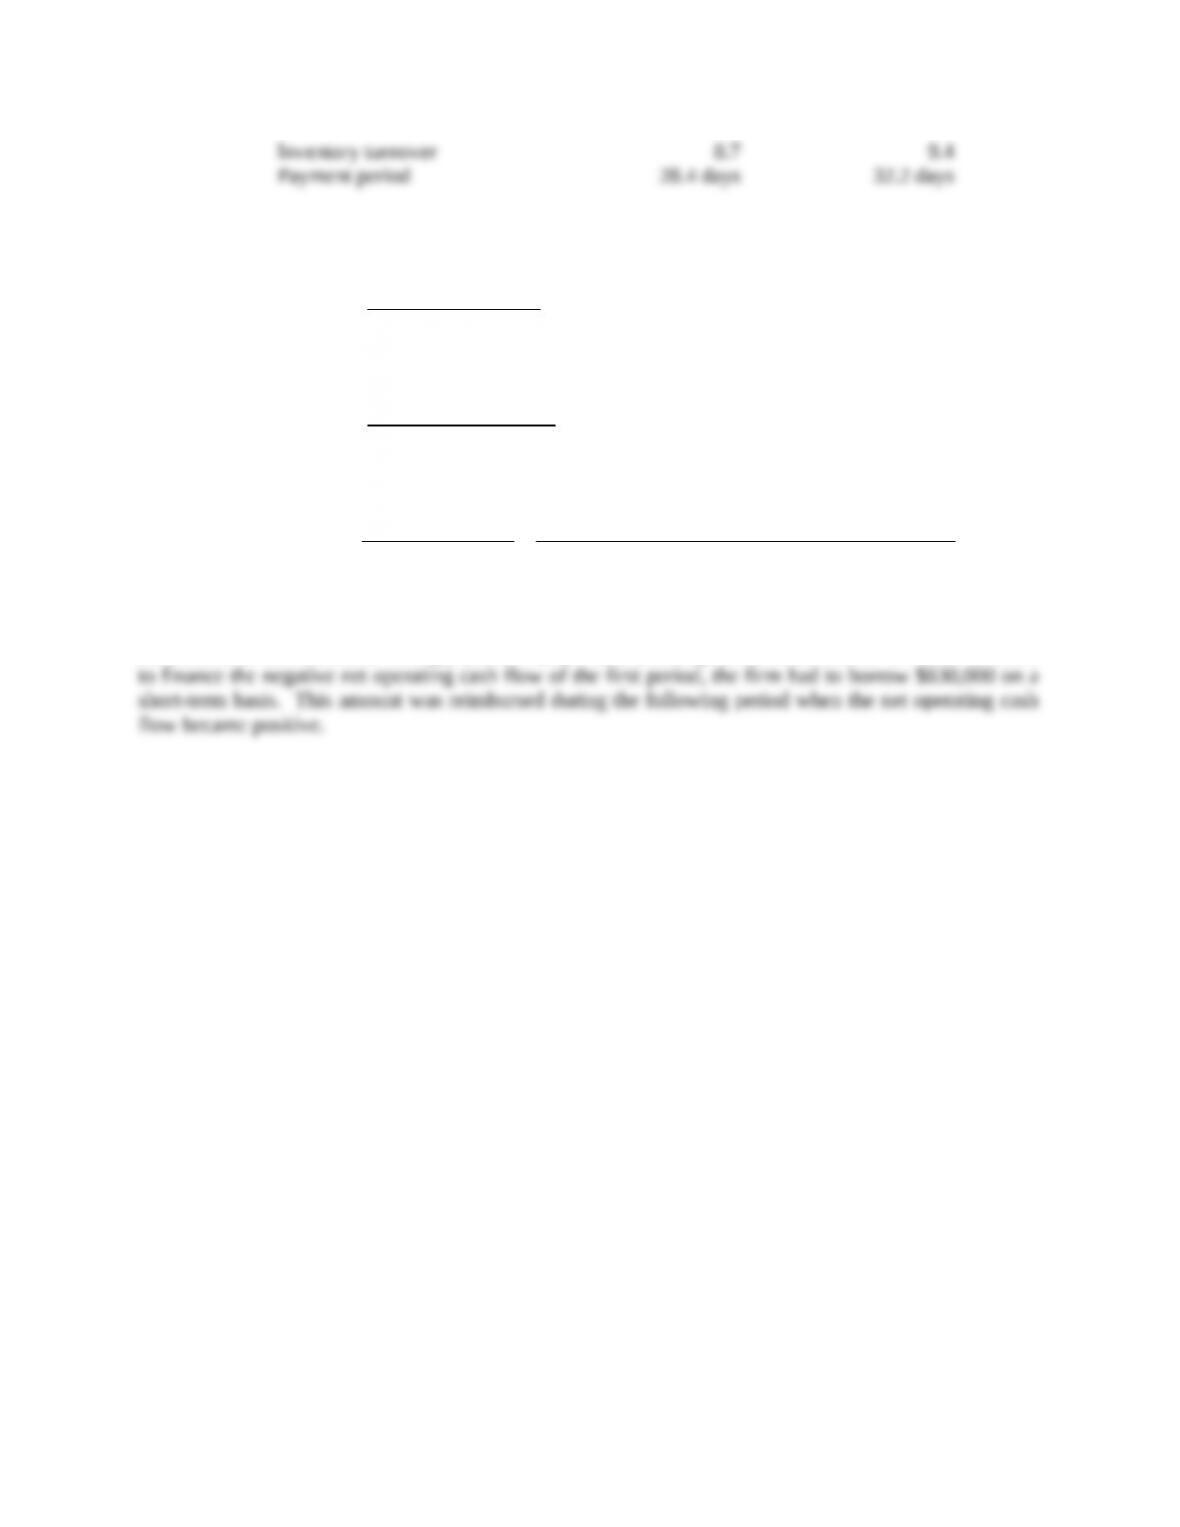
where:
Collection period days =
180/venuesRe
receivableAccounts
Inventory turnover =
sInventorie
2sold goods ofCost
Payment period =
180/]sinventorieinChangesoldgoodsofCost[
payableAccounts
180/Purchases
payableAccounts
As a result of these two effects, the net operating cash flow, which was negative (–$606,000) in the last
six months of 2009, became strongly positive ($1,049,000) during the first six months of 2010. In order
4-9