Chapter 15
Answers to Review Problems
Finance For Executives – 4th Edition
1. Understanding market value added and economic value added.
a.
The firm with the highest market value added, which is not necessarily the one with the highest market
b.
Positive MVA means that the present value of the future stream of EVAs is positive. This does not
c.
d.
e.
Higher ROIC is only half the story. ROIC must exceed the WACC in order to create value. A business will
2. Value drivers.
Drivers related to the management of operations
Strategic value drivers
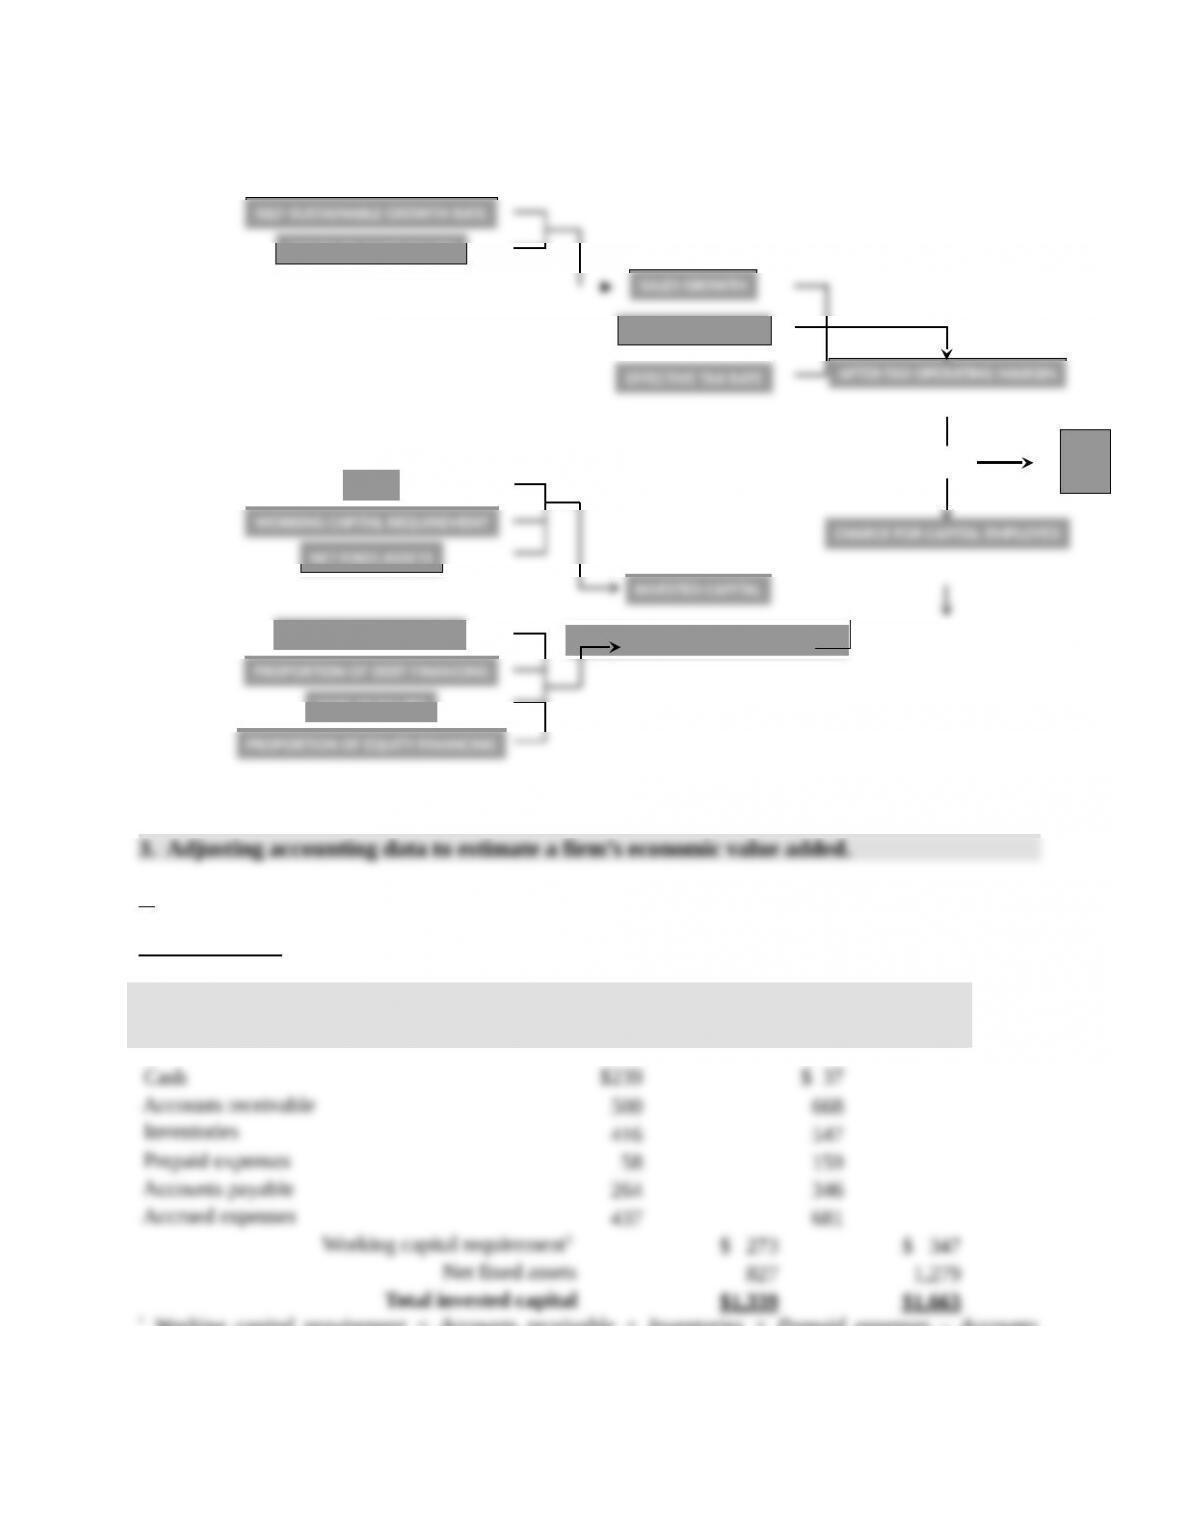
EVA
CHARGE FOR CAPITAL EMPLOYED
SALES GROWTH
AFTER-TAX OPERATING MARGIN
minus
OPERATING MARGIN
EFFECTIVE TAX RATE
SELF-SUSTAINABLE GROWTH RATE
ABILITY TO RAISE EQUITY
WEIGHTED AVERAGE COST OF CAPITAL
CASH
NET FIXED ASSETS
AFTER-TAX COST OF DEBT
COST OF EQUITY
4. Financial structure.
a.
Invested capital
$ millions
December 31,
2009
December 31,
2010
1 Working capital requirement = Accounts receivable + Inventories + Prepaid expenses – Accounts
payable – Accrued expenses
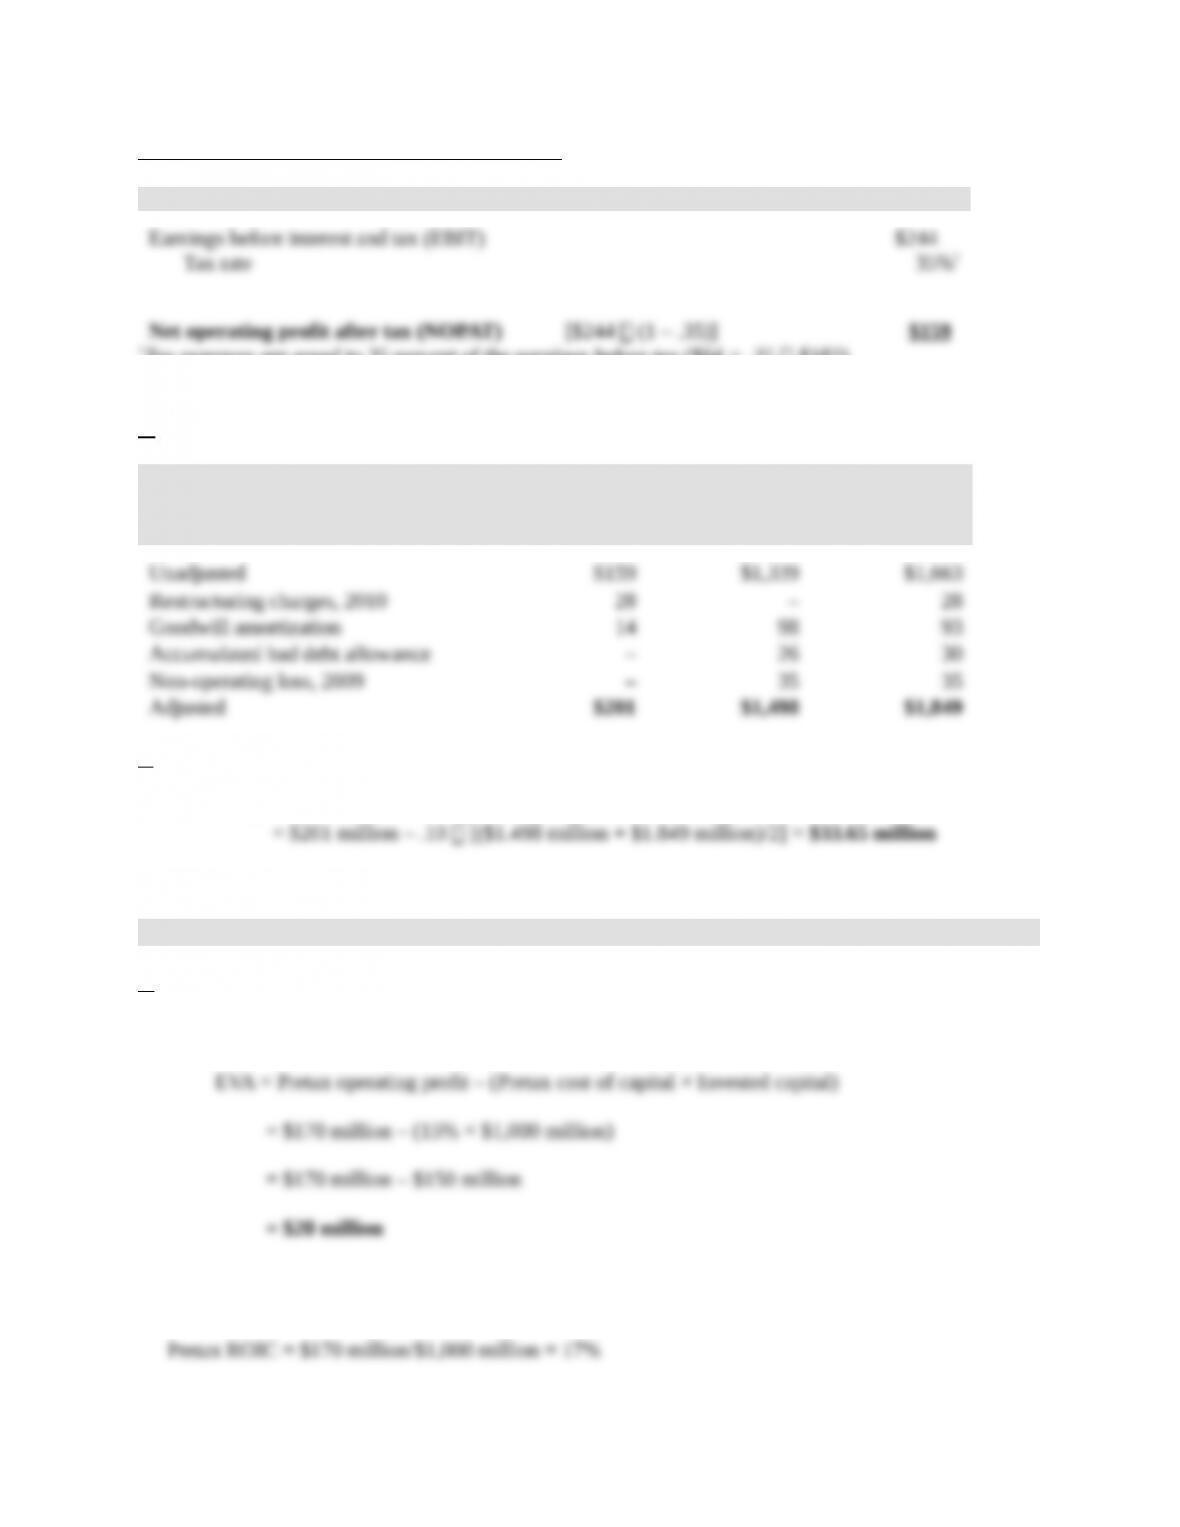
Net operating profit after tax (NOPAT) in 2010
$ millions 2010
1Tax expenses are equal to 35 percent of the earnings before tax ($64 = .35 $182).
b.
Invested Capital
$ millions NOPAT
December 31,
2009
December 31,
2010
c.
EVA10 = NOPAT10 – WACC Average adjusted invested capital10
4. Economic value added analysis.
a.
Pretax economic value added (EVA) based on initial invested capital:
Pretax economic value added (EVA) based on expected return on invested capital (ROIC):
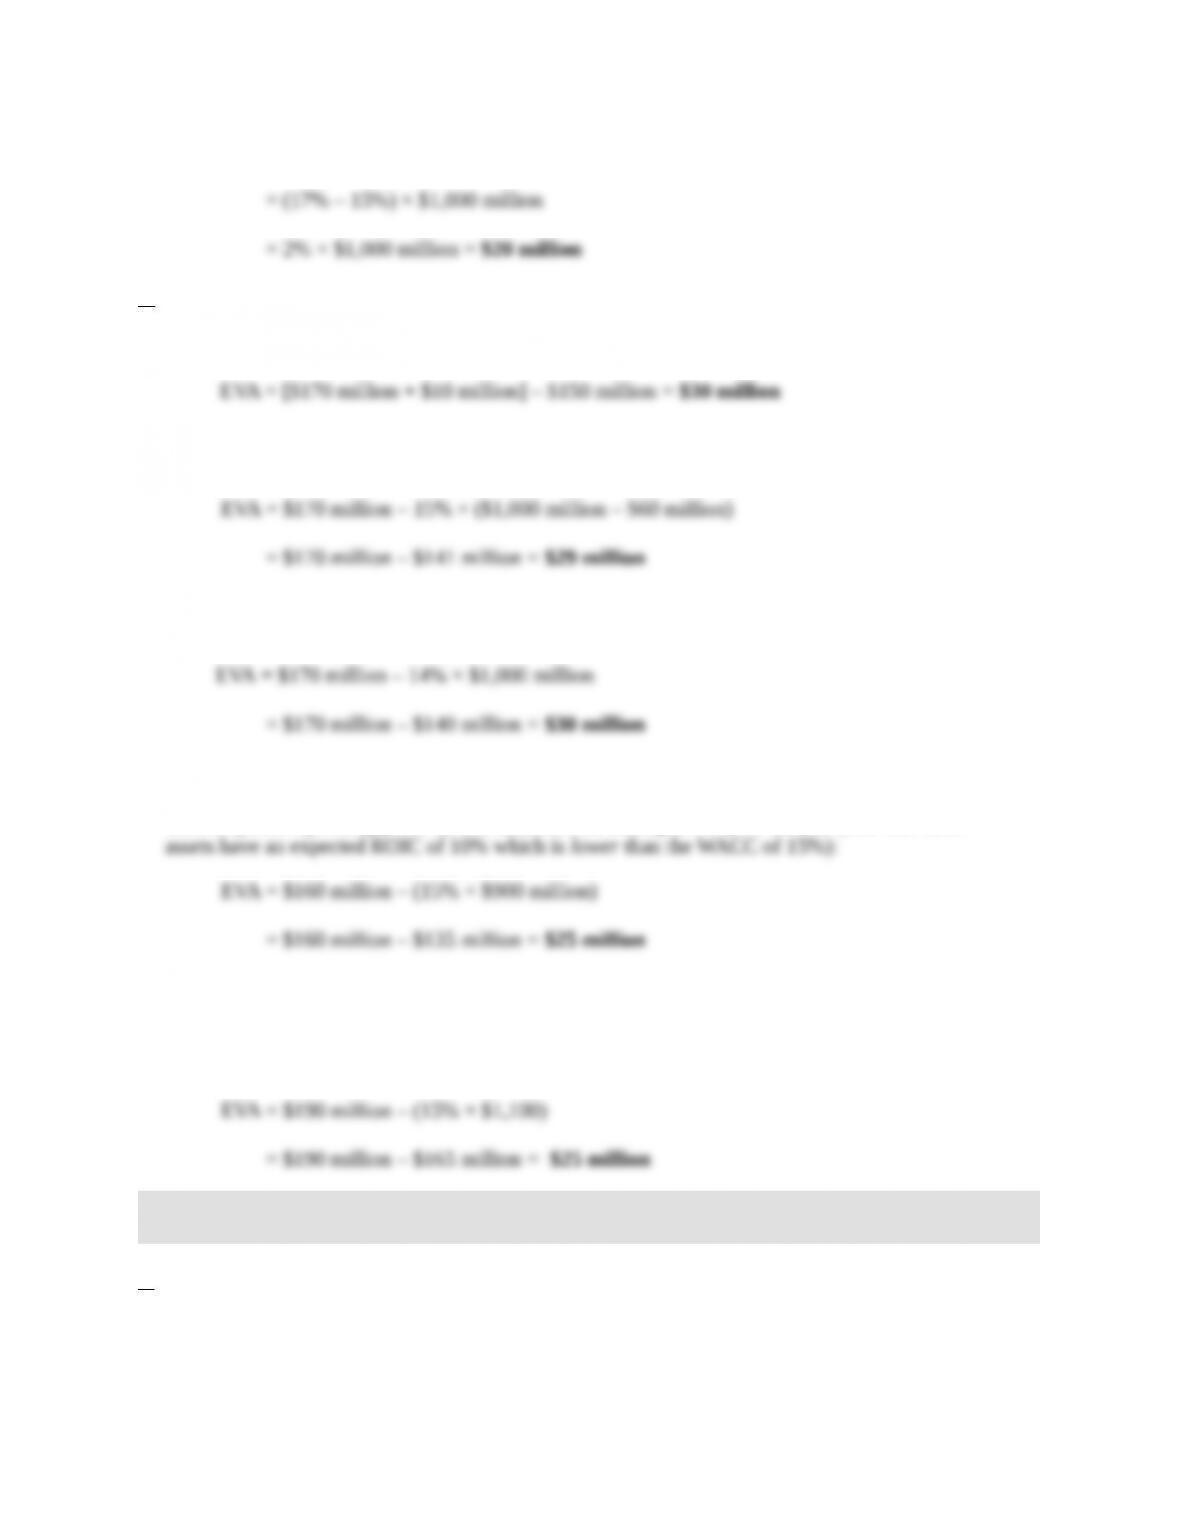
EVA = (Pretax ROIC – Pretax cost of capital) × Invested capital
b.
1. Reducing operating expenses by $10 million would raise EVA by $10 million:
2. Reducing invested capital by $60 million would raise EVA by $9 million:
3. Lowering pretax cost of capital to 14 percent would raise EVA by $10 million:
4. Selling assets (at book value) for $100 million will reduce capital employed to $900 million
and cut pretax operating profit by $10 million, thus raising EVA by $5 million (note that these
5. Buying assets for $100 million will raise capital employed to $1,100 million and add $20
million in pretax operating profit, thus raising EVA by $5 million (note that these assets have
an expected ROIC of 20% which is higher than the WACC of 15%):
5. The relationship between a firm’s market value, its market value added, and its
economic value added.
a.
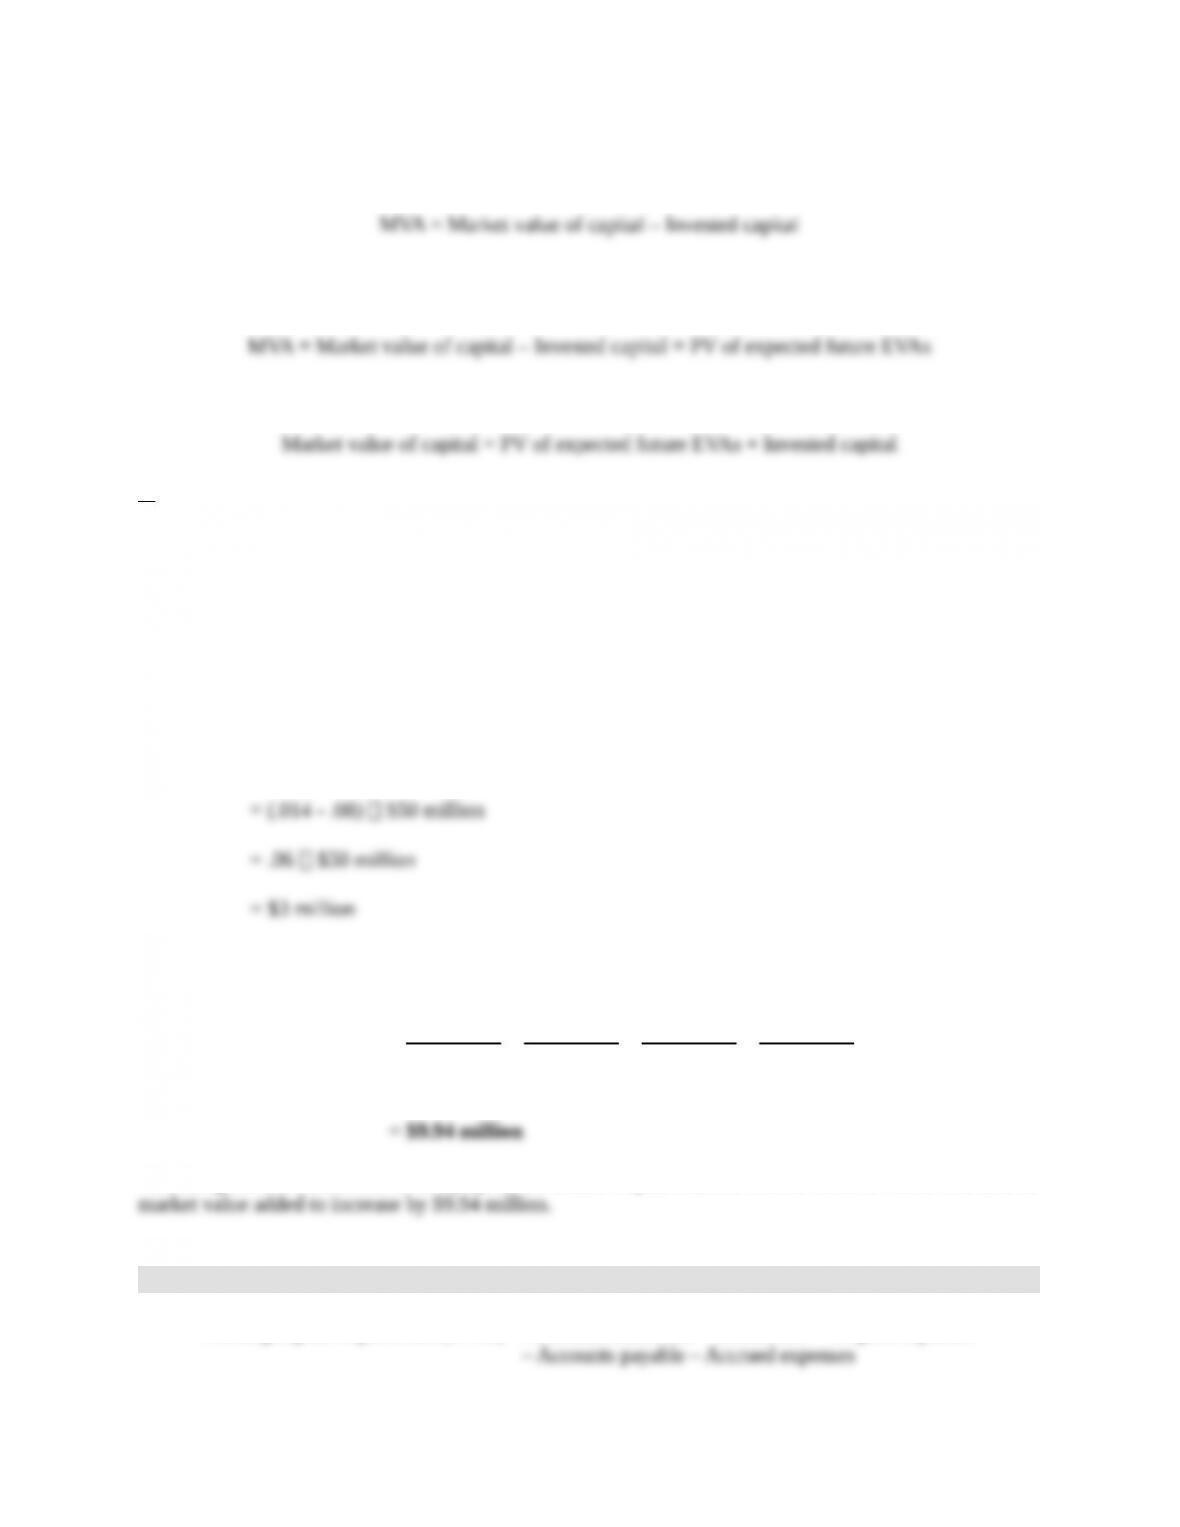
Equation 15.1 defines market value added (MVA) as the difference between the market value of capital
and the amount of capital employed, which is also equal to the amount of invested capital. Thus,:
Since MVA is also equal to the present value of the firm’s expected future economic value added (EVA),
we can write:
or
b.
We show in the chapter that the present value of a project’s expected future EVAs is equal to (1) the
change in the firm’s MVA if the project is undertaken and (2) the net present value of a project. In Chapter
6, we showed that the net present value of a project is equal to the change in the market value of the
firm’s equity after the project is announced. Thus, to get the change in the firm’s MVA and market value
following the adoption of the project, we just have to compute the present value of the expected future
EVAs of the project.
From equation 15.6 and the data given in the question, we can write:
Project EVA = (Return on invested capital – Weighted average cost of capital) Invested capital
Discounting these $3 million for 4 years at a cost of capital of 8 percent, we get:
PV of future expected EVAs
432
.08)(1
million$3
.08)(1
million$3
.08)(1
million$3
.081
million$3
Following the announcement of the project, we should expect that the market value of Value Inc. and its
6. The effect of the management of the operating cycle on the firm’s economic value added.
Working capital requirement (WCR) = Accounts receivable + Inventories + Prepaid expenses
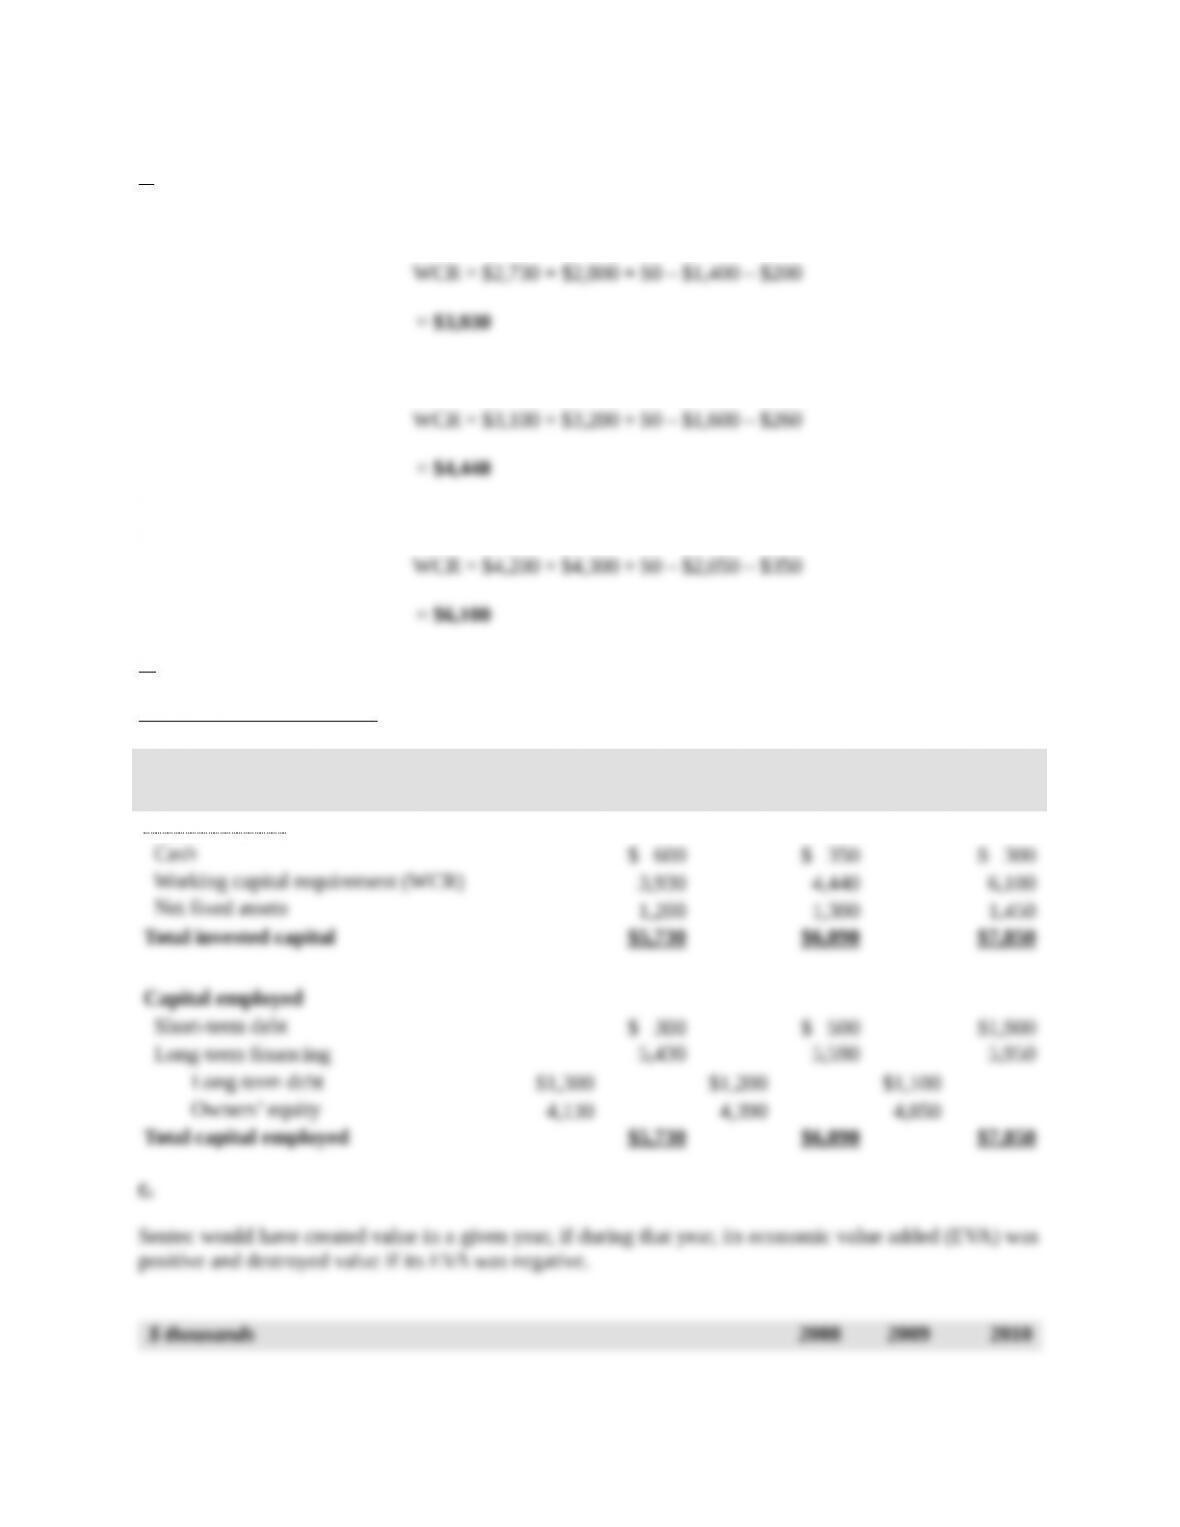
a.
December 31, 2008:
December 31, 2009
December 31, 2010
b.
Managerial balance sheets
$ thousands
December 31,
2008
December 31,
2009
December 31,
2010
Invested capital
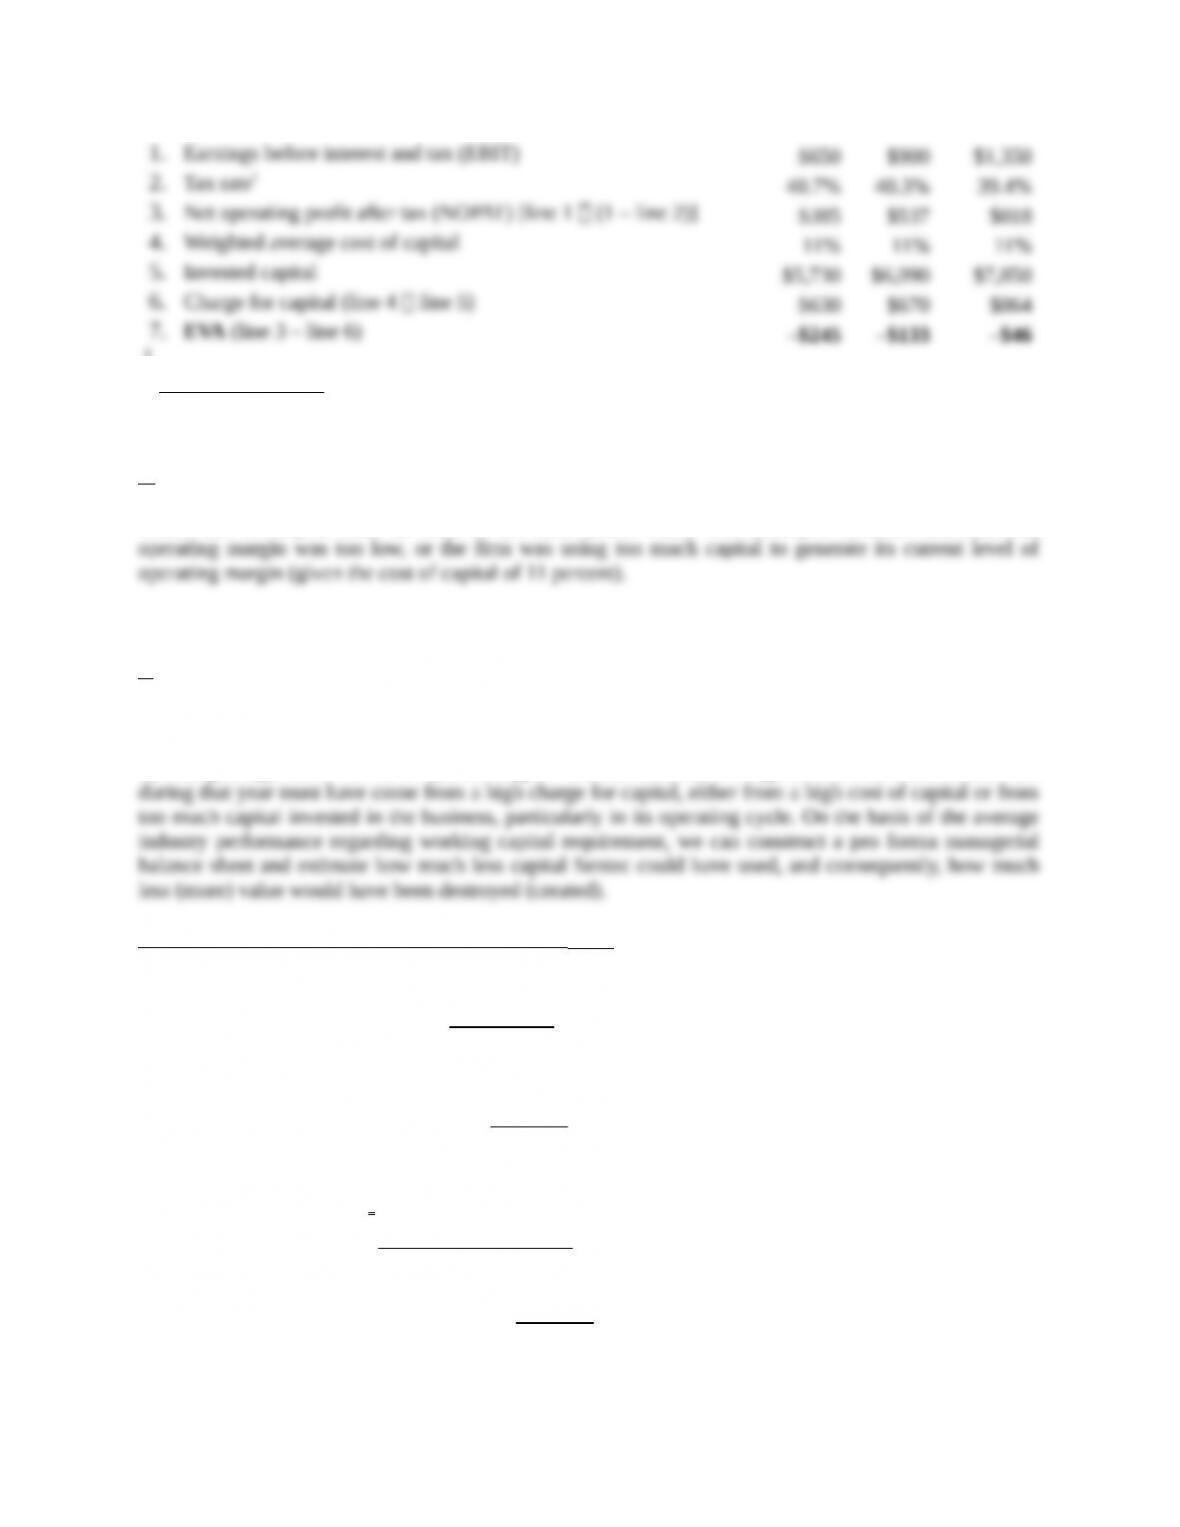
1
taxbeforeEarnings
ensesexptaxIncome
d.
Sentec has destroyed value in each of the three years. Value was destroyed because either/and the
The next question is intended to identify which of the two caused value destruction.
e.
In 2010, Sentec’s operating margin was equal to 4.3 percent ($1,350/$31,600), compared to 3.3 percent
for the industry as a whole. If Sentec destroyed value in 2010, it was certainly not due to an insufficient
operating margin since it was 30 percent higher than the industry average. Therefore, value destruction
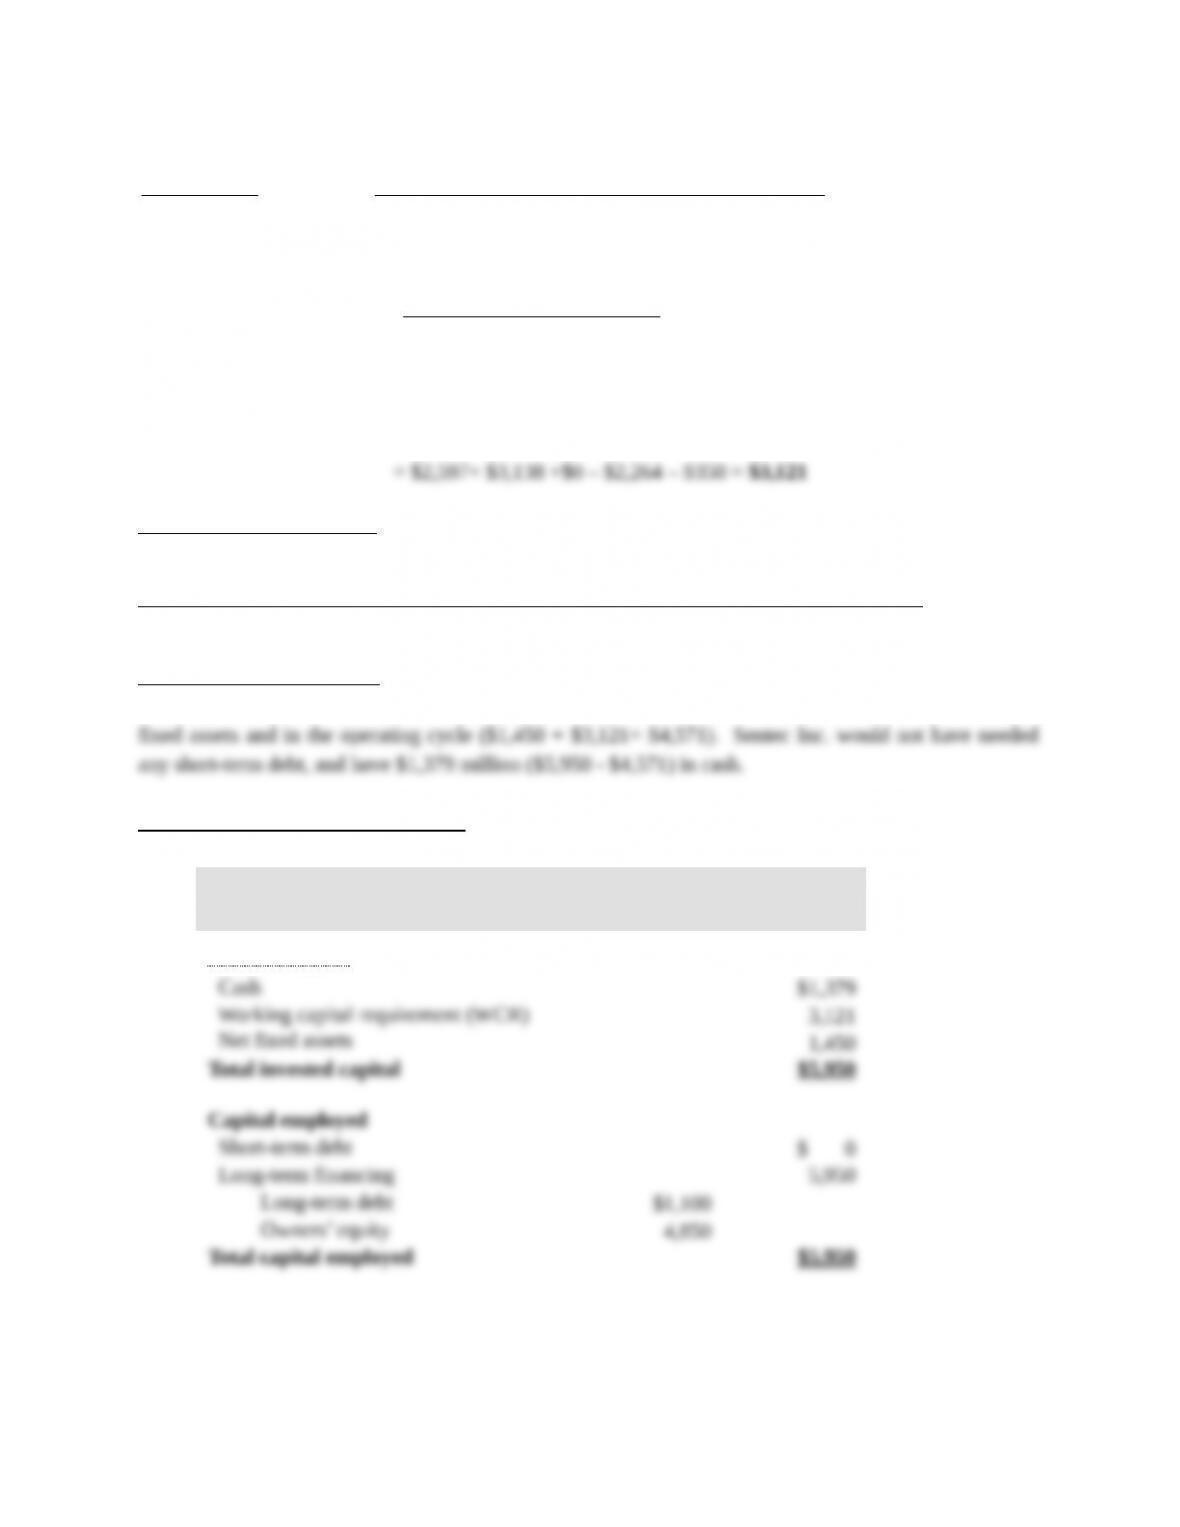
Pro forma working capital requirement (WCR) 12/31/10
Accounts receivable12/31/10 =
days30
365
salesNet
10
$2,597days30
365
$31,600
Inventory 12/31/10 =
8
soldgoodsofCost
10
$3,138
8
$25,100
Accounts payable12/31/10 =
days
sinventorieinChangesoldgoodsofCost
days
Purchases 33
365
33
365
101010
=
$2,264days33
365
$3,200)($3,138$25,100
Working capital requirement = Accounts receivable + Inventories + Prepaid expenses – Accounts payable
– Accrued expenses
Pro forma net fixed assets
Same as before= $1,450
Pro forma long-term financing = pro forma owners’ equity + pro forma long-term debt
Same as before =$5,950
Pro forma short-term debt
Note that the amount of long-term financing ($5,950) would have been higher than the investment in
Pro forma managerial balance sheet
$ thousands
December 31,
2010
Invested capital
If Sentec had managed its operating cycle like the average firm in the industry in year 2010, its invested
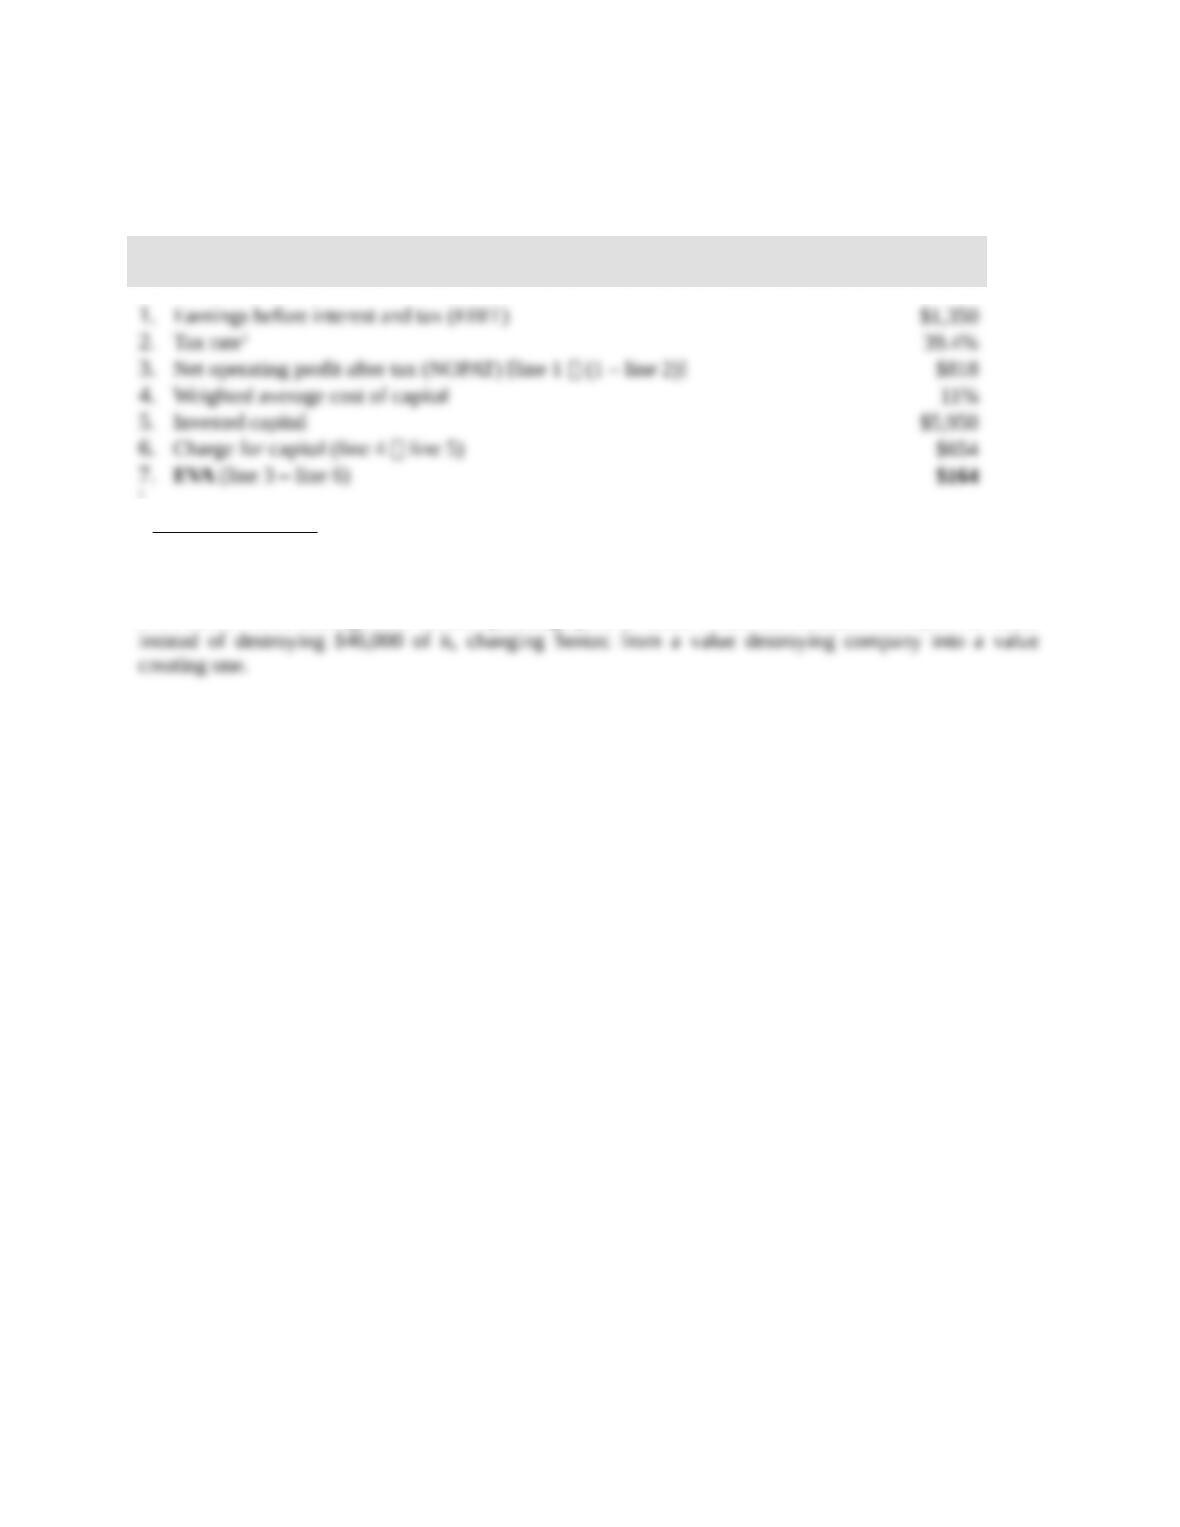
capital would have been equal to $5.950 million instead of $7.850 million. As a result, its economic value
added would have been positive and equal to $164 million, as shown in the following table:
$ thousands
Pro forma
2010
1
taxbeforeEarnings
ensesexptaxIncome
Note that a better management of the operating cycle in 2010 would have created $164,000 of value