
Check Your Understanding (Example 3)
4
P = D(1 – r)
4
⎛⎞
P
1
44
1−
()
r
1
r +
1
1
Check Your Understanding (Example 4)
4 years is to the right of the point of intersection.
Check Your Understanding (Example 5)
9 ÷ 12 = 0.75; 9 months is 0.75 years.
Check Your Understanding (Example 6)
26,600 ÷ 2 = 13,300
Applications
1. To some people, the value of a car is more than
2. Use y = a(1 – b)x, where a = 40,000 and
b = 0.0525.
4. Use y = a(1 – b)x, where a = 19,700 and
b = 0.1.
5. 100 ÷ 12 ≈ 8.33; 100 months is 8 1
b = 0.08625.
y = 21,000(1 – 0.08625)x
For 5 years, y =
5
1100
⎛⎞
−
E.
For M years, divide M by 12, y = 12
1100
⎛⎞
−
⎜⎟
⎝⎠
E.
7. 1 – 0.785 = 0.215 = 21.5%;
8. 1 – 0.8625 = 0.1375 = 13.75%;
78 ÷ 12 = 6.5
= 18,547.23(0.8625)w
in L2. Use the STAT PLOT feature on your
9b. Enter the data from the table into your
y = 17,895.97*(0.89)x.
9c. 1 – 0.89 = 0.11 = 11%
9d. y = 17,895.97*(0.89)3.5 ≈ 11,902.01
12. 6,700 = A(1 – 0.1415)8
13. D = A(1 – E/100)2
0.62333 = (1 – r)5
–0.09023901 = –r
15. 32 ÷ 12 = 2.66667
45,000 = 52,000(1 – r)22
3
0.8653846154
8 = 1 – r
0.9472256259 = 1 – r
–0.0527743741 = –r
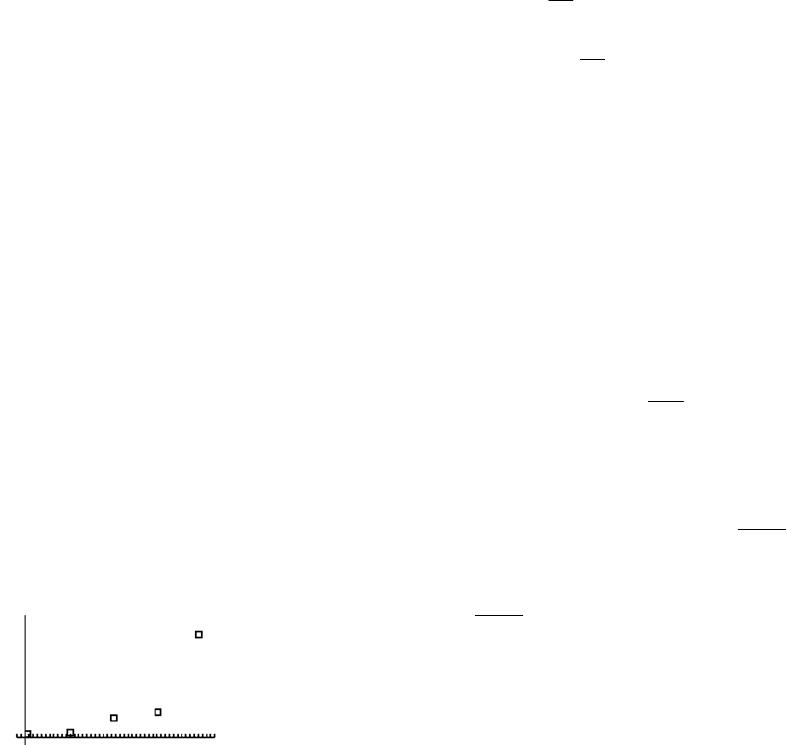
18. $550 × 12 = $6,600
The yearly expense equation is 6,600x + 10,000.
The exponential depreciation equation is
equal to the amount paid after about 1.8 years.
y = 46,600(1 – 0.103)x. Use a graphing
(2.46, 35,361.67). The value of the car will be
20a. The minimum on the x-axis is 0, the maximum is
50, and the scale is 1. The minimum on the
20b. Enter the data from the table into your
The equation of the regression line is
Lesson 5-7 Driving Data
Check Your Understanding (Example 1)
Check Your Understanding (Example 2)
Check Your Understanding (Example 3)
Check Your Understanding (Example 4)
Check Your Understanding (Example 5)
Check Your Understanding (Example 6)
Check Your Understanding (Example 7)
Applications
3. 778 ÷ 50 = 15.56, which is about 15.6 h
0.56 × 60 = 34, so it will take 15 hours 34 min.
10a. x ÷ 42 = 42
x
10b. $2.38 × 42
x
= 238
42
.
x
12d. 26 × $4.30 = $111.80
12e. 15 × $D = $15D
12f. G × $P = $GP
C
13. $59.76 ÷ $4.15 = 14.4
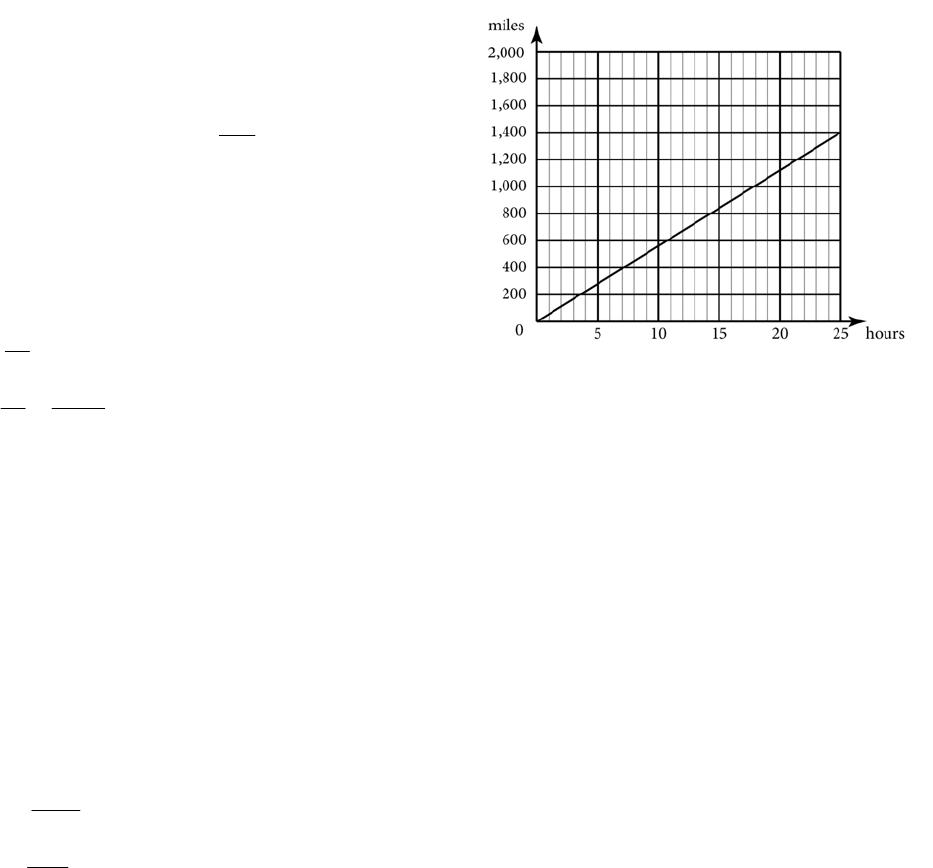
15b. The graph is shown below.
15c. When hours = 14, miles is about 800.
15d. When miles = 500, hours is about 9.
17a. 3.80 × 1.07 ≈ 4.07
17b. 3.80 × 0.69 ≈ 2.62
17k. 178.50 × 0.69 ≈ 123.17
17l. 178.50 × 1.16 ≈ 207.06

18a. 85 ÷ 1.07 ≈ 79.44
22a. 87.42 ÷ x = 87 42.
x
x
x
x
x
x
x
Lesson 5-8 Driving Safety Data
Check Your Understanding (Example 1)
Check Your Understanding (Example 2)
Check Your Understanding (Example 3)
Check Your Understanding (Example 4)
Extend Your Understanding (Example 4)
2
Applications
1. The total braking distance is substantial for a
2d. 5,720 ÷ 60 ≈ 95
3a. 42 × 1 = 42
3b. 42 × 5,280 = 221,760
3f. 5,280 × x = 5,280x
4a. 80 × 1 = 80
4b. 80 × 1,000 = 80,000
5a. 55 × 1 = 55
5b. 55 × 1,000 = 55,000
6c. 1,000x ÷ 60 = 1000
60
,
x
6d. 1000
60
,
x
÷ 60 = 1000
60
,
x
× 1
60 = 1000
3 600
,
,
x
9b. (0.1 × 52)2 × 5 = (5.2)2 × 5 = 27.04 × 5 = 135.2
9c. 52 + 135.2 = 187.2
10a. The reaction distance is about 1 foot for each
mile per hour, so a car going 40 mi/h has a
reaction distance of about 40 feet.
10b. The reaction distance is about 1 foot for each
mile per hour, so a car going 30 mi/h has a
reaction distance of about 30 feet.
10c. The reaction distance is about 1 foot for each
10h. (0.1 × 20)2 × 5 = (2)2 × 5 = 4 × 5 = 20
10i. (0.1 × 15)2 × 5 = (1.5)2 × 5 = 2.25 × 5 = 11.25
10j. (0.1 × 5)2 × 5 = (0.5)2 × 5 = 0.25 × 5 = 1.25
11. 70 + (0.1 × 70)2 × 5 = 70 + (7)2 × 5 = 70 + 49 × 5
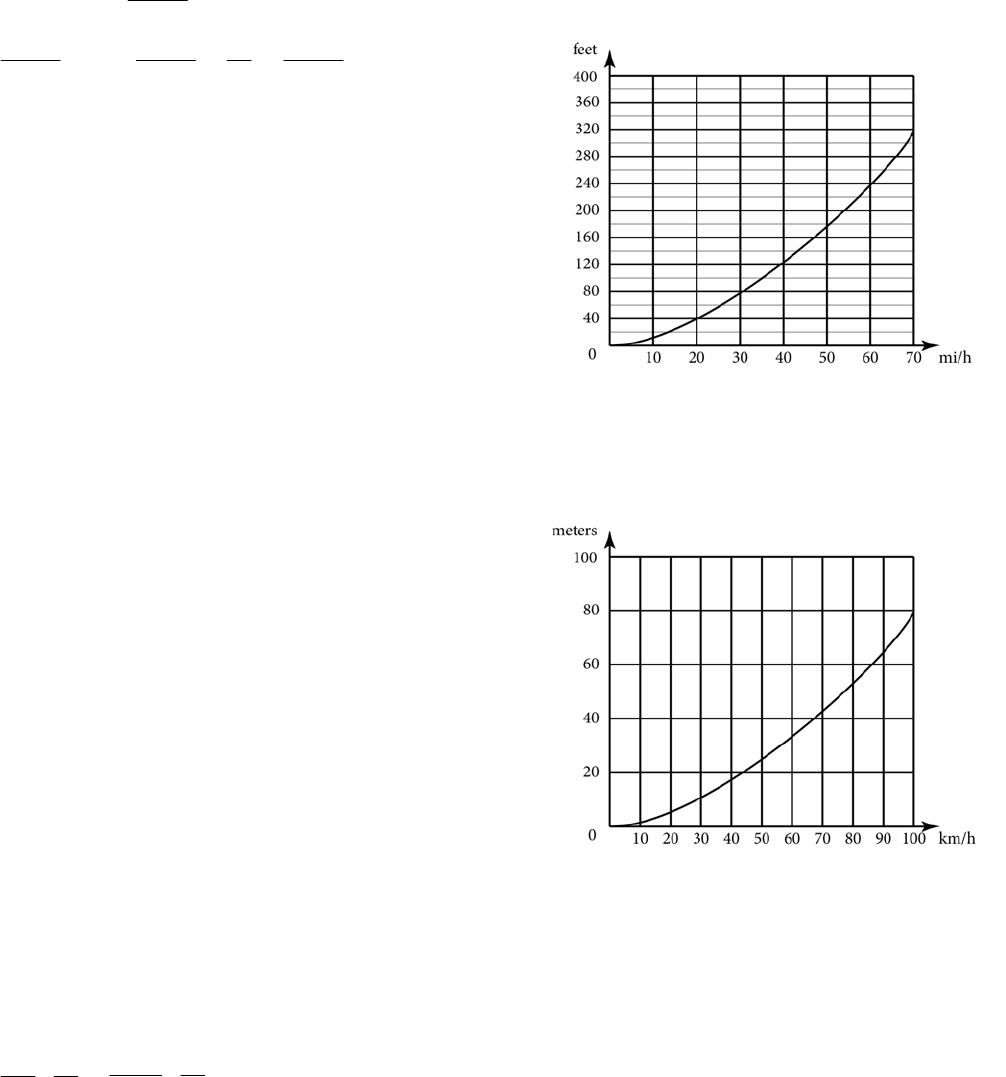
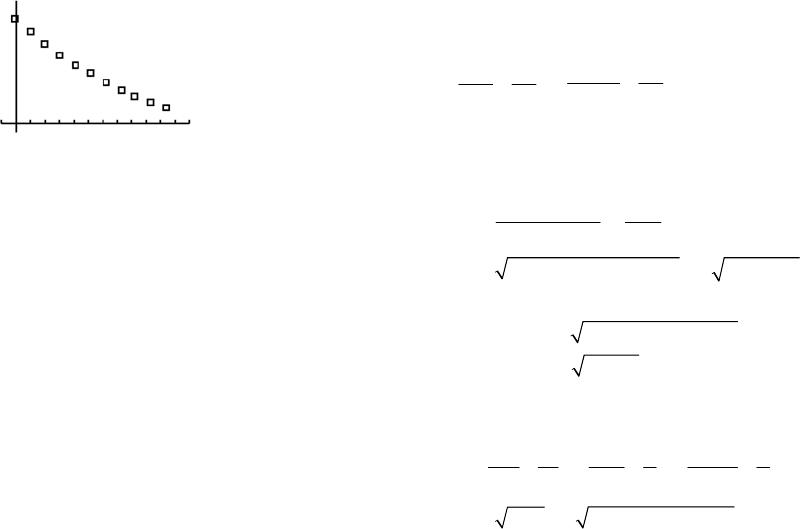
13a. Enter the equation as Y1 = X^2/20+X in a
graphing calculator. The graph is shown below.
13b. When mi/h = 53, feet is about 185.
14a. Enter the equation as Y1 = X^2/170+X/5 in a
graphing calculator. The graph is shown below.
14b. When km/h = 60, meters is about 33.
14c. When meters = 60, km/h is about 85.
15a. Use the conversion factor 1.60934.
Lesson 5-9 Accident Investigation
Data
Check Your Understanding (Example 1)
Check Your Understanding (Example 2)
Check Your Understanding (Example 3)
Applications
1. Clearly the quote is said in jest, but there is a
great deal of truth in it. It highlights the fact that it
The police were correct since according to the
formula, Rona’s minimum skid speed was
approximately 39.7 miles per hour.
6a. The formula needs to find average, so use
7. D = 36 45
+= 81
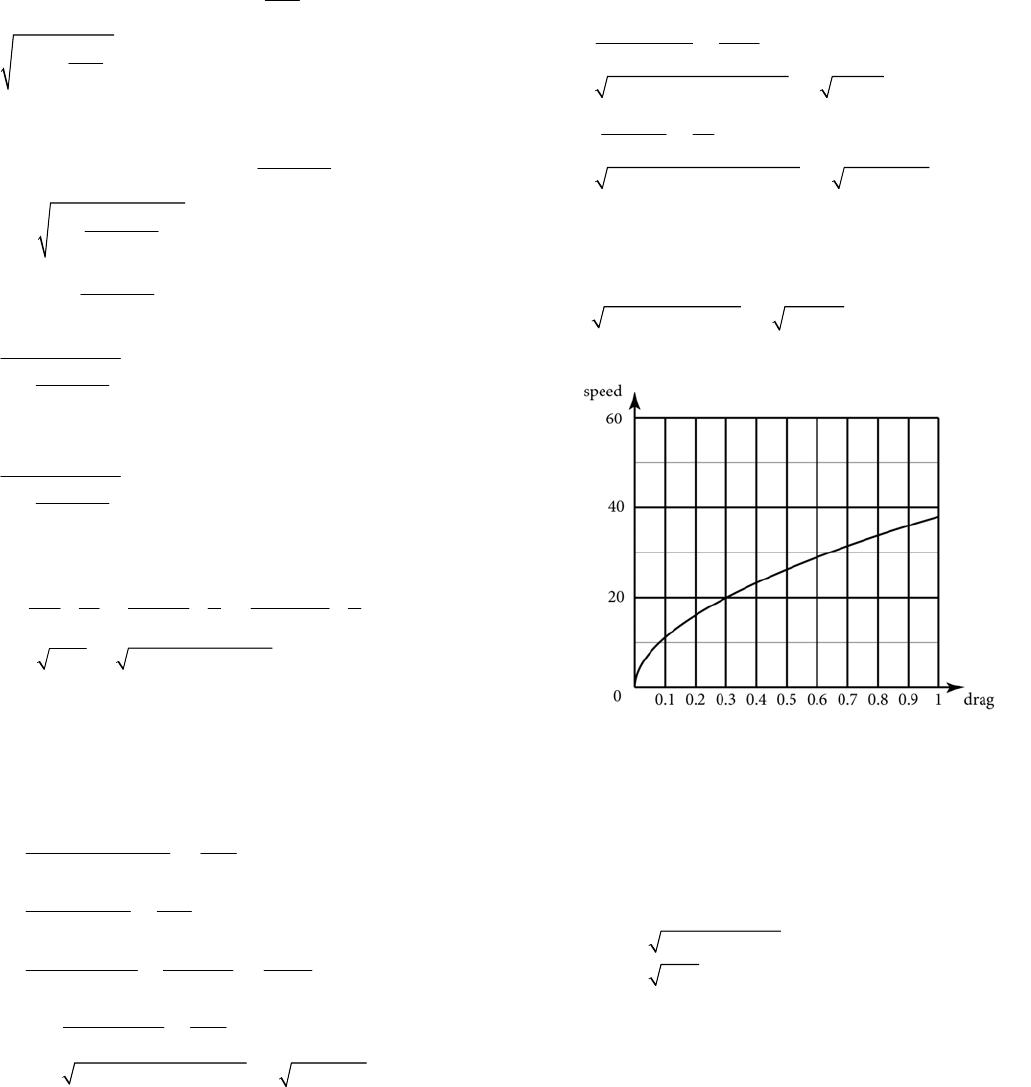
8d. When braking efficiency is 20% (0.2), the speed

10. 35 = 30 0.97 0.9×× ×D
35 =
26.19D
11b. 50 ± 4
2 = 50 ± 2
50 + 2 = 52
14a. r =
82
+
CM
M =
31 3
83 2
+
() = 961 3
24 2
+ ≈ 41.5
16b. AE × EB = CE × ED
()
()
2r – M =
2
4
()
CD
M
2r =
2
()
CD
8
x =
8
x=
2
x
2676
+
x
Assessment
Really? Really! Revisited
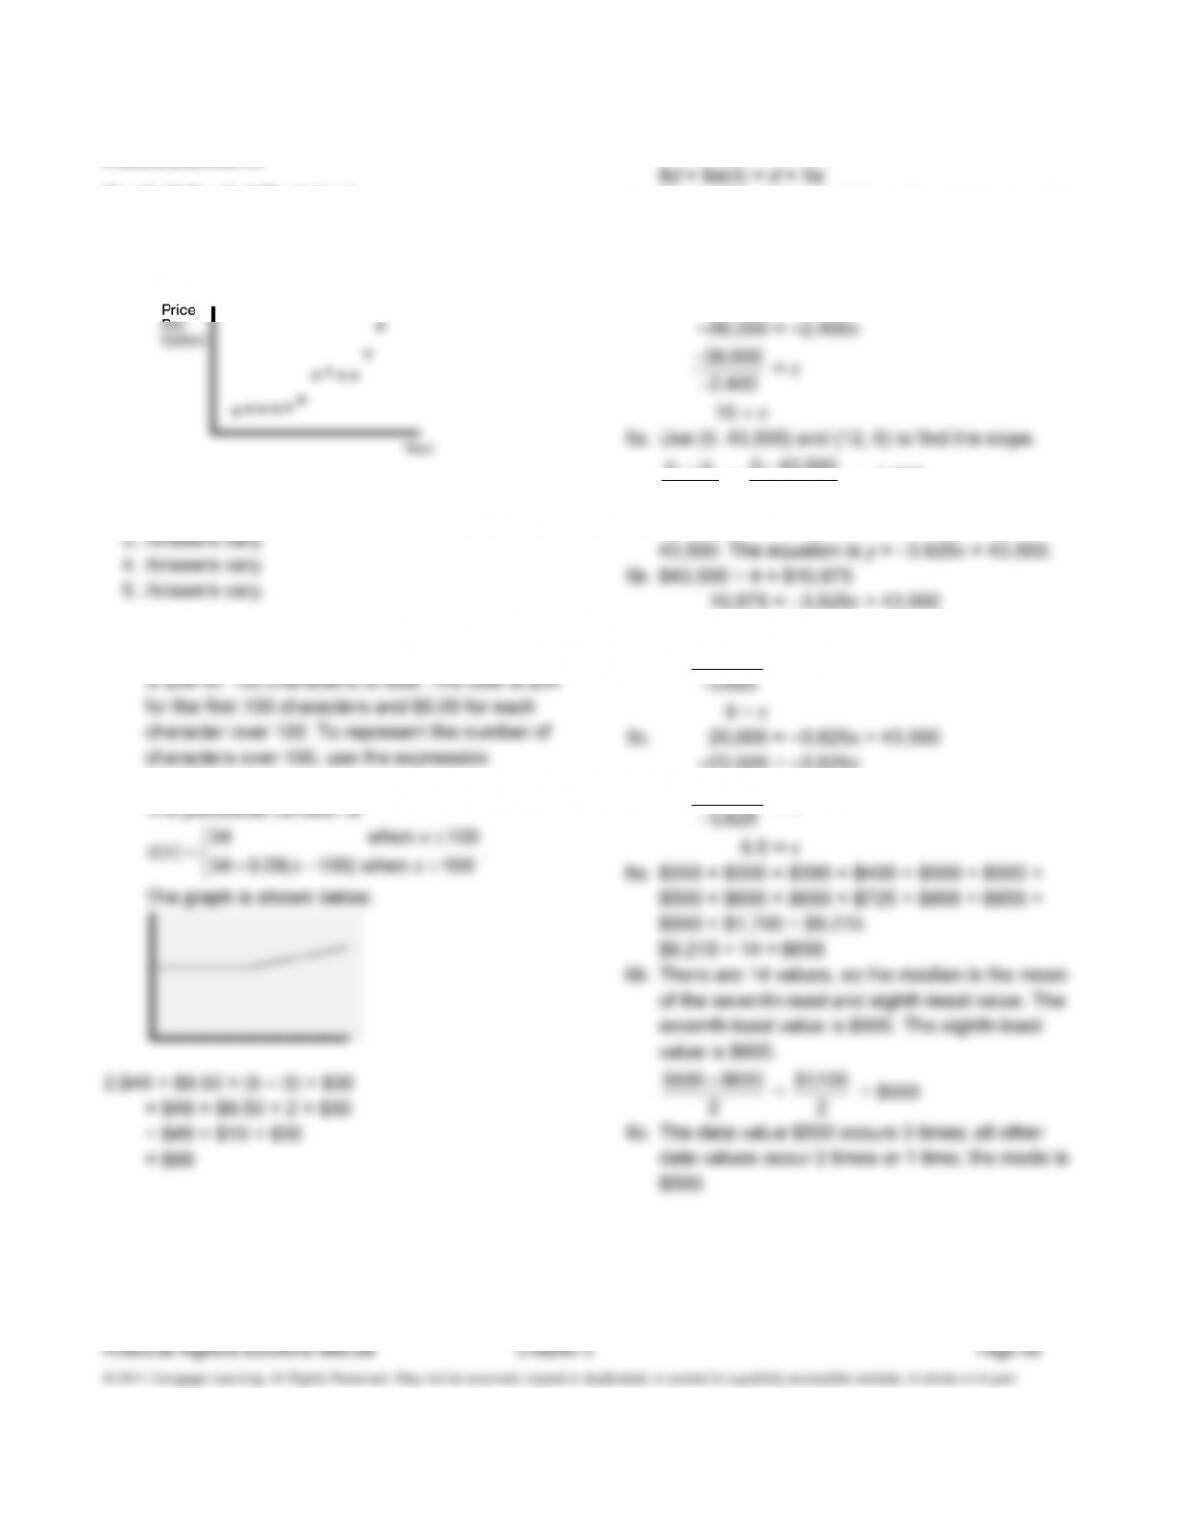
1. Answers vary. Sample graph is shown
below.
2. Answers vary.
Applications
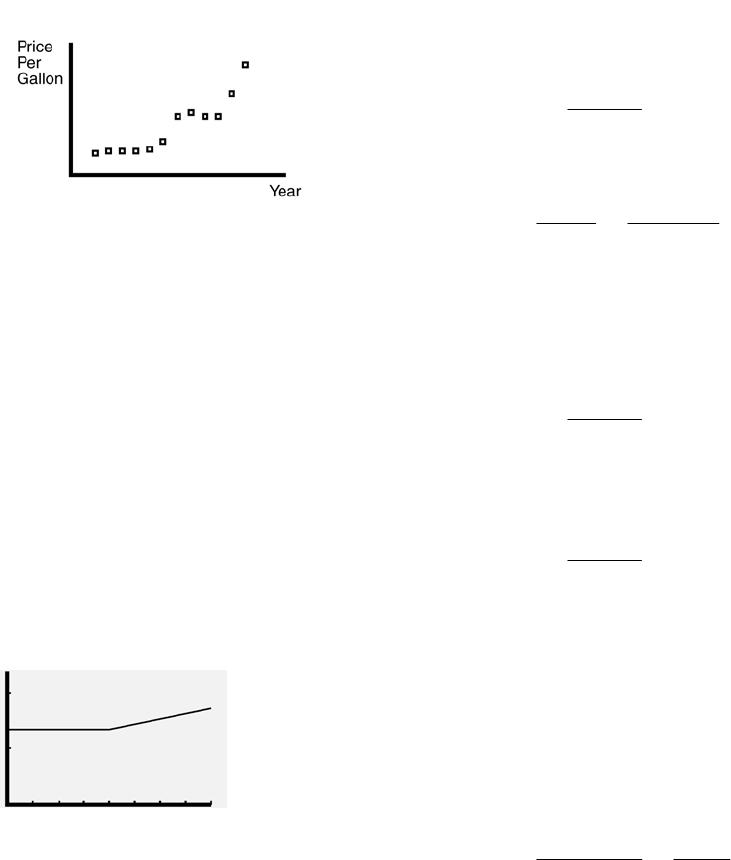
1. Let x = number of characters in the ad. The cost
x – 100.
3. 6 – 3 = 3, so there are 3 extra lines.
4a. The y-intercept is 36,000, so the maximum value
(or its original price) is $36,000.
4b. The amount of value it loses each year is the
slope, which is $2,400.
4c. 0 = –2,400x + 36,000
21
21
−
−
y
y
x
x = 043500
12 0
−
−
, = –3,625
The slope is –3,625 and the y-intercept is
–32,625 = –3,625x
32 625
−
,
–23,500 = –3,625x
23 500
−
,
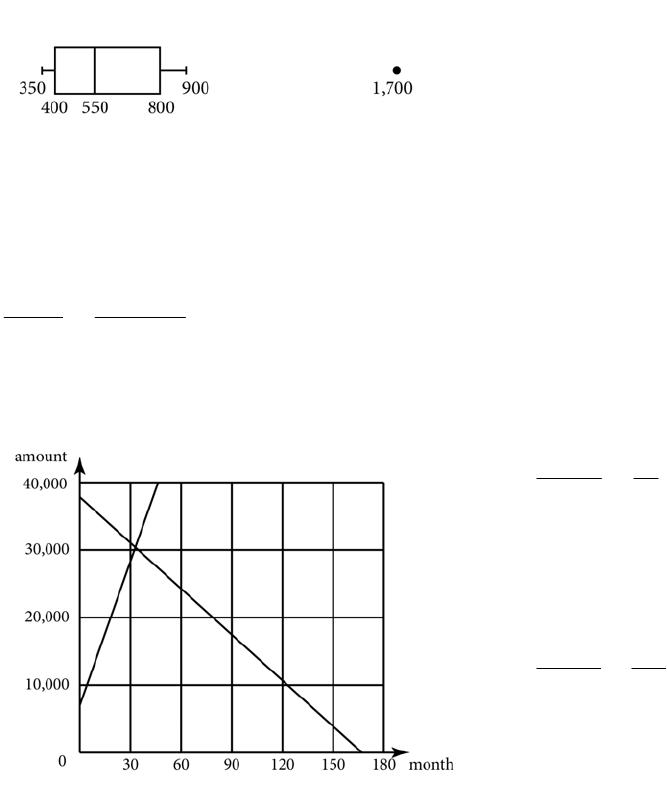
6d. Q2: from part b, the median is $550.
Q1: there are 7 values in the lower half of the
6e. IQR = Q3 – Q1 = $800 – $400 = $400
6f. $400 – 1.5($400) = $400 – $600 = –$200; There
7a. Amount financed = $37,800 – $7,000 = $30,800.
The monthly payment is $710.
7b. The graph is shown below.
7c. Use a graphing calculator to find the point of
intersection of the lines. Rounded to the nearest
hundredth, the coordinates of the point of
intersection are (31.87, 30,628.88). This means
car is less than what was invested in it.
8a. There are 25 leaves in the table, so 25 teachers
An alternate approach is to add the leaves (118)
8c. There are 25 values, so the median is the
thirteenth-least value, which is 38.
8d. The data values 19, 20, 36, 37, 55, 59, and 62
seventh-least value. The sixth-least value is 20.
The seventh-least value is 23.
20 23
2
+ = 43
2 = 21.5
11d. The medical bills are covered by PIP insurance.
8g. 38 is Q2. By definition, 50% of the values are
8h. IQR = Q3 – Q1 = 57 – 21.5 = 35.5 12,239.74 ≈ A, which rounds to $12,200
8i. 38 is Q2. 57 is Q3. By definition, 25% of the
13a. 1 – 0.815 = 0.185 = 18.5%
175 × $1.49 = $260.75 10a. The minimum on the x-axis is 0, the maximum is
17b. (0.1 × 64)2 × 5 = (6.4)2 × 5 = 40.96 × 5 = 204.8 ft
37.85 > 30, so Marlena does not have enough
room ahead of her to bring the car to a safe stop
10b. Enter the data from the table into your
S = 30 71 0.95 0.98×× × = 1,983.03 ≈ 44.53
The police were correct.
10c. 1 – 0.91 = 0.09 = 9%
10d. 66 ÷ 12 = 5.5; so 66 months is 5.5 years
y = 31,985.36*(0.91)5.5 ≈ $19,040, which rounds
20. 52 = 30 1.05 0.8×× ×D