Chapter 1
Lesson 1-1 Business Organization
Check Your Understanding (Example 1)
Check Your Understanding (Example 2)
Check Your Understanding (Example 3)
Extend Your Understanding (Example 3)
Applications
1. Edison is stressing that good ideas are not
enough. A strong work ethic is necessary to
achieve. The word perspiration represents that
effort is required.
3. Set up a proportion.
3
x
Divide by the remaining six shareholders: 72% ÷
6 = 12%. Each of the other shareholders owns
Kristen invested $51,000 – $15,000 = $36,000.
$,
x
x
7a. If the ratio is 1:4:7, then Thea owns 41
12 3
=
of
7b. Joe owned 1
12 and Thea owned 4
12 , so after
Financial Algebra Solutions Manual Chapter 1 Page 2
© 2011 Cengage Learning. All Rights Reserved. May not be scanned, copied or duplicated, or posted to a publicly accessible website, in whole or in part.
8. 72% = 0.72
9. Yes, if that shareholder has more than 50% of
10. To get the number of shares held by the top
11a. no
11b. 3411
111273
,
, = 0.0306(100) = 3%
13. Since this is a partnership, owners are
14. Since the amount of the lawsuit, y, is greater
than the value of the company, w, subtract the
partner can only lose their equal share of the
value of the business, worth 675 000
$, , or
15 = 30 000 000
$, ,
16b. Yes, 20 000 000 2
=
$, ,
30 000 000 3
$, ,
in part a by 2 to get the amounts invested by all
the investors and set that expression equal to
the total value.
Investor 1 = $100,000
Lesson 1-2 Stock Market Data
Check Your Understanding (Example 2)
Check Your Understanding (Example 3)
Check Your Understanding (Example 4)
Check Your Understanding (Example 5)
Check Your Understanding (Example 6)
Applications
1. Both the buyer and the seller think that their
success of a stock and “take the money and
4b. 106,077 × 100 = 10,607,700
4c. 288,012 × 100 = 28,801,200
$1.74 = $30.59.
$.
30 59
= –0.0568 × 100
PetroChina Company Ltd’s daily high is
10. Since the price on April 25 is higher than April
H6=1000*G6/100, or H6=10*G6.
12b. H9=1000*G9/100, or H9=10*G9
to get the previous days price: F8=C8–D8.
Lesson 1-3 Stock Market Data
Charts
Check Your Understanding (Example 1)
Check Your Understanding (Example 2)
Check Your Understanding (Example 4)
Check Your Understanding (Example 5)
April 28: approx. $690
April 29: approx. $679
April 30: approx. $667
May 1: approx. $651
May 2: approx. $660
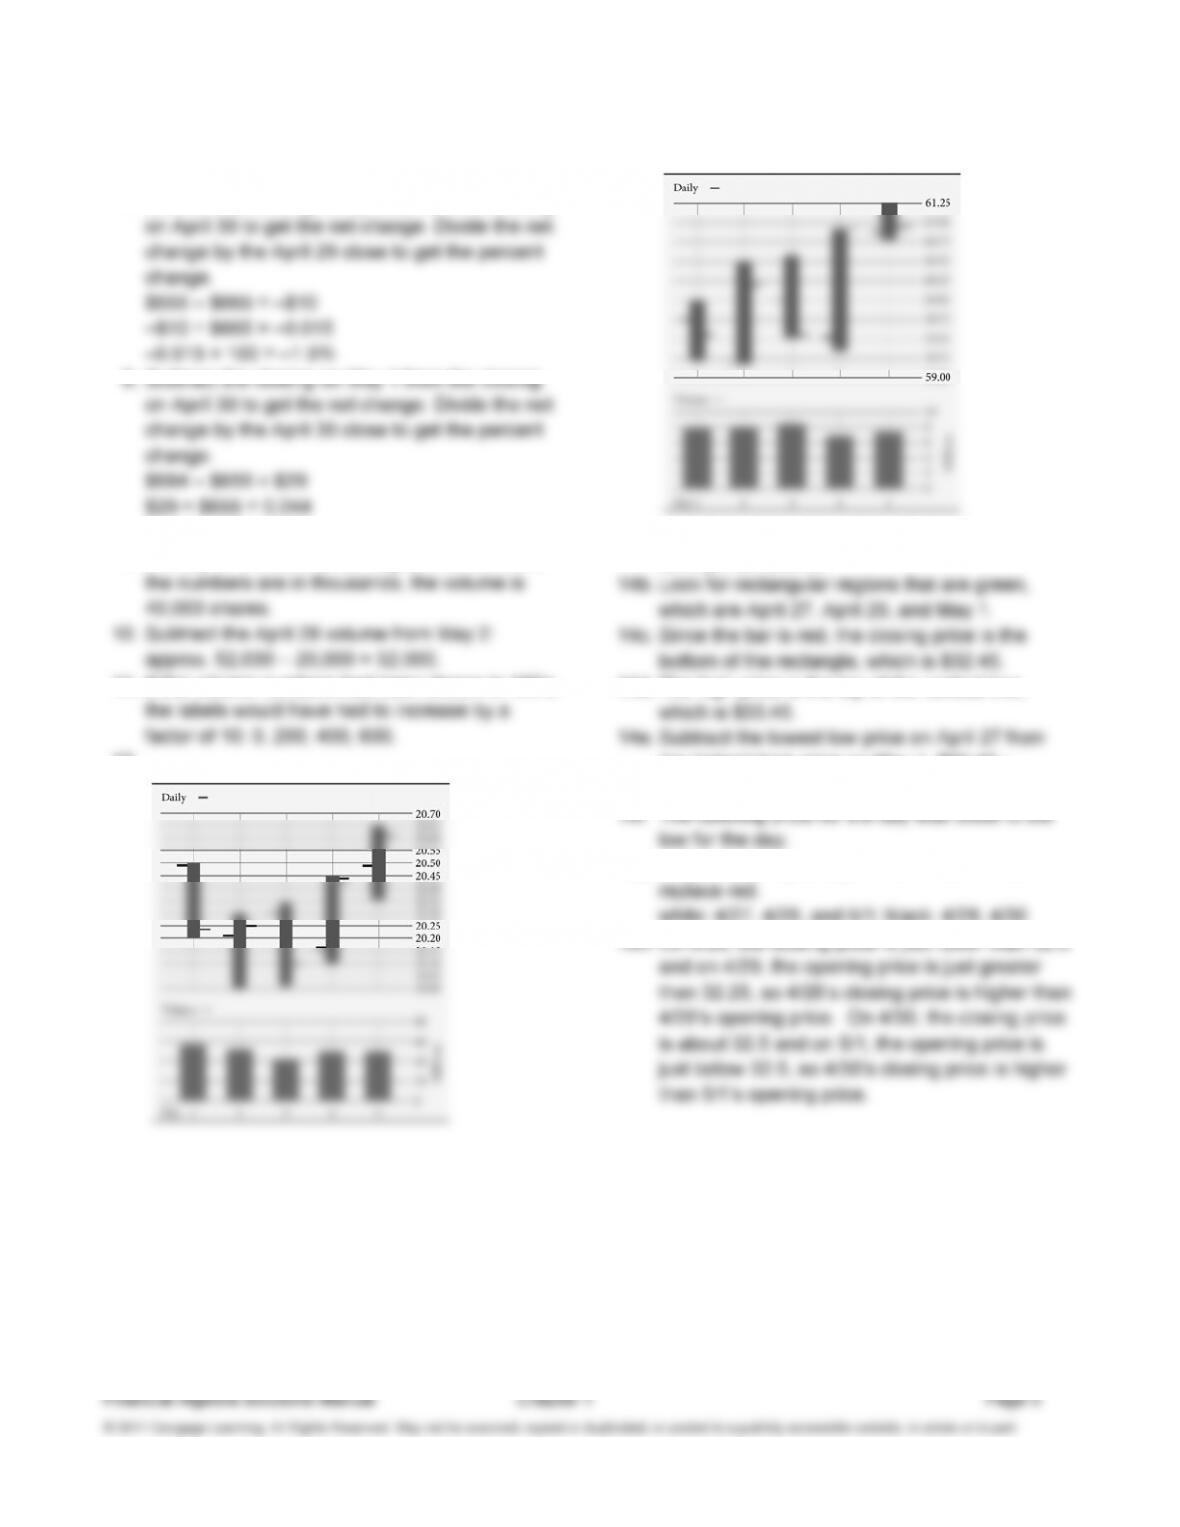
6. On May 2 the line segment on the right is at
approximately $653.
7. Subtract the closing on April 29 from the closing
0.044 × 100 = 4.4%
9. The top of the volume bar aligns with 40. Since
11. If the volume numbers had been shown in 100’s,
12.
13.
14a. Look for rectangular regions that are red, which
are April 28 and 30.
14d. The high price is the top of the vertical line,
the highest high price on May 1: $33.45 –
$31.95 = $1.50.
14g. White would replace green and black would
white: 4/27, 4/29, and 5/1; black: 4/28, 4/30
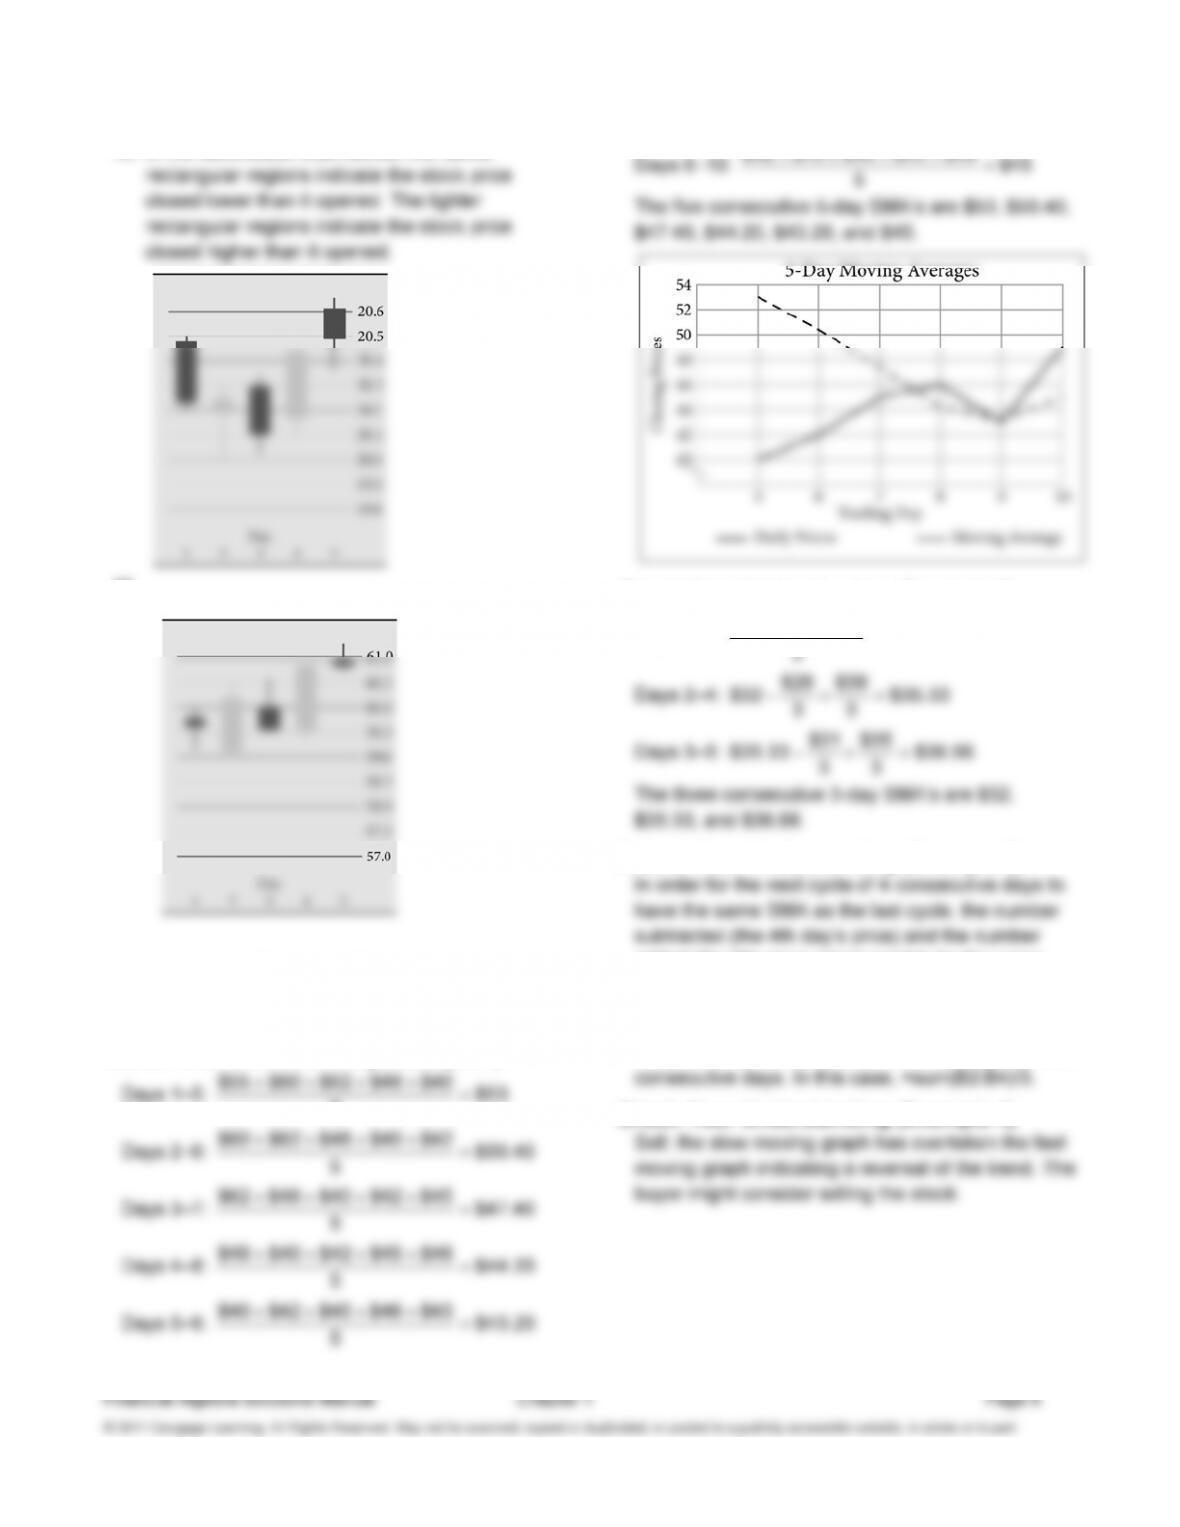
15. In the candlestick chart below, the darker
16.
Lesson 1-4 Simple Moving
Averages
Check Your Understanding (Example 1)
5
Days 6–10: $42 $45 $46 $43 $49 $45
++++ =
Check Your Understanding (Example 2)
Days 1–3: $28 $31 $37 $32
++ =
Extend Your Understanding (Example 2)
added (the 8th day’s price) need to be the same.
Check Your Understanding (Example 3)
Since it is a 3-day SMA start in the row where the
3rd price is, D4. The formula is the average of three
Check Your Understanding (Example 4)
Applications
1. Conceivably, a river could have an average
2. Days 1–3:
$7.78 $8.08 $7.99 $7.95
++ =
3. Days 1–5:
Days 5–9:
$285.04 $290.80 $296.02 $291.01 $293.41
++++
$291.62
=
$56.97 $56.35 $56.83 $57.16 $56.83
+++ =
5. Days 1–6:
$92.60 $92.46 $92.45 $91.79 $93.07 $89.70
6
+++++
$90.63
=
Days 5–10:
6. Days 1–2:
$101.96 $101.80 $101.88
2
+=
Days 6–7:
$105.12 $105.66
$105.03 $105.39
22
−+=
7. Days 1–3:
$66.21 $65.90 $67.05 $66.39
3
++ =
Days 8–10: $66.65 $65.21
$66.12 $65.64
33
−+=
8. Days 1–4:
$121.69 $122.85 $120.70 $123.61 $122.21
+++=
9. Days 1–6:
Financial Algebra Solutions Manual Chapter 1 Page 9
© 2011 Cengage Learning. All Rights Reserved. May not be scanned, copied or duplicated, or posted to a publicly accessible website, in whole or in part.
10. The formula for 7-day SMA’s will start in the 7th
row. The formula is to add the 7 day’s closing
1-May 25.99 25.91
11. The formula for 10-day SMA’s will start in the
Date Closing
Price
10-Day
SMA
31-Mar 19.92
1-Apr 20.33
12. The formula for 2-, 3-, and 5-day SMA’s will start
row and dividing the sum by 2, 3, or 5
respectively.
Date Closing
Price
2-Day
SMA
3-Day
SMA
5-Day
SMA
13. Crossovers occur at days 4 and 19. On Day 4,
the fast moving average rises above the slow
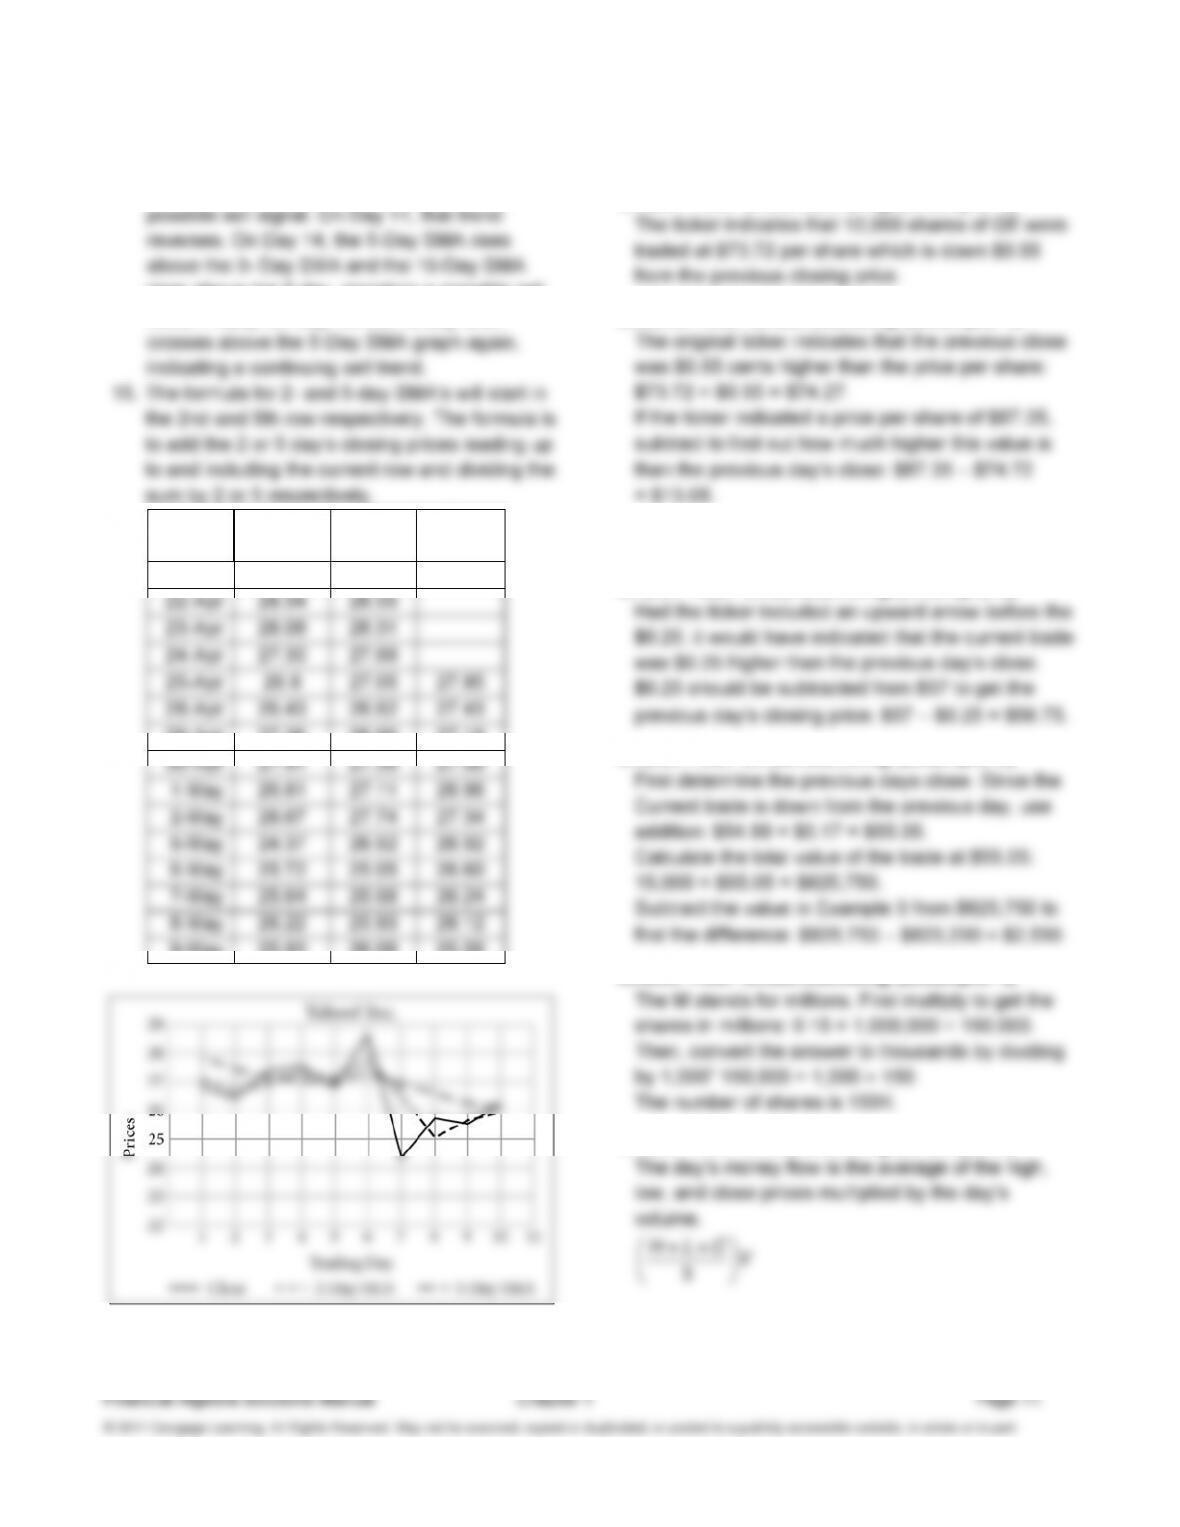
14. Crossover occurs on Day 9 where the 3-Day
SMA dips below the 5-Day SMA indicating a
rises above the 3-day, signaling a possible sell
trend. Finally, on Day 15, the 10-day SMA
Date Closing
Price
2-Day
SMA
5-Day
SMA
21-Apr 28.55
29-Apr 27.36 26.90 27.19
9-May 25.93 26.08 25.58
Lesson 1-5 Stock Market Ticker
Check Your Understanding (Example 1)
Extend Your Understanding (Example 1)
This means the price per share of this trade was
$13.08 higher than the previous close.
Check Your Understanding (Example 2)
Check Your Understanding (Example 3)
Check Your Understanding (Example 4)
Check Your Understanding (Example 5)
3
⎜⎟
⎝⎠