151
P9.9 Complete an analysis for budget, price and volume variances.
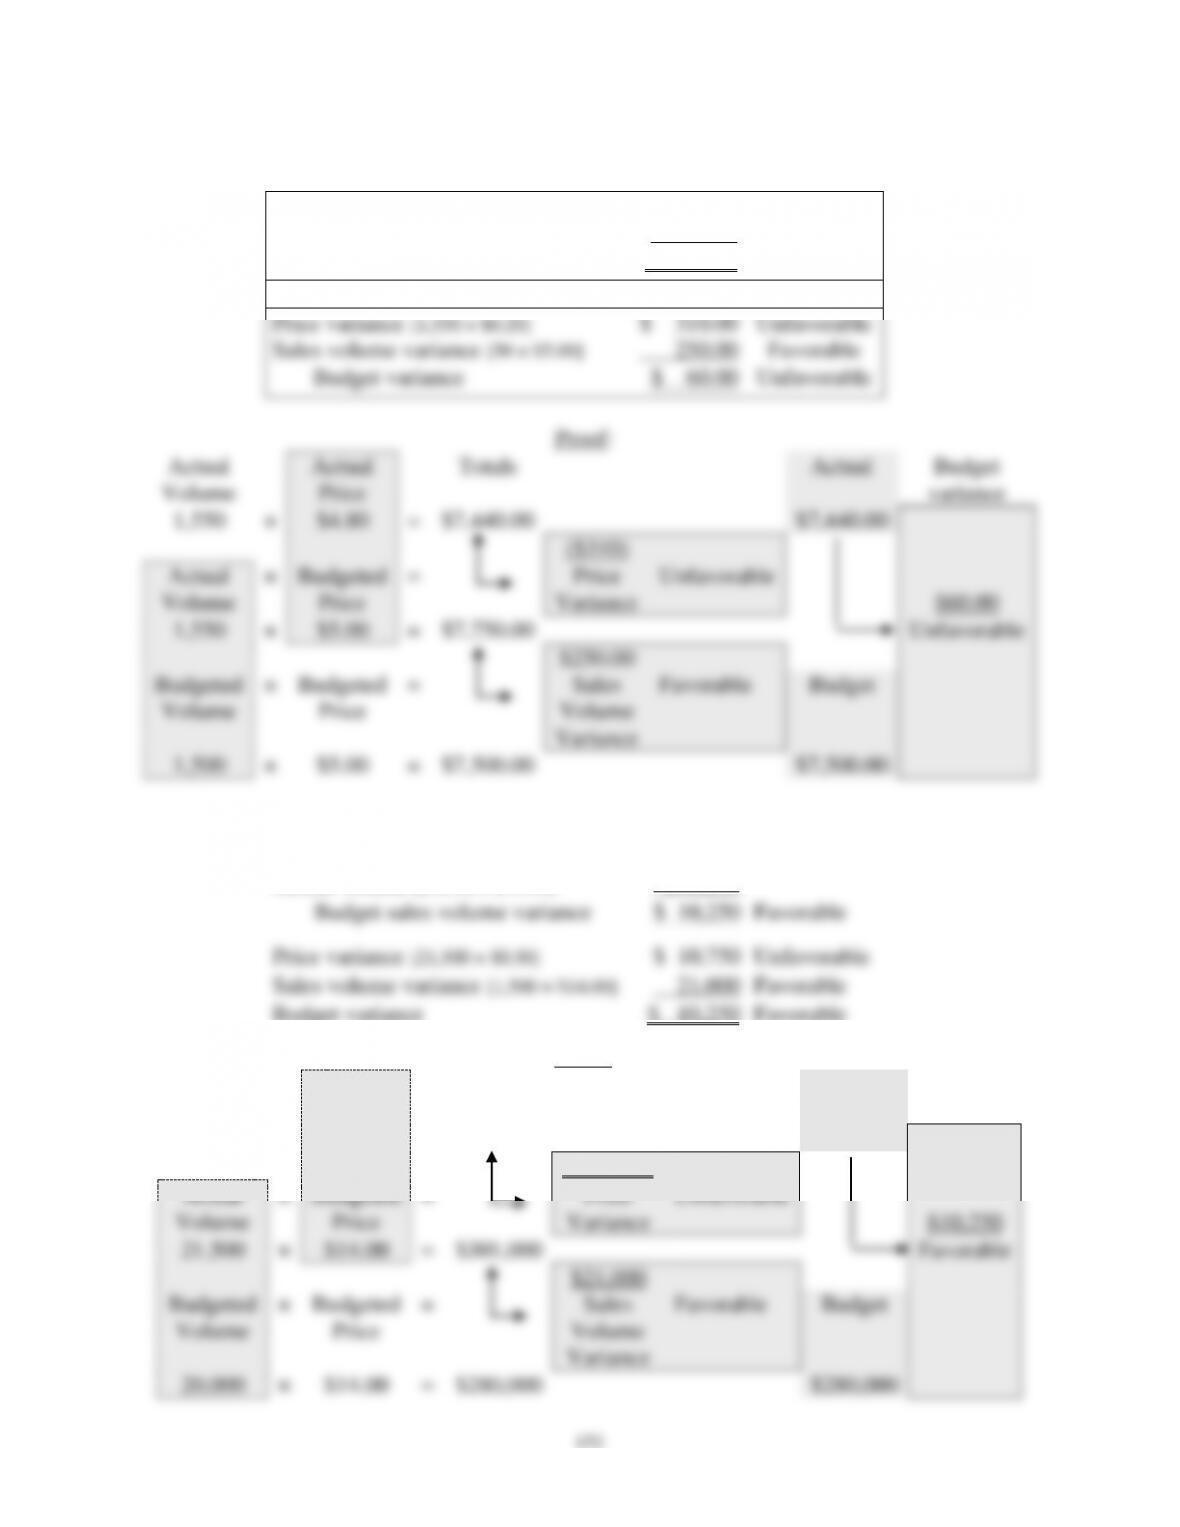
a. Sales revenue volume and price variances:
Budget [1,500 × $5.00]
$7,500.00
Actual [1,550 × $4.80]
7,440.00
Budget sales volume variance
$ 60.00
Unfavorable
Price variance [1,550 × $0.20]
$ 310.00
Unfavorable
Sales volume variance [50 × $5.00]
250.00
Favorable
Budget variance
$ 60.00
Unfavorable
Proof:
Actual
Volume
Actual
Price
Totals
Actual
Budget
variance
1,550
×
$4.80
=
$7,440.00
$7,440.00
($310)
Actual
Volume
×
Budgeted
Price
=
Price
Variance
Unfavorable
$60.00
1,550
×
$5.00
=
$7,750.00
Unfavorable
$250.00
Budgeted
Volume
×
Budgeted
Price
=
Sales
Volume
Variance
Favorable
Budget
1,500
×
$5.00
=
$7,500.00
$7,500.00
b. Sales revenue volume and price variances:
Budgeted volume [20,000 × $14.00]
$280,000
Actual volume [21,500 × $13.50]
290,250
Budget sales volume variance
$ 10,250
Favorable
Price variance [21,500 × $0.50]
$ 10,750
Unfavorable
Sales volume variance [1,500 × $14.00]
21,000
Favorable
Budget variance
$ 10,250
Favorable
Proof:
Actual
Volume
Actual
Price
Totals
Actual
Budget
Variance
21,500
×
$13.50
=
$290,250
$290,250
($10,750)
Actual
Volume
×
Budgeted
Price
=
Price
Variance
Unfavorable
$10,250
21,500
×
$14.00
=
$301,000
Favorable
$21,000
Budgeted
Volume
×
Budgeted
Price
=
Sales
Volume
Variance
Favorable
Budget
20,000
×
$14.00
=
$280,000
$280,000
152
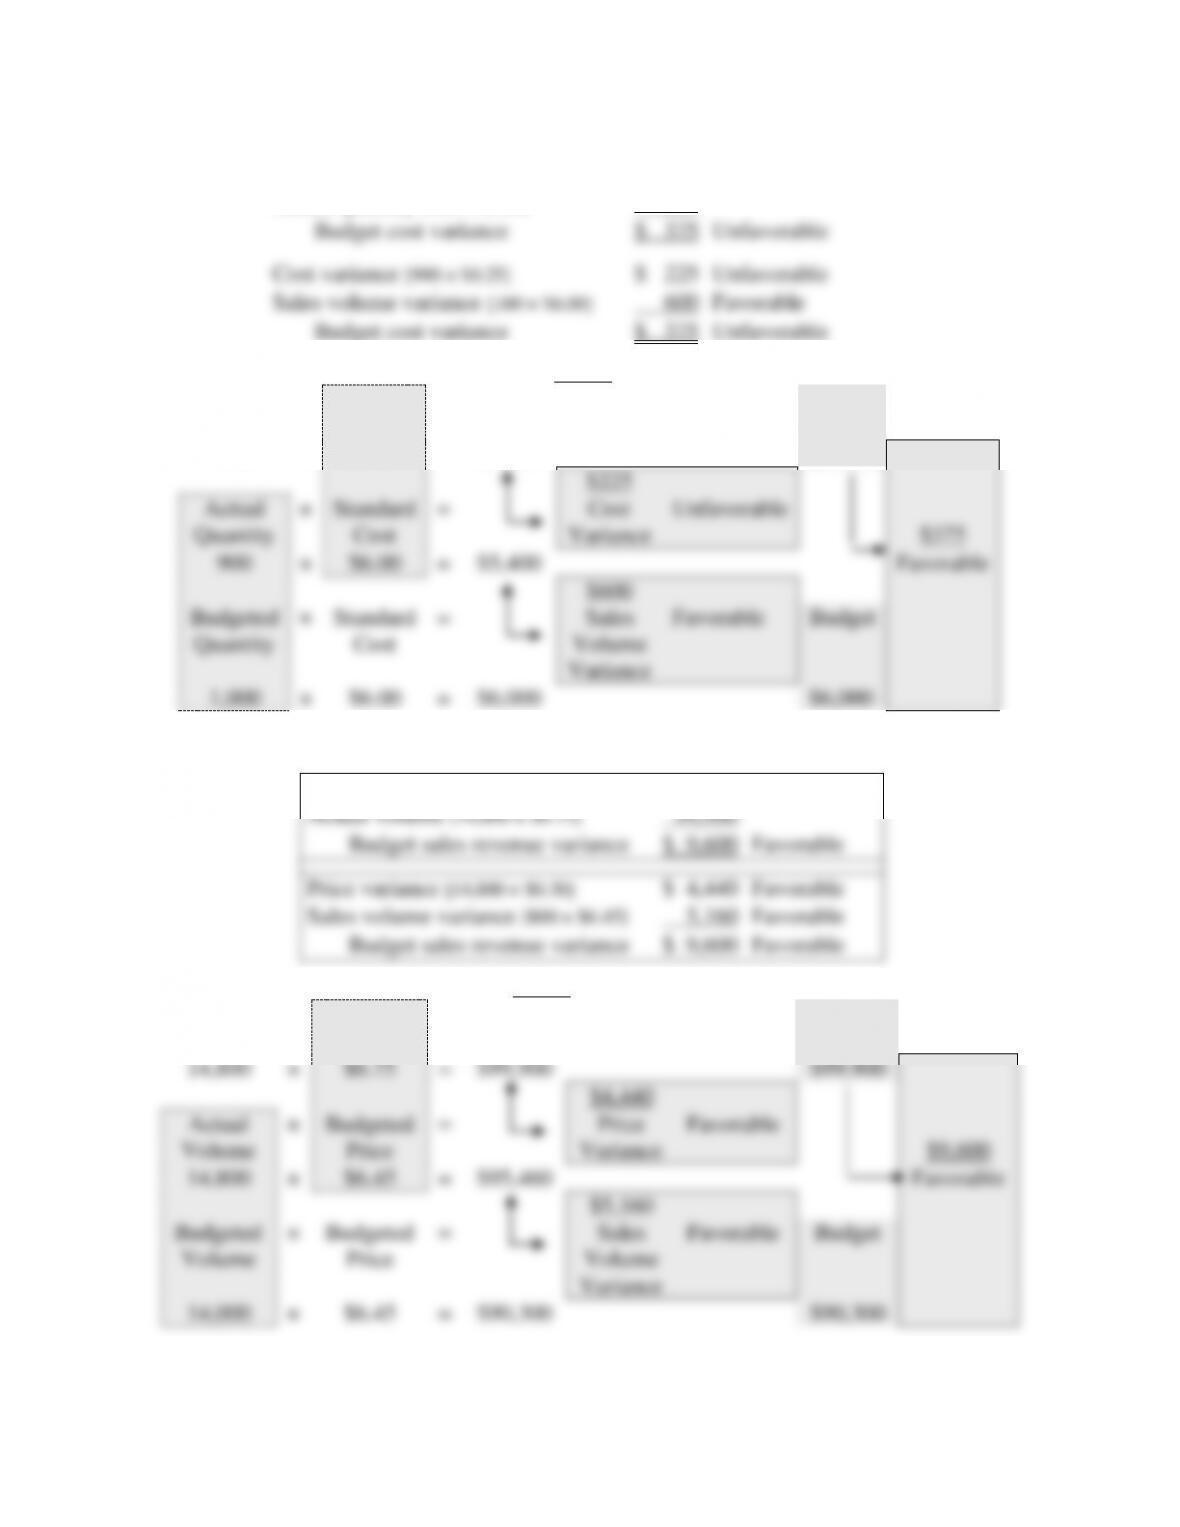
c. Cost and sales volume variances
Budgeted standard cost [1,000 × $6.00]
$6,000
Actual quantity [900 × $6.25]
5,625
Budget cost variance
$ 375
Unfavorable
Cost variance [900 × $0.25]
$ 225
Unfavorable
Sales volume variance [100 × $6.00]
600
Favorable
Budget cost variance
$ 375
Unfavorable
Proof:
Actual
Quantity
Actual
Cost
Totals
Actual
Budget
variance
900
×
$6.25
=
$5,625
$5,625
$225
Actual
Quantity
×
Standard
Cost
=
Cost
Variance
Unfavorable
$375
900
×
$6.00
=
$5,400
Favorable
$600
Budgeted
Quantity
×
Standard
Cost
=
Sales
Volume
Variance
Favorable
Budget
1,000
×
$6.00
=
$6,000
$6,000
d. (1) Sales revenue volume and price variances:
Budgeted price [14,000 × $6.45]
$90,300
Actual volume [14,800 × $6.75]
99,900
Budget sales revenue variance
$ 9,600
Favorable
Price variance [14,800 × $0.30]
$ 4,440
Favorable
Sales volume variance [800 × $6.45]
5,160
Favorable
Budget sales revenue variance
$ 9,600
Favorable
Proof:
Actual
Volume
Actual
Price
Totals
Actual
Budget
Variance
14,800
×
$6.75
=
$99,900
$99,900
$4,440
Actual
Volume
×
Budgeted
Price
=
Price
Variance
Favorable
$9,600
14,800
×
$6.45
=
$95,460
Favorable
$5,160
Budgeted
Volume
×
Budgeted
Price
=
Sales
Volume
Variance
Favorable
Budget
14,000
×
$6.45
=
$90,300
$90,300
153
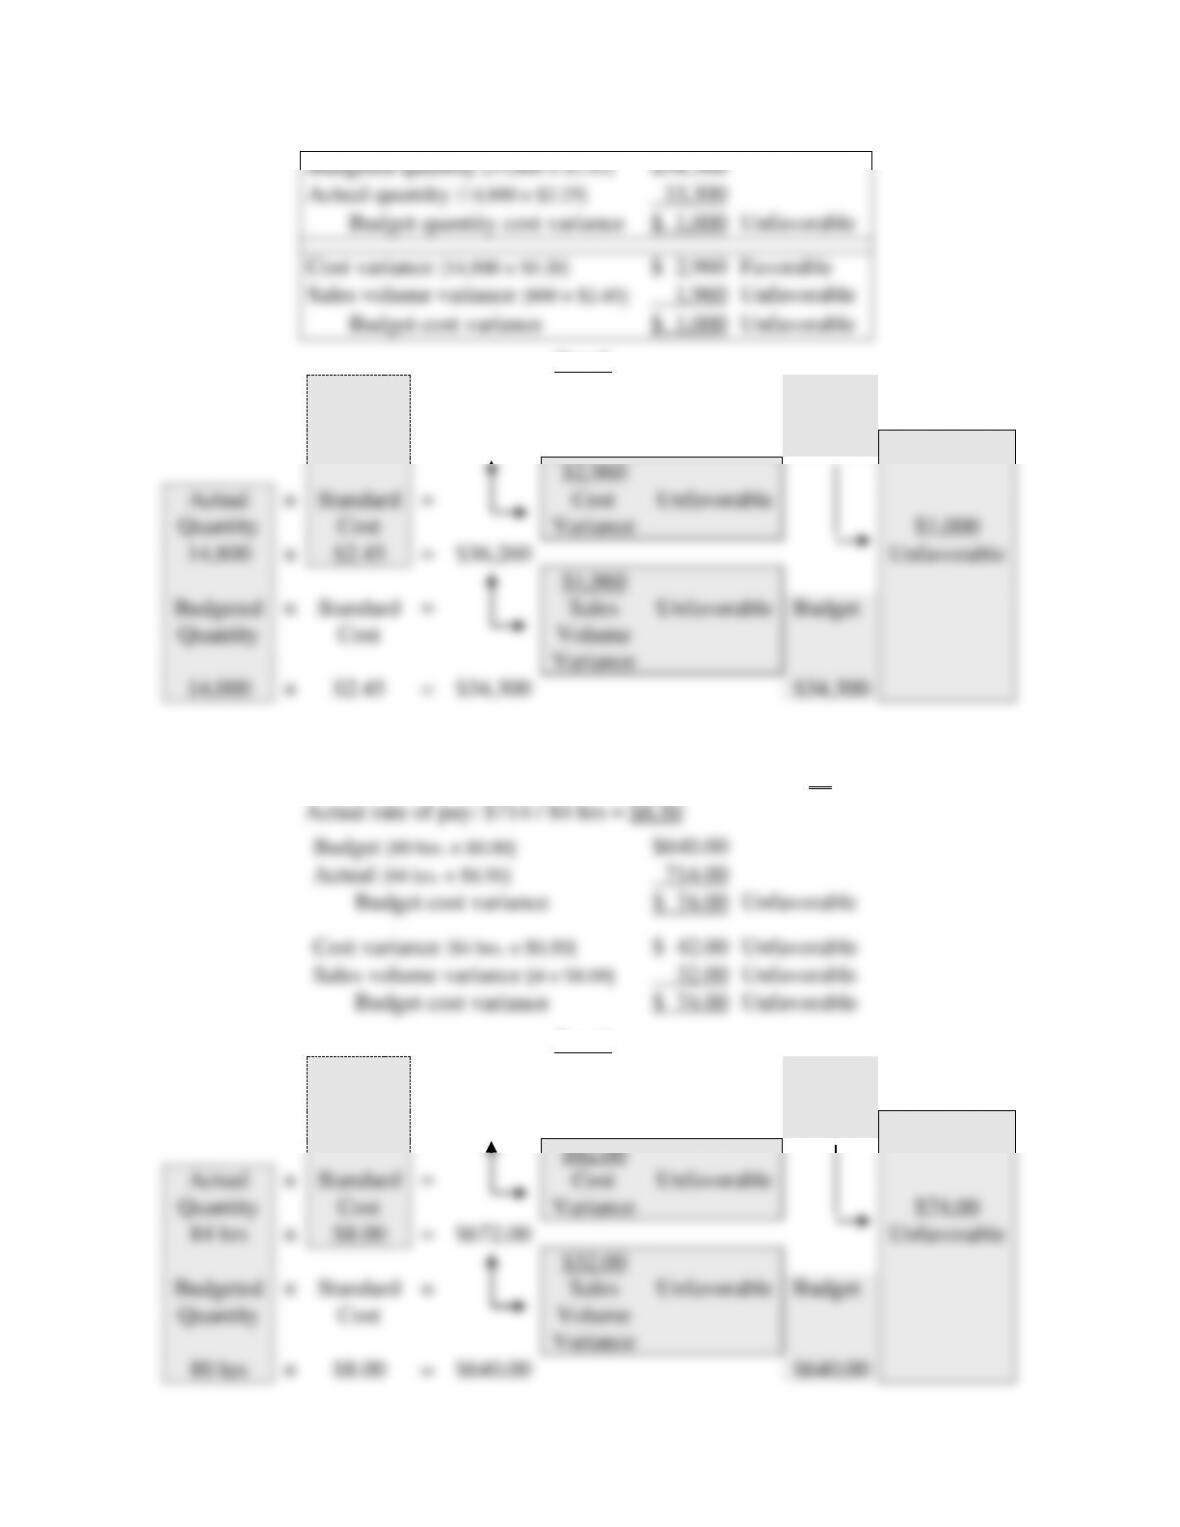
(2) Cost variances:
Budgeted quantity [14,000 × $2.45]
$34,300
Actual quantity [14,800 × $2.25]
33,300
Budget quantity cost variance
$ 1,000
Unfavorable
Cost variance [14,800 × $0.20]
$ 2,960
Favorable
Sales volume variance [800 × $2.45]
1,960
Unfavorable
Budget cost variance
$ 1,000
Unfavorable
Proof:
Actual
Quantity
Actual
Cost
Totals
Actual
Budget
variance
14,800
×
$2.25
=
$33,300
$33,300
$2,960
Actual
Quantity
×
Standard
Cost
=
Cost
Variance
Unfavorable
$1,000
14,800
×
$2.45
=
$36,260
Unfavorable
$1,960
Budgeted
Quantity
×
Standard
Cost
=
Sales
Volume
Variance
Unfavorable
Budget
14,000
×
$2.45
=
$34,300
$34,300
e. Cost variances:
Budgeted hours: 400 guests / 20 guests = 20 × 4 hrs = 80 hours
Proof:
Actual
Quantity
Actual
Cost
Totals
Actual
Budget
variance
84 hrs
×
$8.50
=
$714.00
$714.00
$42.00
Actual
Quantity
×
Standard
Cost
=
Cost
Variance
Unfavorable
$74.00
84 hrs
×
$8.00
=
$672.00
Unfavorable
$32.00
Budgeted
Quantity
×
Standard
Cost
=
Sales
Volume
Variance
Unfavorable
Budget
80 hrs
×
$8.00
=
$640.00
$640.00
Budget [80 hrs. × $8.00]
Cost variance [84 hrs. × $0.50]
Unfavorable
Sales volume variance [4 × $8.00]
Unfavorable
Budget cost variance
Unfavorable
154
P9.10 Budgeted rooms to be sold next year: 80 × 75% × 365 = 21,900
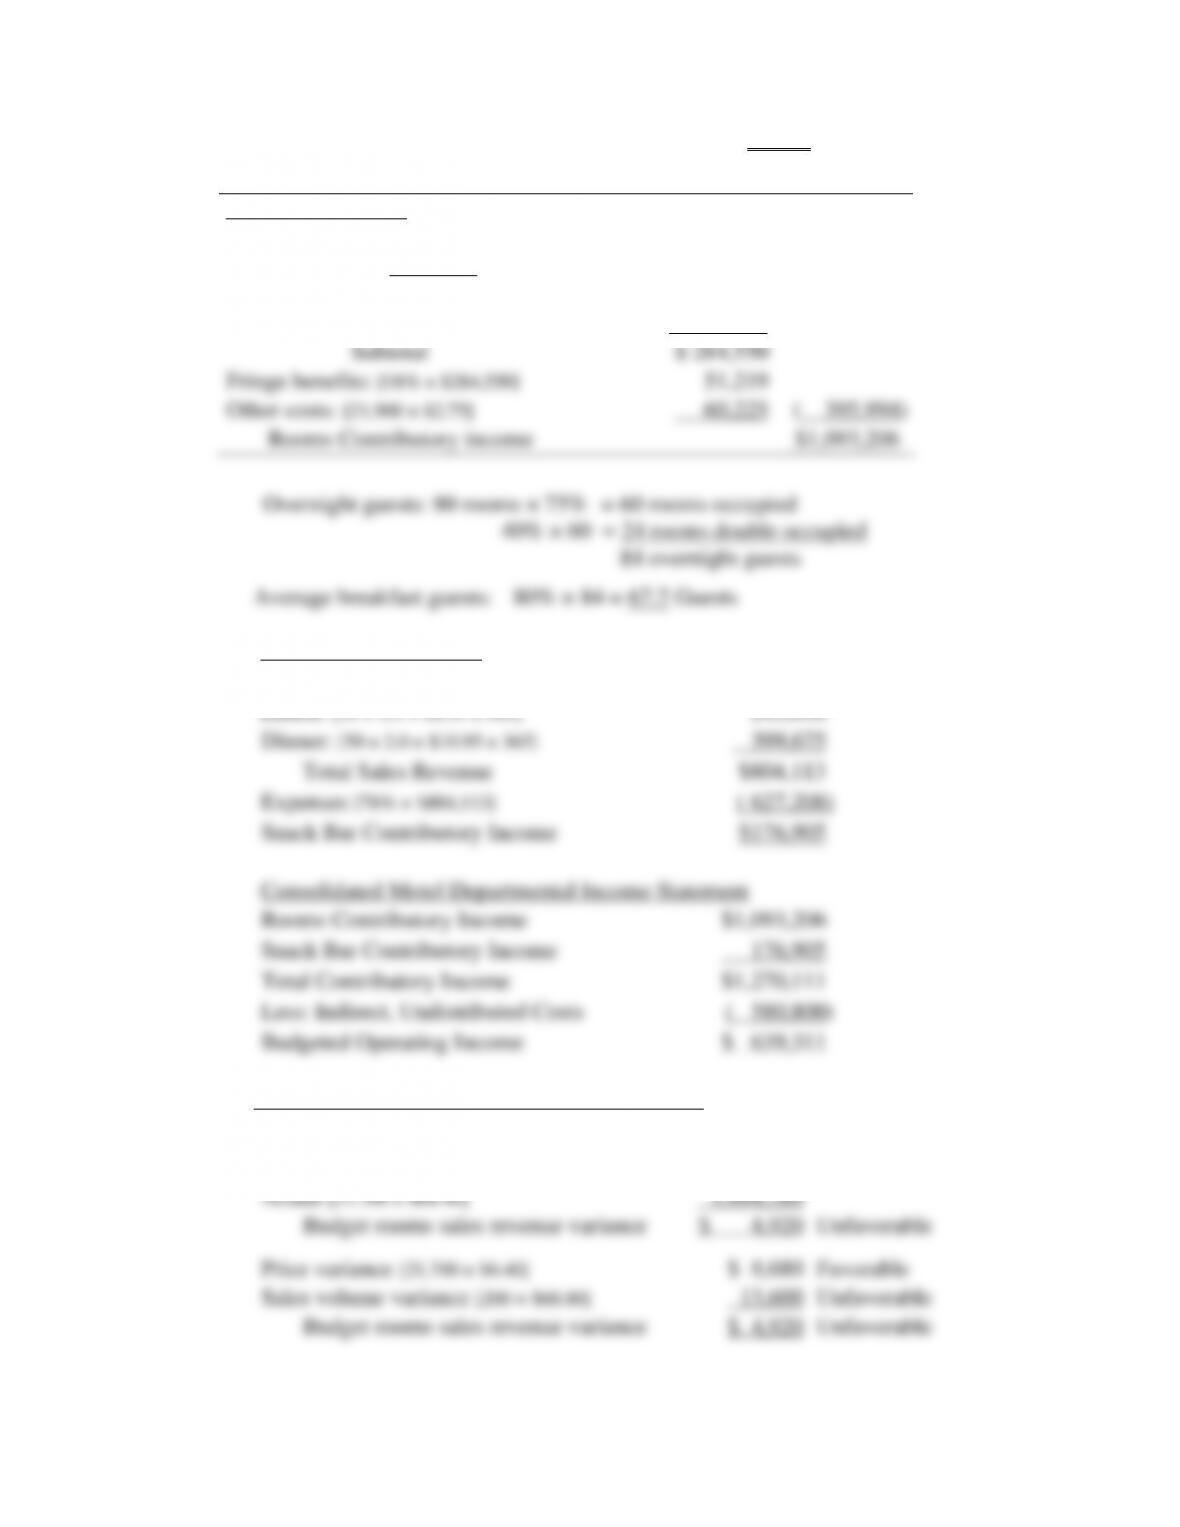
a. Budgeted Departmental Contributory Income Statement
Rooms Department
Sales Revenue: [21,900 × $68.00]
$1,489,200
Expenses
Fixed wages expense
$ 186,000
Housekeeping expenses [21,900 × 0.5 × $9.00]
98,550
Subtotal
$ 284,550
Fringe benefits: [18% × $284,550]
51,219
Other costs: [21,900 × $2.75]
60,225
( 395,994)
Rooms Contributory income
$1,093,206
Overnight guests: 80 rooms × 75% = 60 rooms occupied
40% × 60 = 24 rooms double occupied
84 overnight guests
Average breakfast guests: 80% × 84 = 67.2 Guests
Snack bar sales revenue
Breakfast: [67.2 × $6.50 × 365]
$159,432
Lunch: [50 × 1.5 × $8.95 x 365]
245,006
Dinner: [50 × 2.0 × $10.95 × 365]
399,675
Total Sales Revenue
$804,113
Expenses [78% × $804,113]
( 627,208)
Snack Bar Contributory Income
$176,905
Consolidated Motel Departmental Income Statement
Rooms Contributory Income
$1,093,206
Snack Bar Contributory Income
176,905
Total Contributory Income
$1,270,111
Less: Indirect, Undistributed Costs
( 580,800)
Budgeted Operating Income
$ 639,311
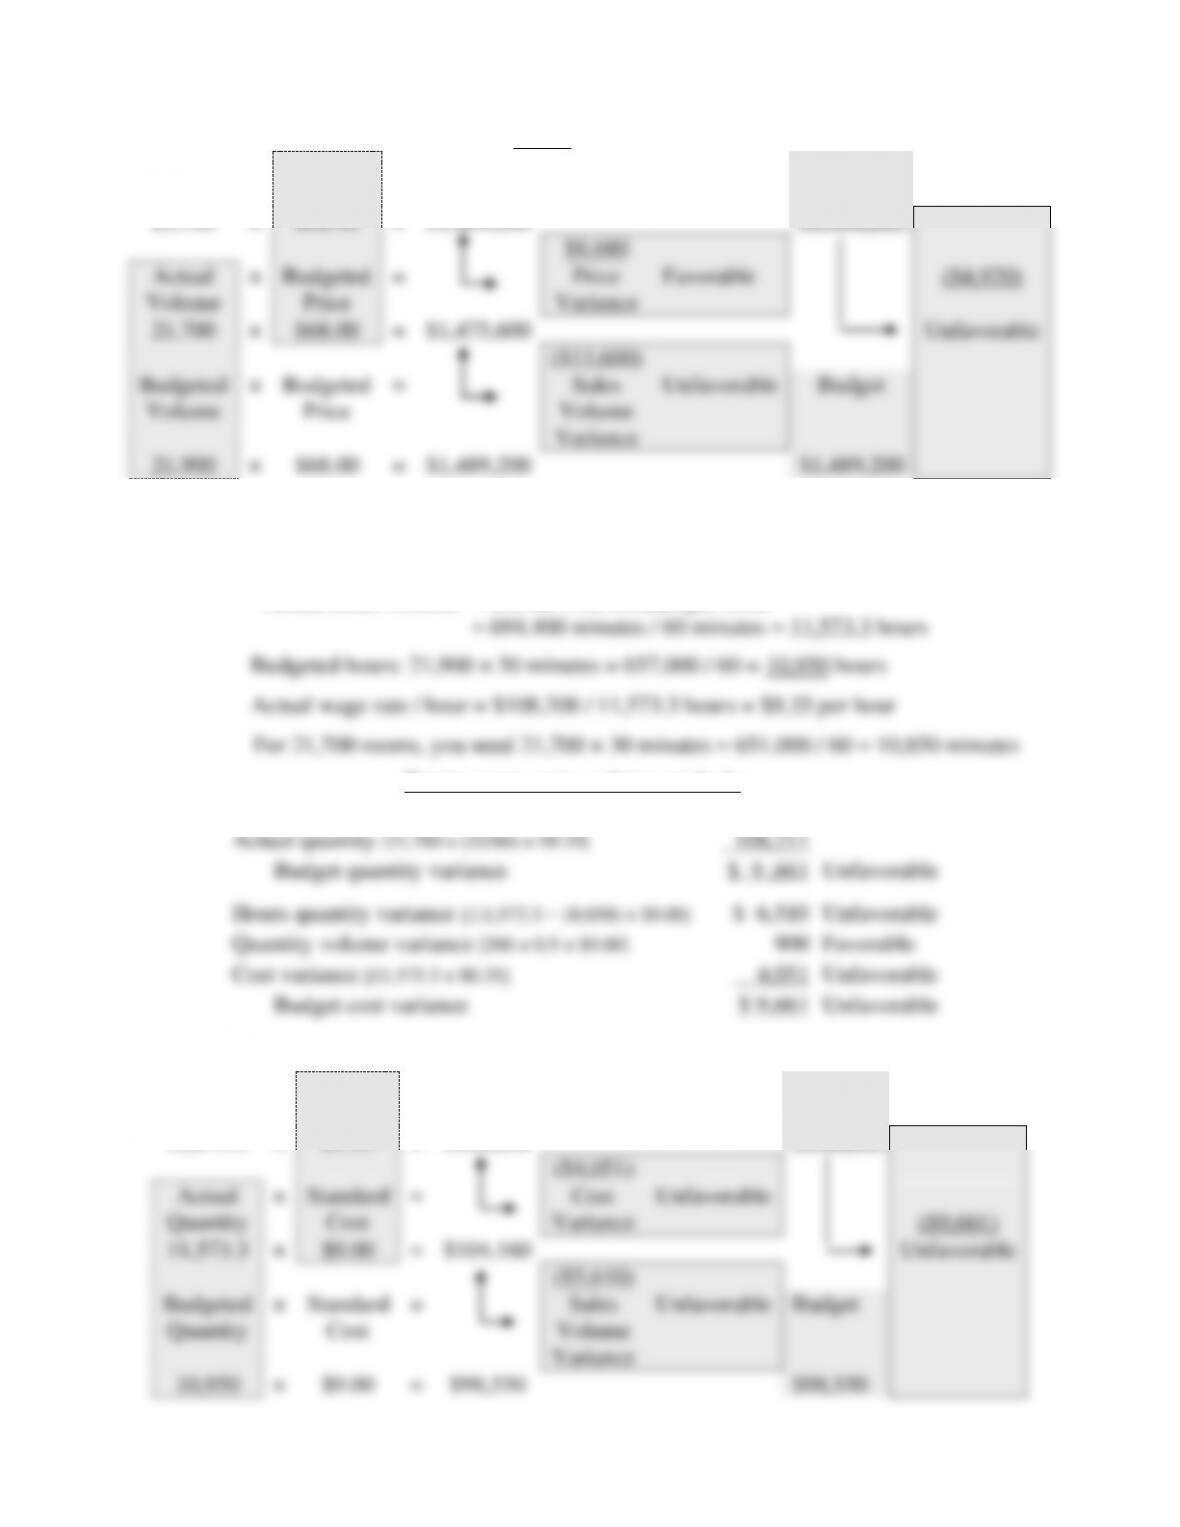
b. Rooms budgeted sales revenue variance analysis
Rooms sales revenue:
Budget [21,900 × $68.00]
$1,489,200
Actual [21,700 × $68.40]
1,484,280
Budget rooms sales revenue variance
$ 4,920
Unfavorable
Price variance [21,700 × $0.40]
$ 8,680
Favorable
Sales volume variance [200 × $68.00]
13,600
Unfavorable
Budget rooms sales revenue variance
$ 4,920
Unfavorable
155
Proof:
Actual
Volume
Actual
Price
Totals
Actual
Budget
Variance
21,700
×
$68.40
=
$1,484,280
$1,484,280
$8,680
Actual
Volume
×
Budgeted
Price
=
Price
Variance
Favorable
($4,920)
21,700
×
$68.00
=
$1,475,600
Unfavorable
($13,600)
Budgeted
Volume
×
Budgeted
Price
=
Sales
Volume
Variance
Unfavorable
Budget
21,900
×
$68.00
=
$1,489,200
$1,489,200
The wage variance needs to be determined using hours and cost per hour, not cost per
room. By doing it this way, you can see the effect of the change in the labor rate per hour
plus the change in the time used to clean and clear each room.
Actual hours worked = 21,700 × 32 minutes per room
Rooms wage costs variance analysis:
Budget quantity [21,900 × 0.5 × $9.00]
$ 98,550
Actual quantity [21,700 × (32/60) × $9.35]
108,211
Budget quantity variance
$ 9 ,661
Unfavorable
Hours quantity variance [(11,573.3 – 10,850) × $9.00]
$ 6,510
Unfavorable
Quantity volume variance [200 × 0.5 × $9.00]
900
Favorable
Cost variance [11,573.3 × $0.35]
4,051
Unfavorable
Budget cost variance
$ 9,661
Unfavorable
Proof:
Actual
Quantity
Actual
Cost
Totals
Actual
Budget
variance
11,573.3
×
$9.35
=
$108,208
$108,208
($4,051)
Actual
Quantity
×
Standard
Cost
=
Cost
Variance
Unfavorable
($9,661)
11,573.3
×
$9.00
=
$104,160
Unfavorable
($5,610)
Budgeted
Quantity
×
Standard
Cost
=
Sales
Volume
Variance
Unfavorable
Budget
10,950
×
$9.00
=
$98,550
$98,550
156
P9.11 Calculate individual department contributory income statements, then combine each
department into a combined departmental operating budget. Determine total combined
operating income before depreciation, interest and taxes.
Combined Departmental Operating Budget (First Year)
Rooms Department
Rooms sales revenue: [100 × 64% × $72 × 365]
$1,681,920
Operating Expenses
Wages expense, fixed [given]
$326,900
Wages expense, variable: [100 × 64% = 64]
[64 / 16 = 4] [4 × 8 × $8.50 × 365]
99,280
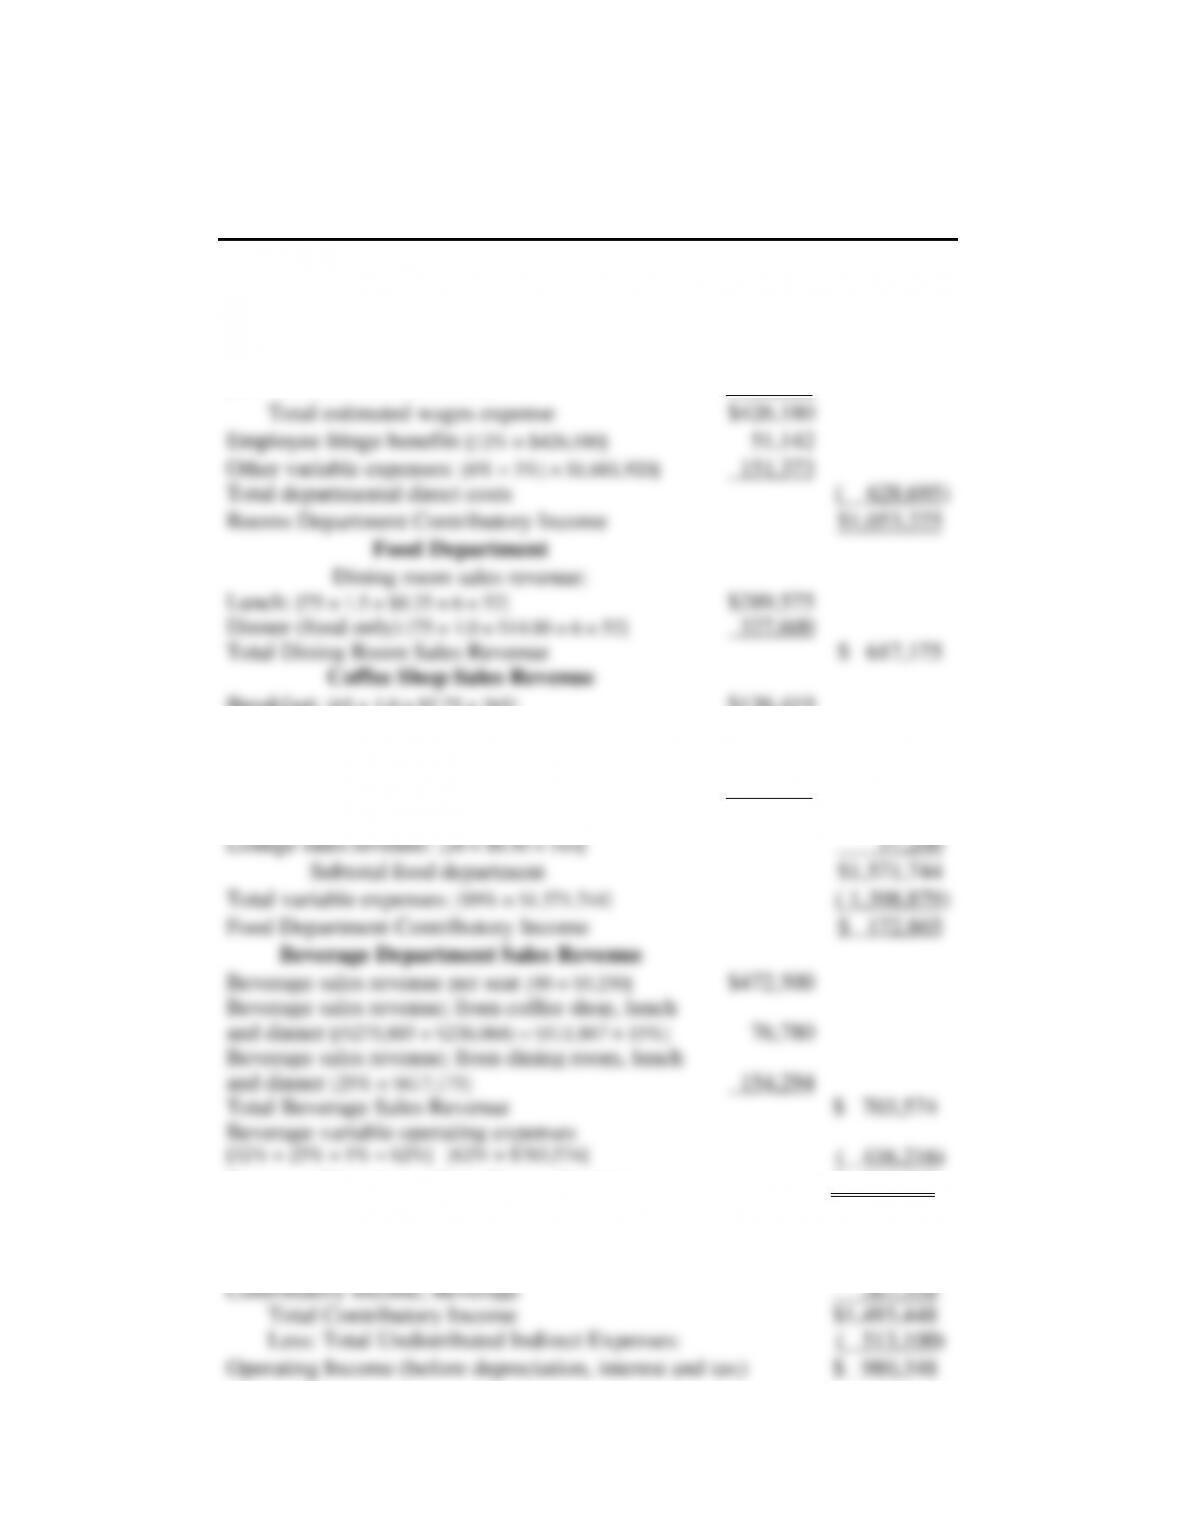
Total estimated wages expense
$426,180
Employee fringe benefits [12% × $426,180]
51,142
Other variable expenses: [6% + 3%] × $1,681,920]
151,373
Total departmental direct costs
( 628,695)
Rooms Department Contributory Income
$1,053,225
Food Department
Dining room sales revenue:
Lunch: [75 × 1.5 × $8.25 × 6 × 52]
$289,575
Dinner (food only) [75 × 1.0 × $14.00 × 6 × 52]
327,600
Total Dining Room Sales Revenue
$ 617,175
Coffee Shop Sales Revenue
Breakfast: [65 × 1.0 × $5.75 × 365]
$136,419
Lunch: [65 × 1.5 × $7.75 × 365]
275,803
Dinner: [65 × 1.0 × $9.95 × 365]
236,064
Coffee breaks: [65 × 6.0 × $1.75 × 365]
249,113
Total Coffee Shop Sales Revenue
897,399
Lounge sales revenue: [20 × $8.50 × 310]
57,200
Subtotal food department
$1,571,744
Total variable expenses: [89% × $1,571,744]
( 1,398,879)
Food Department Contributory Income
$ 172,865
Beverage Department Sales Revenue
Beverage sales revenue per seat [90 × $5,250]
$472,500
Beverage sales revenue; from coffee shop, lunch
and dinner [($275,803 + $236,064) = $511,867 × 15%]
76,780
Beverage sales revenue; from dining room, lunch
and dinner [25% × $617,175]
154,294
Total Beverage Sales Revenue
$ 703,574
Beverage variable operating expenses
[32% + 25% + 5% = 62%] [62% × $703,574]
( 436,216)
Beverage Department Contributory Income
$ 267,358
Combined Departmental Operating Budget
Contributory Income, Rooms
$1,053,225
Contributory Income, Food
172,865
Contributory Income, Beverage
267,358
Total Contributory Income
$1,493,448
Less: Total Undistributed Indirect Expenses:
( 513,100)
Operating Income (before depreciation, interest and tax)
$ 980,348
157
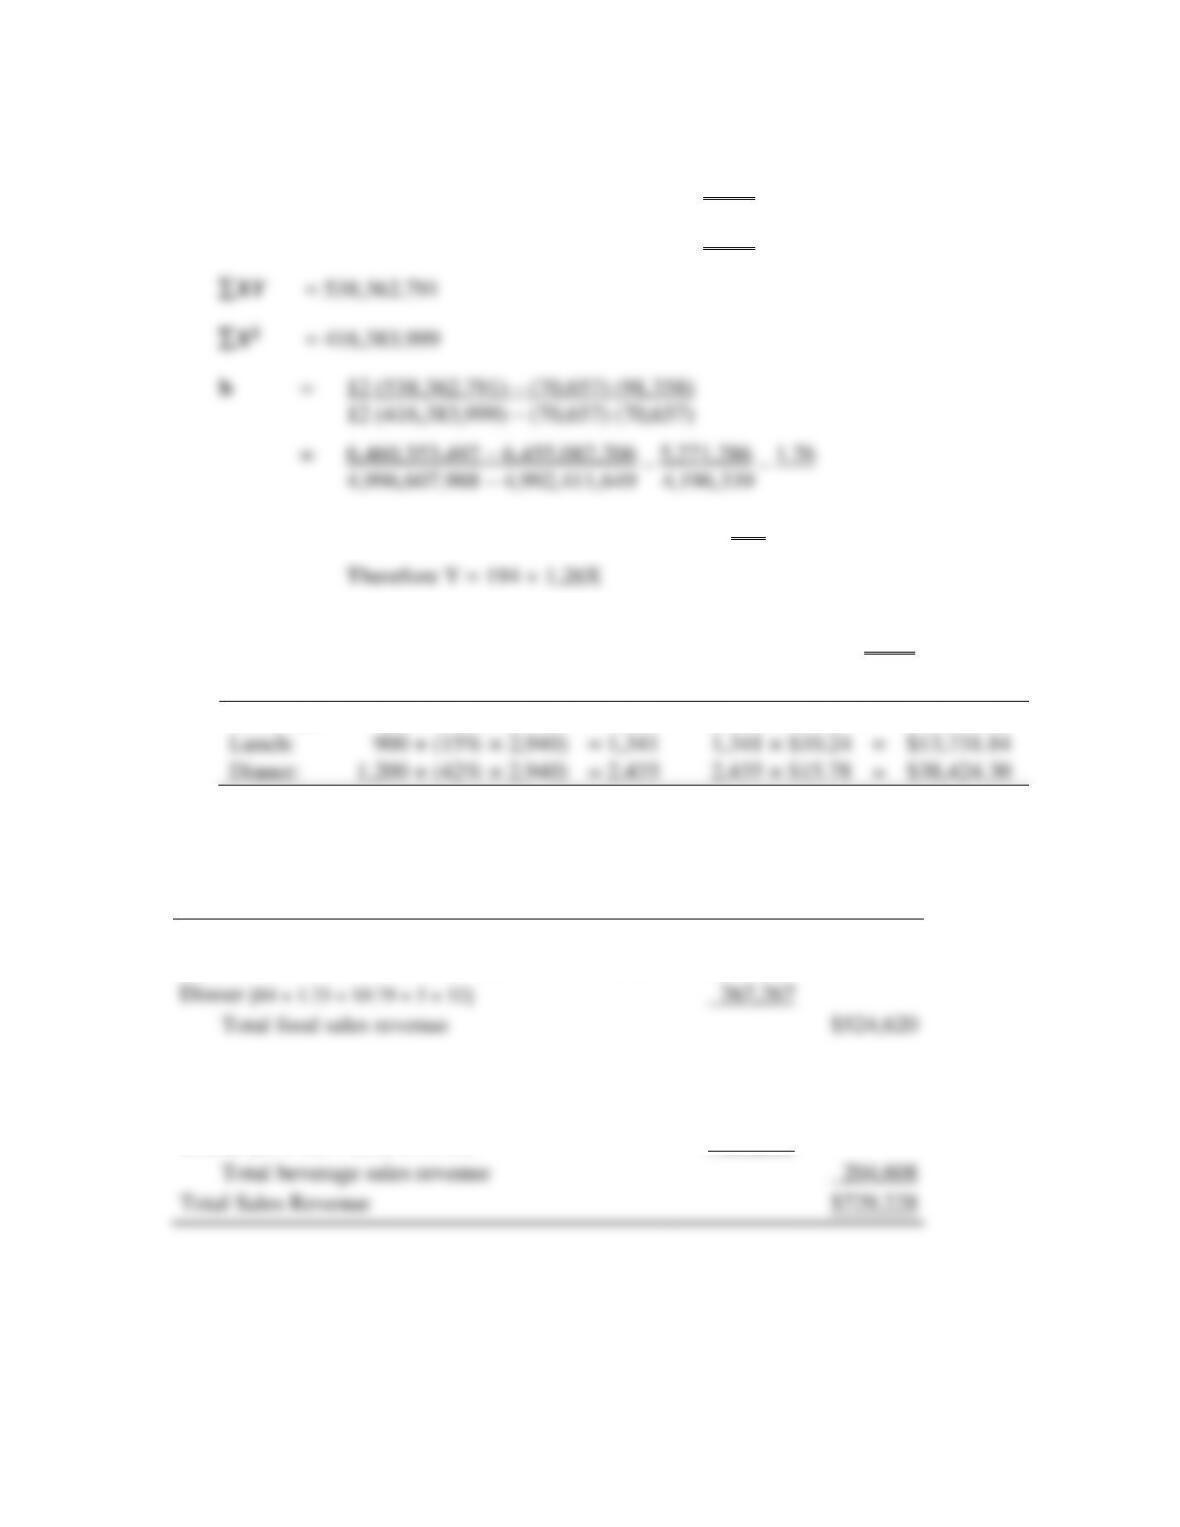
P9.12 Use regression analysis. The equation: Y = a + bX
X = 70,657 (average of X nights, 5,888.08 5,888)
Y = 91,358 (average Y guests = 7,613.167 7,613)
a = 7,613 – (1.26 × 5,888) = 7,613 – 7,419 = 194
P9.13 Regression analysis: Total guests in Nov. 100 × 70% × 140% × 30 = 2,940
Breakfast:
750 + (82% × 2,940)
= 3,161
3,161 × $5.25
=
$19,595.25
Lunch:
900 + (15% × 2,940)
= 1,341
1,341 × $10.24
=
$13,731.84
Dinner:
1,200 + (42% × 2,940)
= 2,435
2,435 × $15.78
=
$38,424.30
CASE 9 SOLUTION
a. 4C Company forecasted sales revenue for Year 2008
Food Sales Revenue
Lunch [84 × 1.5 × $5.85 × 6 × 52] + [15 × $5.85 × 6 × 52]
$257,353
Dinner [84 × 1.25 × $9.79 × 5 × 52]
267,267
Total food sales revenue
$524,620
Beverage Sales Revenue
Lunch [84 × 1.5 × $1.12 × 6 × 52] + [15 × $1.12 × 6 × 52]
$ 49,271
Dinner [84 × 1.25 × $5.69 × 5 × 52]
155,337
Total beverage sales revenue
204,608
Total Sales Revenue
$729,228
158
b. 4C Company, Budgeted Income Statement, For the Year 2008
Sales Revenue
Sales revenue: Food
$524,620
Sales revenue: Beverage
204,608
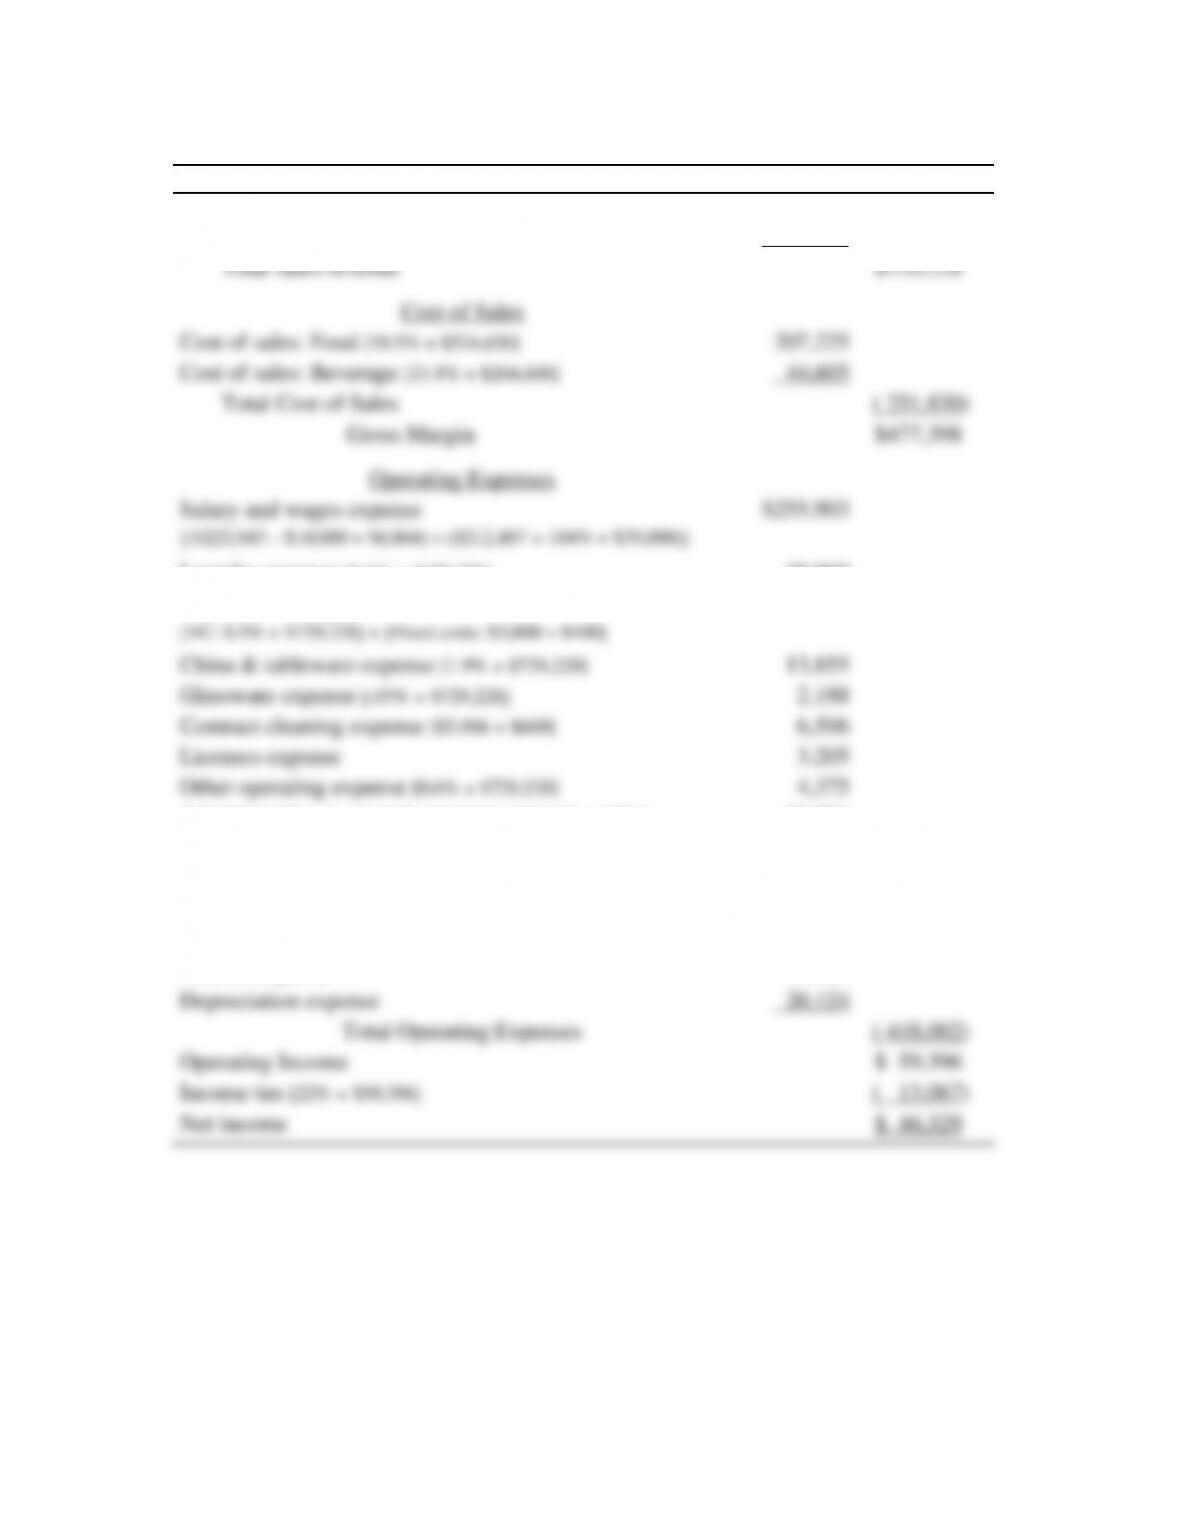
Total sales revenue
$729,228
Cost of Sales
Cost of sales: Food [39.5% × $524,620]
207,225
Cost of sales: Beverage [21.8% × $204,608]
44,605
Total Cost of Sales
( 251,830)
Gross Margin
$477,398
Operating Expenses
Salary and wages expense
$255,903
[($223,543 – $18,000 + $6,864) = ($212,407 × 104% + $35,000)]
Laundry expense [2.6% × $729,228]
18,960
Kitchen fuel expense
7,846
[VC: 0.5% × $729,228] + [Fixed costs: $3,800 + $400]
China & tableware expense [1.9% × $729,228]
13,855
Glassware expense [.03% × $729,228]
2,188
Contract cleaning expense [$5,906 + $600]
6,506
Licenses expense
3,205
Other operating expense [0.6% × $729,228]
4,375
Administrative & general expenses [$15,432 × 105%]
16,204
Marketing expenses [$6,917 + $3,000]
9,917
Utilities expense [ 0.8% × $729,228] + Fixed costs: $3,100 + $2,000]
10,934
Insurance expense [$1,895 × 110%]
2,085
Rent expense [$24,000 × 110%]
26,400
Interest expense
19,500
Depreciation expense
20,124
Total Operating Expenses
( 418,002)
Operating Income
$ 59,396
Income tax [22% × $59,396]
( 13,067)
Net income
$ 46,329
159
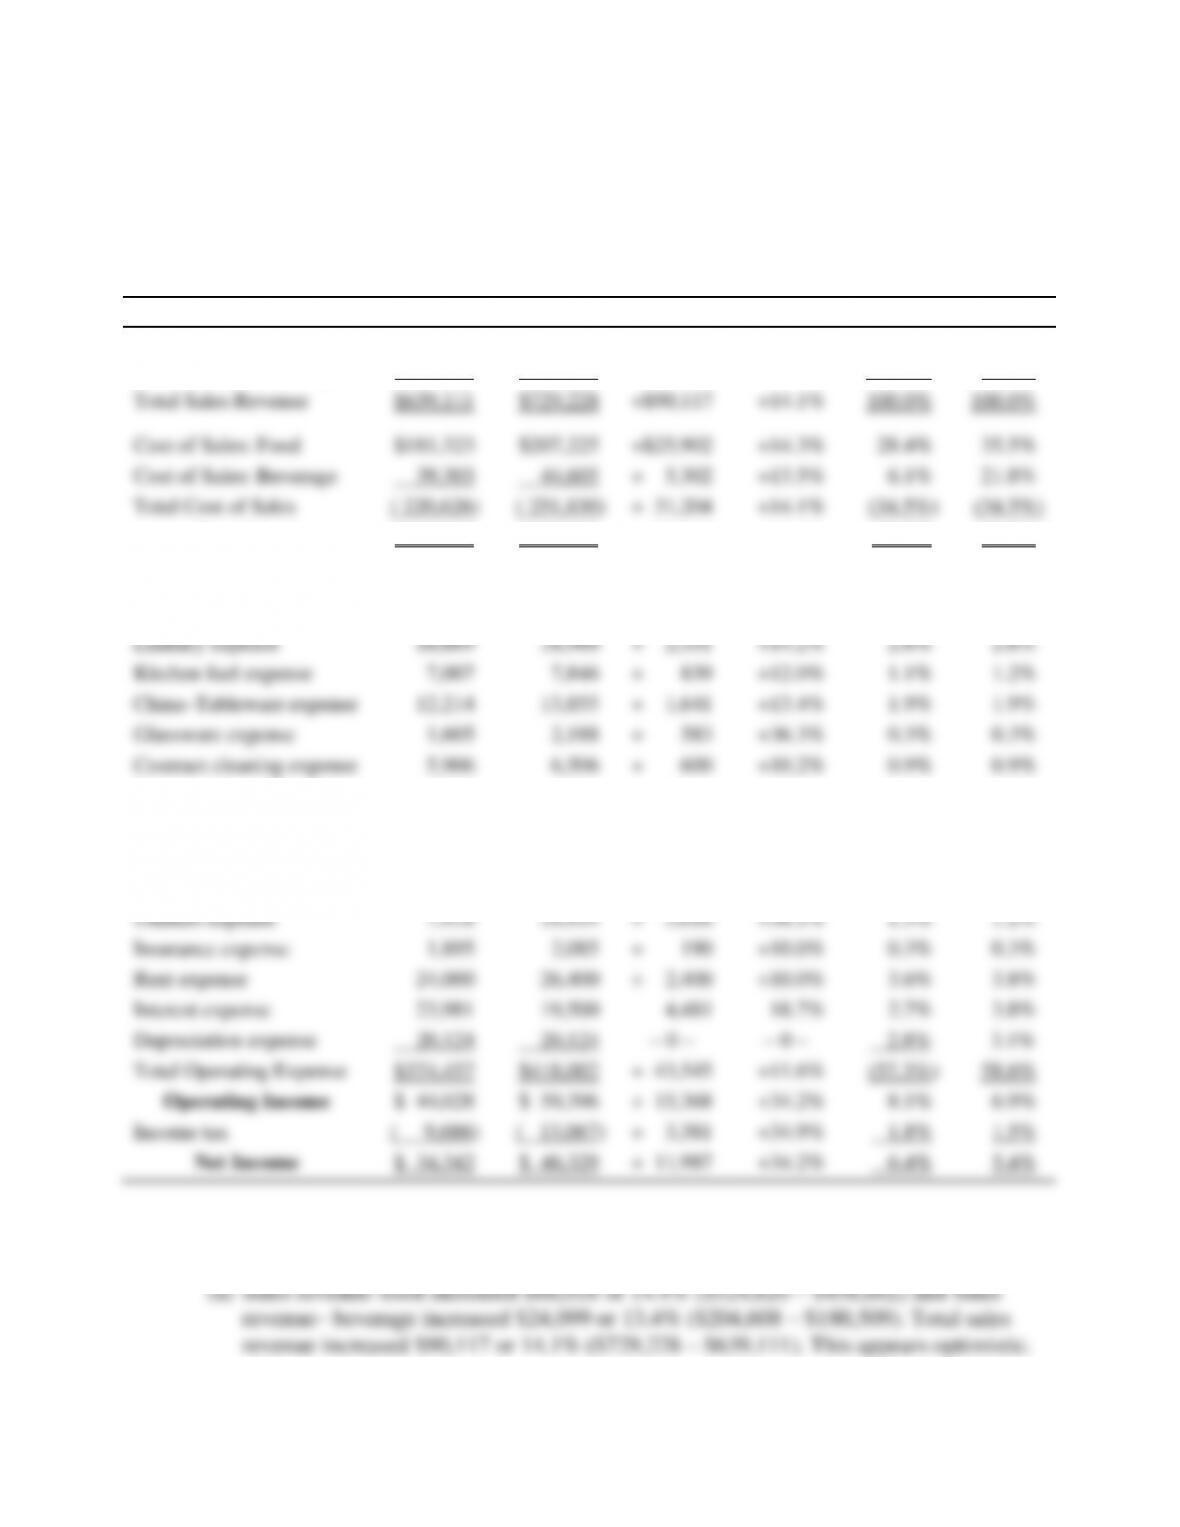
c. A comparative horizontal analysis and common-size vertical analysis of the 4C Company
Budgeted Income Statement for Year 2008 will be compared to Year 2007 income statement
(Case 2) and the common-size income statement (Case 3).
Comparative
Common-size
Horizontal Analysis
Vertical Analysis
Sales Revenue
Yr. 2007
Yr. 2008
$ Change
▲Change
Yr. 2008
Yr.2007
Sales revenue: Food
$458,602
$524,620
+$66,018
+14.4%
71.9%
71.8%
Sales revenue: Beverage
180,509
204,608
+ 24,099
+13.4%
28.1%
28.2%
Total Sales Revenue
$639,111
$729,228
+$90,117
+14.1%
100.0%
100.0%
Cost of Sales: Food
$181,323
$207,225
+$25,902
+14.3%
28.4%
35.5%
Cost of Sales: Beverage
39,303
44,605
+ 5,302
+13.5%
6.1%
21.8%
Total Cost of Sales
( 220,626)
( 251,830)
+ 31,204
+14.1%
(34.5%)
(34.5%)
Gross Margin
$418,485
$477,398
+ 58,913
+14.1%
65.5%
65.5%
Operating Expenses
Salaries & wages expense
$223,543
$255,903
+$32,360
+14.5%
35.1%
35.0%
Laundry expense
16,609
18,960
+ 2,351
+14.2%
2.6%
2.6%
Kitchen fuel expense
7,007
7,846
+ 839
+12.0%
1.1%
1.2%
China–Tableware expense
12,214
13,855
+ 1,641
+13.4%
1.9%
1.9%
Glassware expense
1,605
2,188
+ 583
+36.3%
0.3%
0.3%
Contract cleaning expense
5,906
6,506
+ 600
+10.2%
0.9%
0.9%
Licenses expense
3,205
3,205
– 0 –
– 0 –
0.4%
0.5%
Other operating expenses
4,101
4,375
+ 274
+ 6.7%
0.6%
0.6%
Admin–general expenses
15,432
16,204
+ 772
+ 0.5%
2.2%
2.4%
Marketing expense
6,917
9,917
+ 3,000
+43.4%
1.4%
1.1%
Utilities expense
7,918
10,934
+ 3,016
+38.1%
1.5%
1.2%
Insurance expense
1,895
2,085
+ 190
+10.0%
0.3%
0.3%
Rent expense
24,000
26,400
+ 2,400
+10.0%
3.6%
3.8%
Interest expense
23,981
19,500
– 4,481
–18.7%
2.7%
3.8%
Depreciation expense
20,124
20,124
– 0 –
– 0 –
2.8%
3.1%
Total Operating Expense
$374,457
$418,002
+ 43,545
+11.6%
(57.3%)
58.6%
Operating Income
$ 44,028
$ 59,396
+ 15,368
+34.2%
8.1%
6.9%
Income tax
( 9,686)
( 13,067)
+ 3,381
+34.9%
1.8%
1.5%
Net Income
$ 34,342
$ 46,329
+ 11,987
+34.2%
6.4%
5.4%
(1) A comparative horizontal analysis of the 4C Company budgeted income statement for
Year 2008 shows the following:
160
(b) Total operating expenses increased $43,545 or 11.6% ($418,002 – $374,457). Total
(2) A common-size vertical analysis of 4C Company’s budgeted income statement for Year
2008 shows the following:
(a) Sales revenue–food increased 0.1% (71.9% – 71.8%) relative to total sales revenue
and sales revenue–beverage decreased 0.1% (28.1% – 28.2%). This change is
insignificant.