Unlock document.
This document is partially blurred.
Unlock all pages and 1 million more documents.
Get Access
91
CHAPTER 6
THE BOTTOM-UP APPROACH TO PRICING
INTRODUCTION
The prime purpose of this chapter is to encourage the students to think about net income as a cost
to be considered in setting selling prices, rather than being merely what is left for the owners
after all other costs are deducted from sales revenue. Prices, in other words, should be
established to help ensure that a specific desired amount of net income results. The concepts
established in this chapter will also be particularly useful in budgeting which is covered in
Chapter 9.
TRUE OR FALSE QUESTIONS
(Correct answer indicated by T for True and F for False)
1. Trial-and-error pricing is also known as intuitive pricing.
F
2. Mark-up pricing occurs when the cost of food sold is marked up by a fixed percentage
to obtain the selling price.
T
3. Long-run pricing is also known as tactical pricing.
F
4. Net income cannot be considered a cost of running a business.
F
5. If a company is in a 50% tax bracket, its net income after tax will be the same as the
amount of tax.
T
6. A restaurant’s anticipated overall average check can be calculated by dividing the
forecast annual sales revenue by (seats × daily seat turnover × days open in the year).
T
7. If seat turnover increases and average check increases, total sales revenue will
decrease.
F
8. The average check calculation gives us the price of all items on the menu.
F
9. The average check is usually the same for each meal period.
F
10. It is necessary to know the proportion of total sales revenue normally derived from
each meal period to forecast the average check by meal period.
T
11. If a restaurant operator wanted a 30% food cost for a menu item, he or she would
multiply the item cost by three to obtain the selling price.
F
12. The cost multiplication factor that yields a 20% food cost is five.
T
13. The dollar gross margin on a particular menu item is more important than that item’s
food cost percent.
T
14. The quantity of each item that guests choose of each of the various menu items
offered is known as the sales revenue mix.
T
15. If we take an item with a high gross profit off a menu and replace it with an item with
a lower gross margin, all other things being equal, our net income will be higher.
F
92
16. A method of menu analysis that concerns itself with each menu item’s popularity,
combined with its contribution margin (gross margin), is known as menu engineering.
T
17. Integrated pricing occurs when both food cost and beverage cost are marked up by the
same percentage.
F
18. An analysis of restaurant seat turnovers by day of the week can be useful in preparing
staffing schedules.
T
19. Loss of sales revenue from a hotel room not sold overnight is no more serious than
loss of sales revenue from a restaurant seat not used during a meal period.
F
20. Hotel room inventory cannot be increased quickly in the short run.
T
21. The $1 per $1,000 method of establishing room rates means that if the forecast annual
sales revenue from the average room per year is $40,000, average room rate should be
$40.
F
22. The $1 per $1,000 method of establishing room rates should be used with caution.
T
23. An average room rate is the rate charged at all times for each room in the hotel.
F
24. Size of room, decor, and view may be some of the factors to consider in establishing
individual room rates.
T
25. Total number of guests during a period, fewer rooms occupied during that period,
equals the number of rooms double occupied.
T
26. Room rates, because of higher construction and financing costs, are generally higher
in newer hotels compared to older ones.
T
27. Room rates cannot be calculated based on the square foot area of the various size
rooms.
F
28. Analysis of the room’s occupancy by day of the week can be useful in staff
scheduling and advertising.
T
29. A hotel room’s rack rate is the normal rate for that room discounted by a fixed
percentage.
F
30. The potential average room rate is defined as the average rate that would result if all
rooms occupied overnight were sold at the rack rate without any discount.
T
31. When there is a large change in demand with a small change in price, this is known as
inelastic demand.
F
32. When there is a small change in demand following a large change in price, this is
known as inelastic demand.
T
93
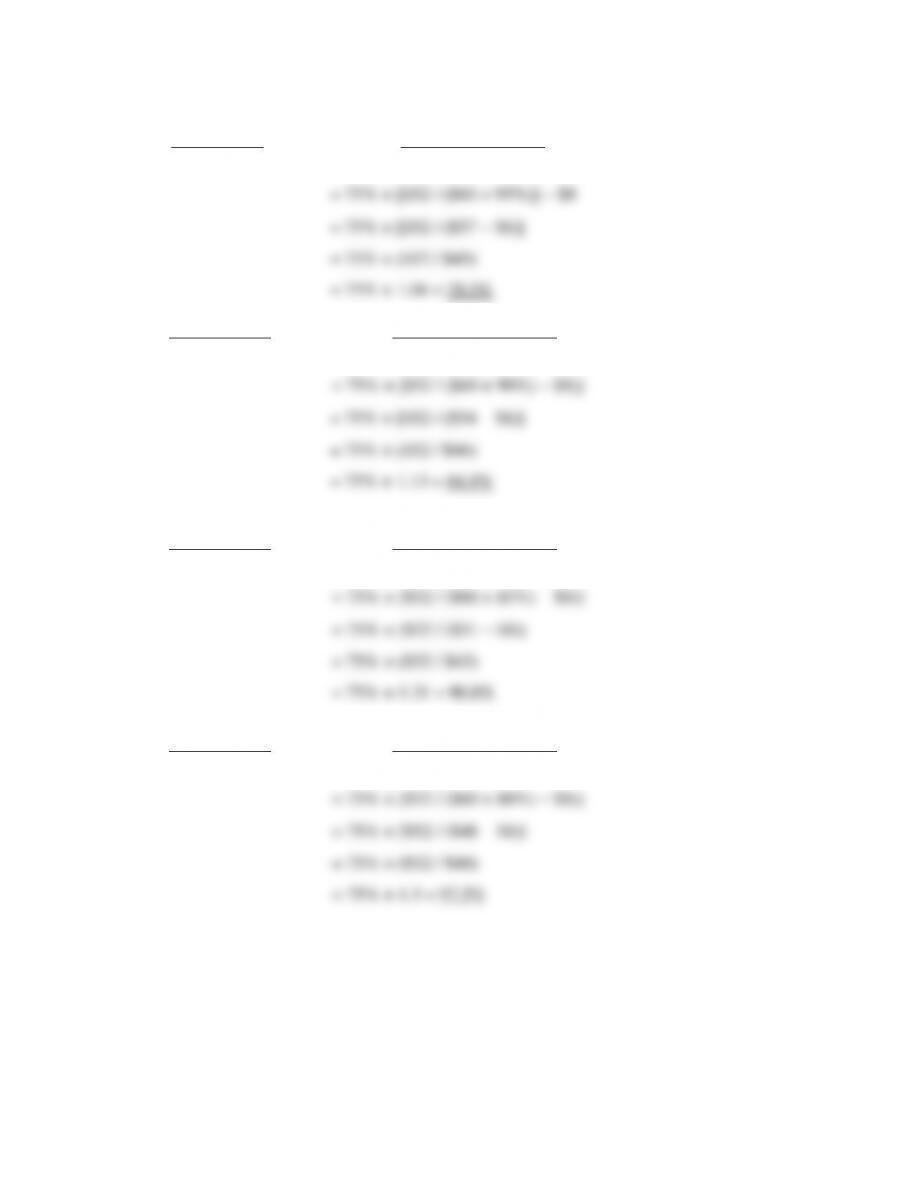
MULTIPLE CHOICE QUESTIONS
(Correct answer indicated by asterisk)
(c) Knowing what discount to offer to accept group business while still making a profit
(d) Adjusting prices to reach a new market segment
2. If, in a restaurant, food cost, labor cost, and other operating costs total 60%, and indirect
costs including net income are $42,000, then sales revenue required to provide the desired net
income will be:
(a) $ 70,000
(b) $252,000
3. Sales sales revenue in a restaurant open every day for a week is $5,296. The restaurant has 60
seats. Seat turnover is 1.5 per day. Average check is:
(a) $17.64
(b) $11.76
4. All other things being equal, an increased seat turnover will:
(c) Increase the average check
(d) Decrease total sales revenue
5. Total annual restaurant sales revenue is $754,000. Lunch turnover is 2.25 and there are 60
seats. Lunch is served 5 days a week and is 30% of total annual sales revenue. Lunch
(c) $7.95
(d) $5.45
6. A menu item has a food cost of $5.00 and the selling price is based on a 40% cost. The
selling price of the menu item is:
(c) $ 7.00
(d) $20.00
7. Menu Item 1’s selling price is $3.00 and food cost 20%. Menu Item 2’s selling price is $6.00
and food cost 50%. All other things being equal, it would be better to sell:
(a) An equal quantity of each item
(b) More of Item 1 because it has a lower cost percent
94
8. Menu item sales revenue mix is:
(a) The way menus are compiled with a mix of items with different costs
(b) The way menus are compiled with a mix of items with different selling prices
9. A method of menu analysis that concerns itself with each menu item’s popularity combined
with its contribution margin (gross margin) is known as:
(c) Gross margin analysis
(d) Popularity analysis
10. Average room rate for a motel is $80.00. Occupancy is 60% percent. The motel has 80
rooms. Double occupancy rate is 50%. Spread between single and double rates is $5.00.
Average single rate is:
(c) $93.32
(d) $73.32
11. When the selling prices of items sold in two or more departments are set so that prices
complement or are compatible with each other, this is known as:
(a) Competitive pricing
(b) Multi-department pricing
12. The loss of sales revenue from a guest room on a given day is more serious than loss of sales
(c) The labor cost is higher in the rooms department
(d) Food cost is only a fraction of restaurant sales revenue
13. Forecast annual motel room sales revenue is $642,400. The motel has 40 rooms and an 80%
occupancy rate. What is the average room rate?
(c) $55.76
(d) $50.00
14. In menu engineering, there are four names used to identify four classifications of menu items,
they are:
(a) Plowhorses, puzzles, stars and losers
(b) Plowhorses, puzzles, stars and winners
95
15. Total guests during the year are 38,460. Rooms sold during the year are 29,840. The double
occupancy rate is:
(a) 22.4%
16. Analyzing guest-room occupancy by day of the week is useful because it may indicate:
(c) Which desk clerk is doing the best job of selling rooms?
(d) Room rates could be increased on certain days of the week?
17. The maximum rate established for each room in a hotel is its:
(a) Integrated rate
18. A hotel’s potential average room rate is the average rate that would result if:
(c) There were no unoccupied rooms.
(d) All rooms sold were discounted by only 10%.
EXERCISE SOLUTIONS
E6.1 Find operating income for a NI after tax of $56,000 and a 30% tax rate.
E6.2 Using information from E6.1, find the income tax to be paid.
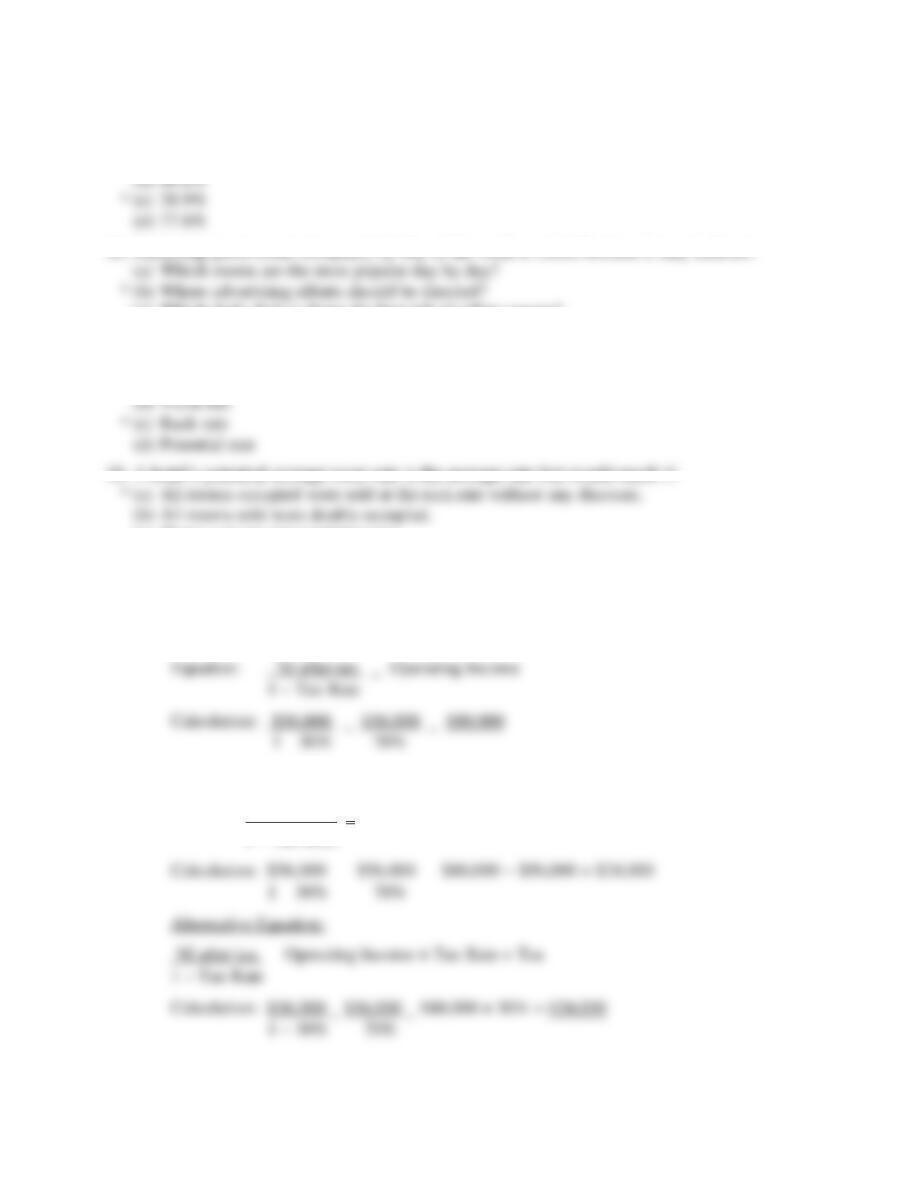
Equation: NI after tax Operating Income − NI after tax = Tax
1 − Tax Rate
96
E6.3 Forecast sales revenue.
E6.4 Determine average monthly check.
Equation: Sales Revenue Average Check
90 × 2.7 × 26 6,318
E6.5 Using information from E6.4, determine effect on average check if seat turnover
decreases from 2.7 to a 2.0
E6.6 Determine the average check for a meal period.
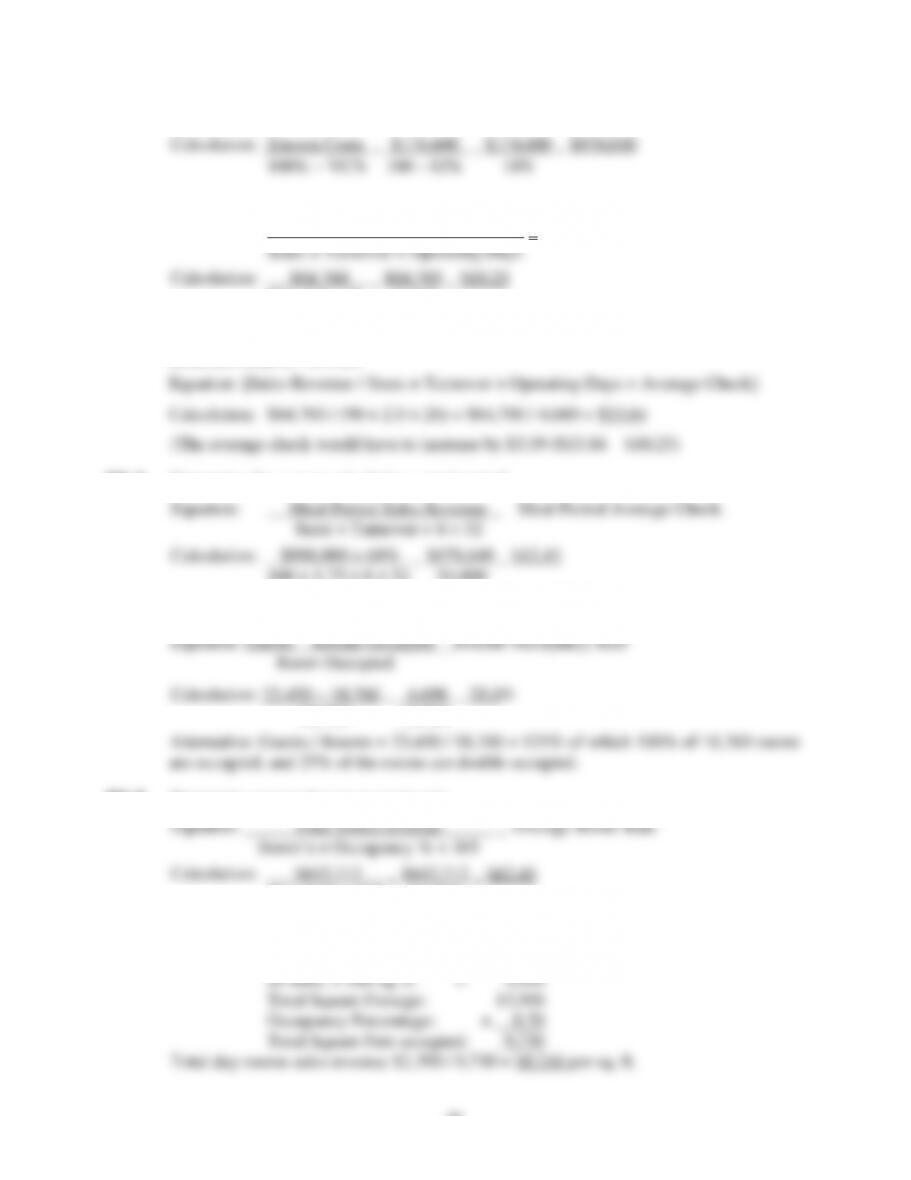
100 × 1.75 × 6 × 52 54,600
E6.7 Determine a double occupancy rate.
18,760 18,760
E6.8 Determine expected average room rate.
50 × 74% × 365 13,505
E6.9 Determine the rate to charge for each square foot.
Calculation: 45 Rms. × 220 sq. ft. = 9,900
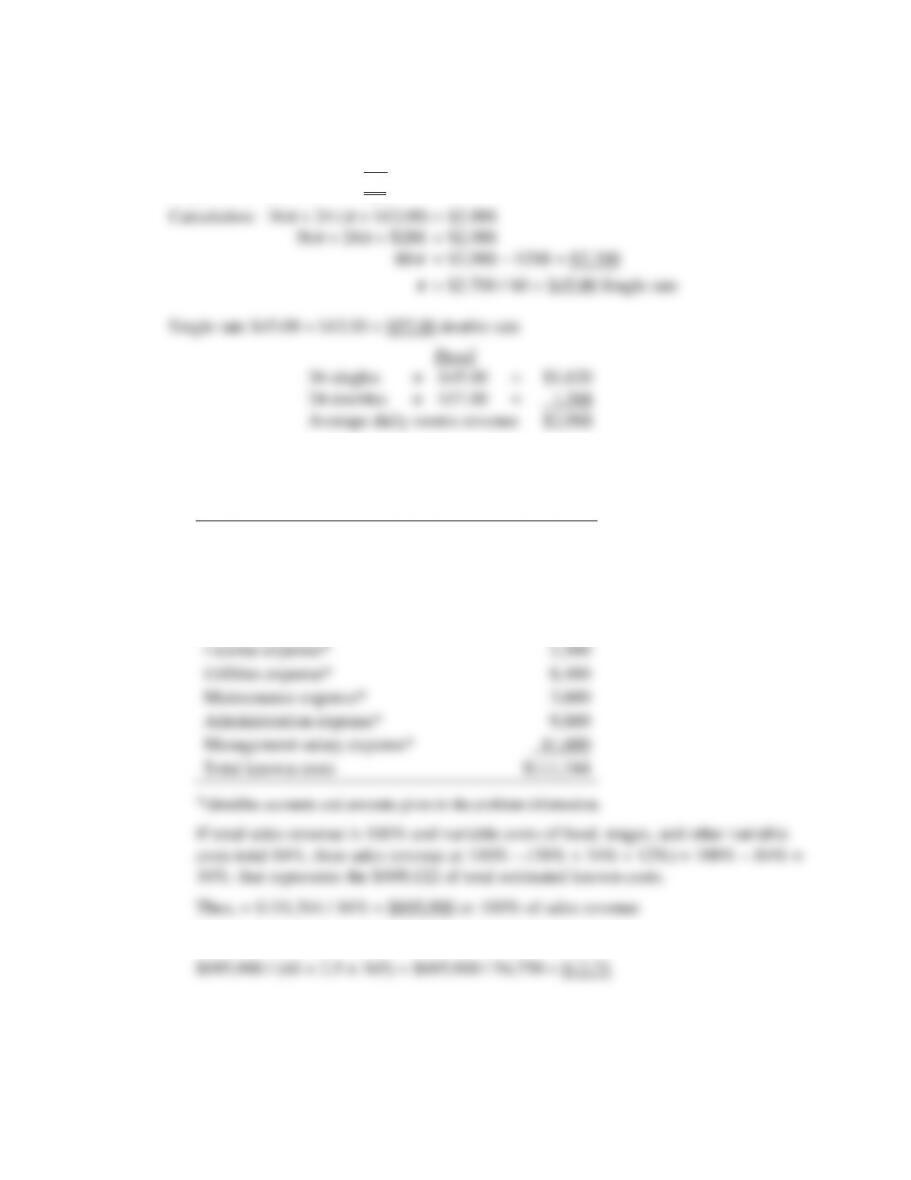
E6.10 Calculating single and double room rates with a $12.00 spread.
Rooms sold per day 60
Double rooms per day (24)
Single rooms per say 36
98
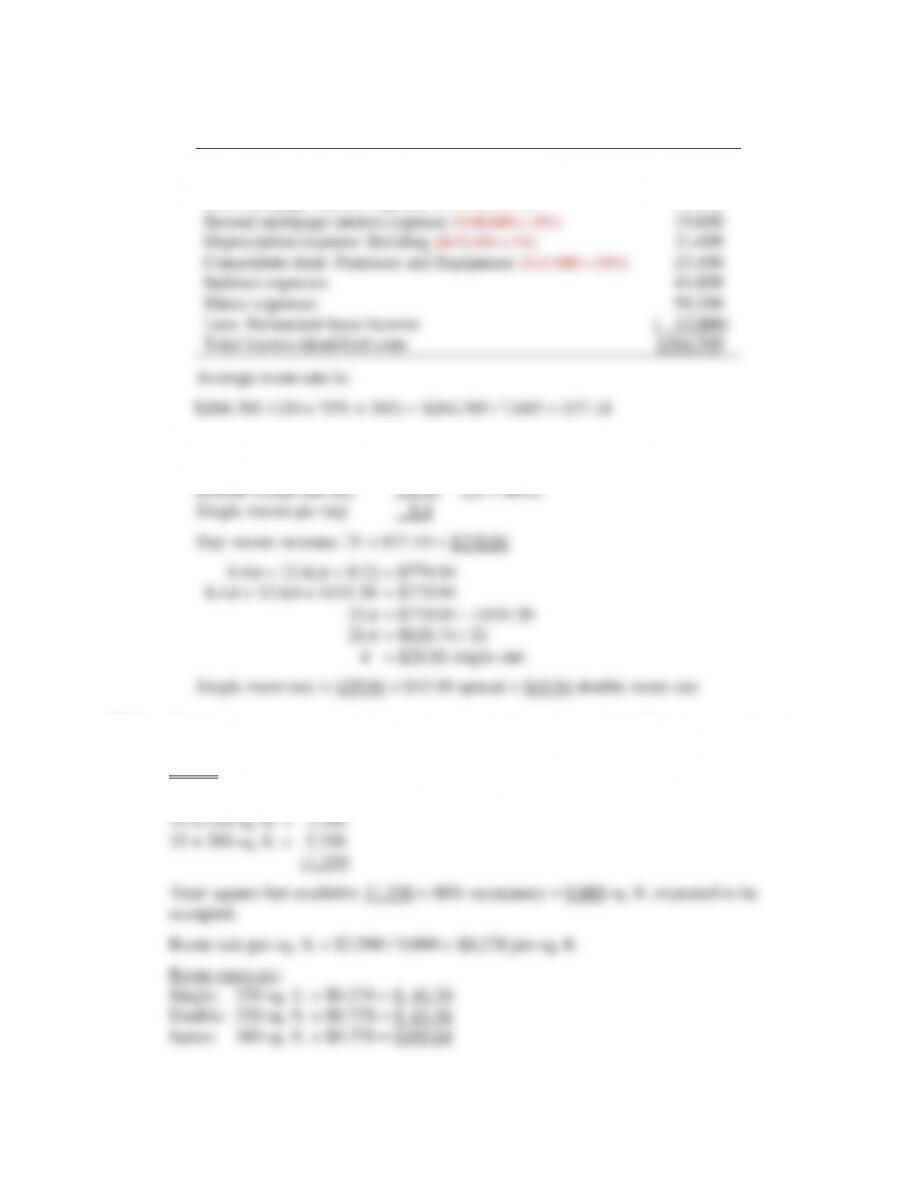
P6.2 a. Calculation of sales revenue to cover total operating costs, NI (after tax) and tax,
which is required to find the average room rate.
Return on investment [$402,800 × 15%]
$ 60,420
Income tax [$60,420 /75% = $80,560 – $60,420]
20,140
Interest expense [$806,400 × 10%]
80,640
Depreciation: Building [$700,200 × 10%]
70,020
Depreciation: Furnishings & Equip. [$150,400 × 20%]
30,080
*Other known fixed costs
141,800
*Other expenses [wages, supplies, etc., at 80% occupancy]
55,400
*Other income [vending machines]
( 5,210)
Total sales revenue to support NI [AT]
$453,290
*Indicates identity and amounts used as given in the problem information.
Average room rate is: $453,290 / (25 × 80% × 365) = $453,290 / 7,300 = $62.09
b. 25 × 80% = 20 Total rooms occupied, of which
20 × 30% = 6 double rooms occupied, and
20 – 6 = 14 rooms’ single occupied
20 × $62.09 = $1,242 average day room sales revenue
14
x
+ 6 (
x
+ $8.00) = $1,242.00
P6.3 Calculating average checks by meal periods.
99
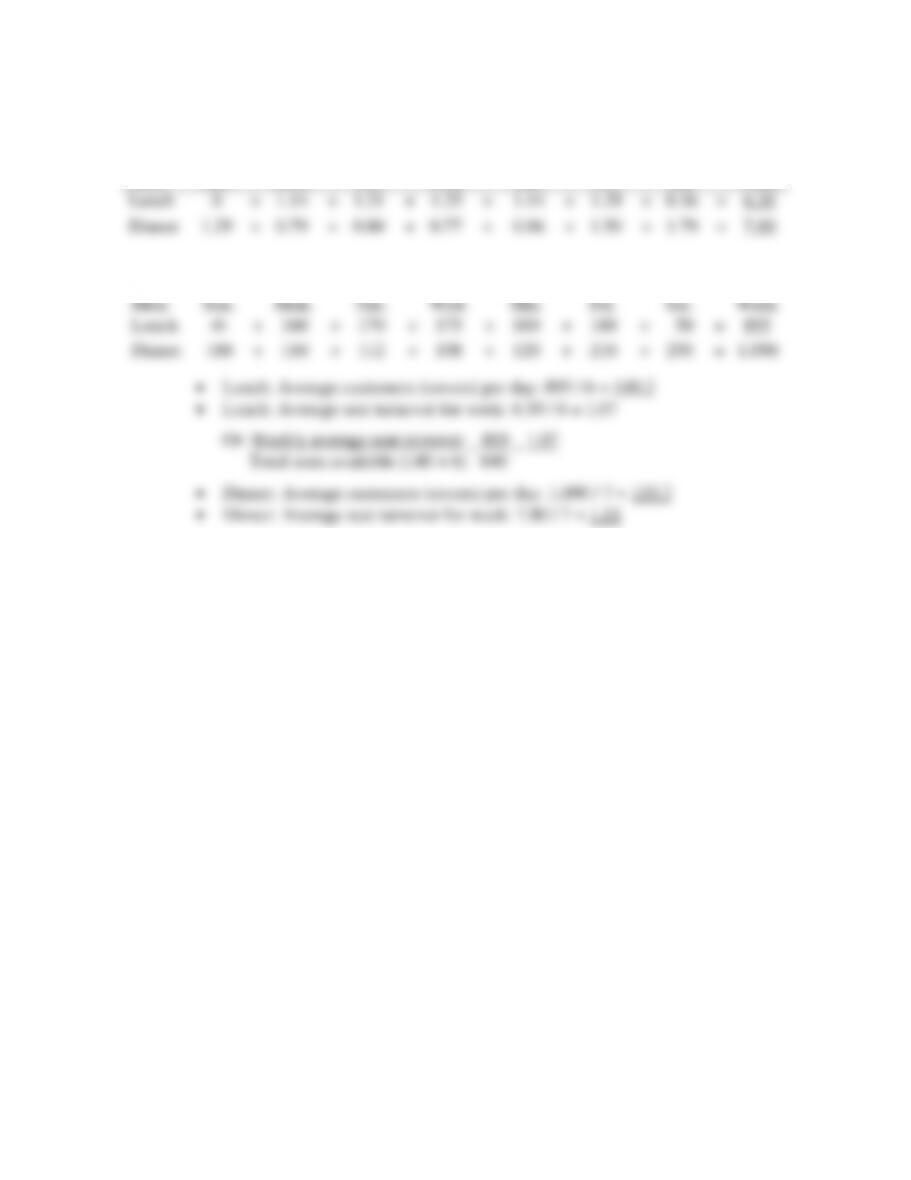
P6.4 Calculating seat turnovers by meal period.
a. Equation: [Guests per day by meal period / Seats available]
Meal
Sun.
Mon.
Tue.
Wed.
Thu.
Fri.
Sat.
Week
Lunch
0
+
1.14
+
1.21
+
1.25
+
1.14
+
1.29
+
0.36
=
6.39
Dinner
1.29
+
0.79
+
0.80
+
0.77
+
0.86
+
1.50
+
1.79
=
7.80
b. Equation: [Guests per day by meal period for the week]
Meal
Sun.
Mon.
Tue.
Wed.
Thu.
Fri.
Sat.
Week
Lunch
-0-
+
160
+
170
+
175
+
160
+
180
+
50
=
895
Dinner
180
+
110
+
112
+
108
+
120
+
210
+
250
=
1,090
• Lunch: Average customers (covers) per day: 895 / 6 = 149.2
• Lunch: Average seat turnover for week: 6.39 / 6 = 1.07
Or: Weekly average seat turnover 895 1.07
Total seats available [140 × 6] 840
• Dinner: Average customers (covers) per day: 1,090 / 7 = 155.7
• Dinner: Average seat turnover for week: 7.80 / 7 = 1.11
c. Staff scheduling, advertising, how much to produce, and attempting to increase the
average check on low-turnover days.
100
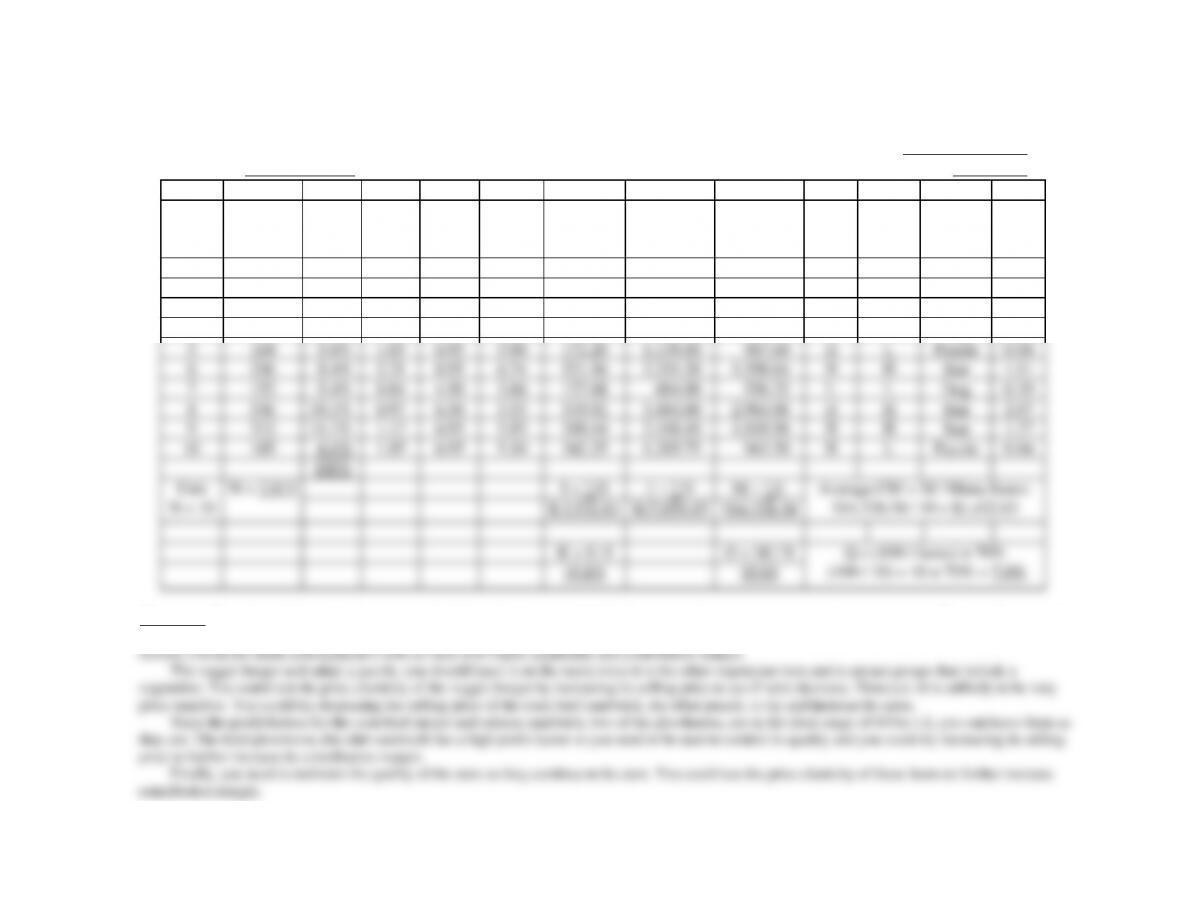
P6.5 Prepare a blank menu engineering worksheet following the example in the text using lined paper.
Date: August 0006
Restaurant: Beech Tree Café
Meal Period: Lunch
(A)
(B)
(C)
(D)
(E)
(F)
(G)
(H)
(L)
(P)
(R)
(S)
(T)
Menu
Item
Number
Sold
(MM)
Menu
Mix %
Item
Food
Cost
Item
Selling
Price
Item
CM
(E – D)
Menu
Costs
(D × B)
Menu Sales
Revenue
(E × B)
Menu CM
(F × B)
CM
Cate-
gory
MM%
Cate-
gory
M. Item
Classifi-
cation
(%)
Profit
Factor
1
328
11.7%
$1.35
$5.95
$4.60
$442.80
$1,951.60
$1,508.80
L
H
Plow
1.05
2
288
10.2%
1.18
5.50
4.32
339.84
1,584.00
1,244.16
L
H
Plow
0.87
3
420
14.9%
1.36
5.95
4.59
571.20
2,499.00
1,927.80
L
H
Plow
1.35
4
192
6.8%
0.76
4.95
4.19
145.92
950.40
804.48
L
L
Dog
0.56
5
164
5.8%
1.05
6.95
5.90
172.20
1,139.80
967.60
H
L
Puzzle
0.68
6
236
8.4%
2.21
8.95
6.74
521.56
2,211.20
1,590.64
H
H
Star
1.11
7
152
5.4%
0.84
4.50
3.66
127.68
684.00
556.32
L
L
Dog
0.39
8
536
19.1%
0.97
6.50
5.53
519.92
3,484.00
2,964.08
H
H
Star
2.07
9
312
11.1%
1.12
6.95
5.83
349.44
2,168.40
1,818.96
H
H
Star
1.27
10
185
6.6%
1.85
6.95
5.10
342.25
1,285.75
943.50
H
L
Puzzle
0.66
100%
Unit
N = 10
N = 2,813
I = ∑G
J = ∑H
M = ∑L
Average CM = M / Menu Items:
$14,326.34 / 10 = $1,432.63
$ 3,532.81
$17,859.15
$14,326.34
K = I / J
O = M / N
Q = (100 / items) × 70%
(100 / 10) = 10 × 70% = 7.0%
19.8%
$5.09
Discussion: Even though the egg and tomato sandwich is a dog, you would likely leave it on the menu because it is a vegetarian item. You could attempt to
increase its price to increase its contribution margin or decrease its selling price to try to increase sales. The other dog item, hot dog and fries, you should
101
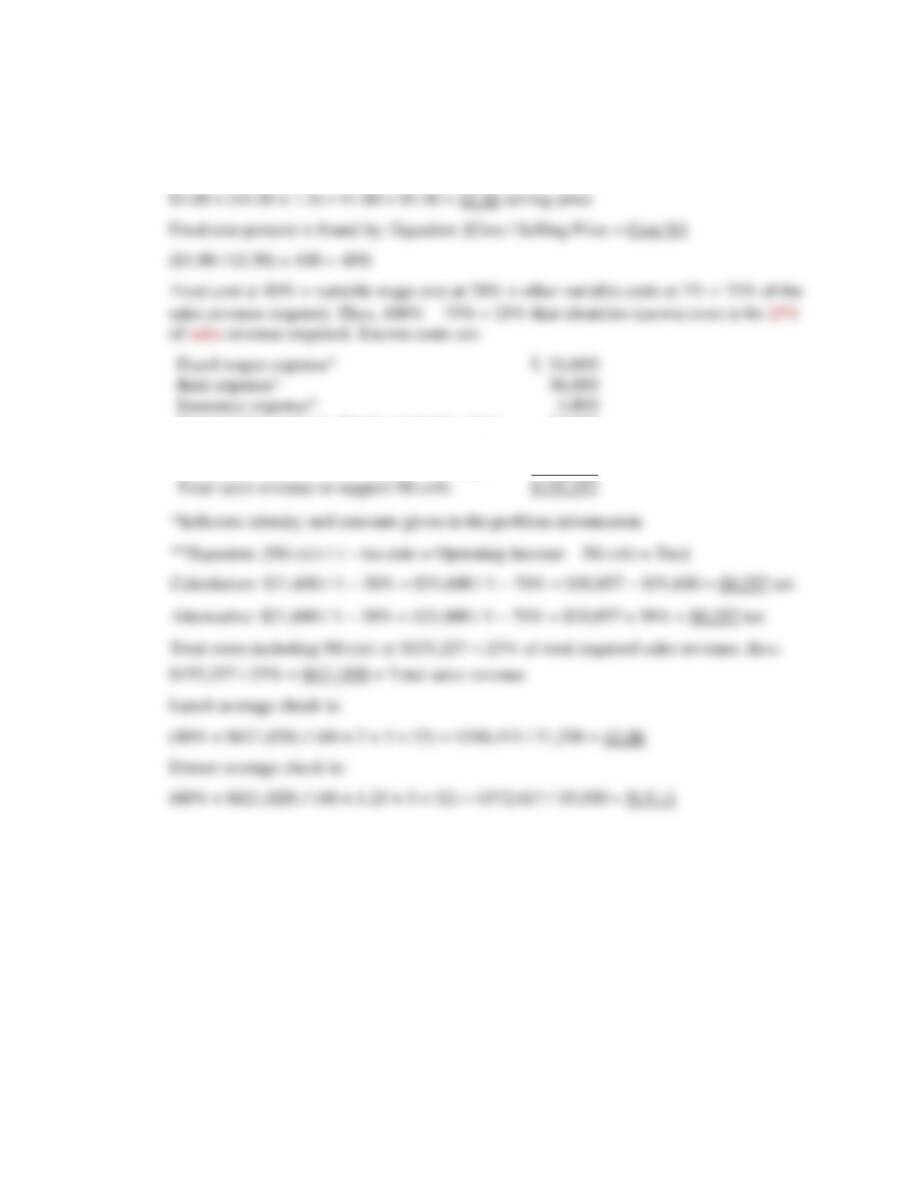
P6.6 Calculate the average check per meal period to cover all costs including net income
(after tax). Using the information provided, the food cost percentage must be
determined. Setting a base cost of $1.00 will allow the 150% to be applied to find the
selling price, that divided into the cost will find the cost percentage.
Fixed wages expense*
$ 51,600
Rent expense*
36,000
Insurance expense*
4,800
Depreciation expense, Equip. [$160,000 × 20%]
32,000
Return on investment [12% × $180,000]
21,600
Income tax [$21,600 / 70% = $30,857 − $21,600]**
9,257
Total sales revenue to support NI (AT)
$155,257
*Indicates identity and amounts given in the problem information.
**Equation: [NI (AT) / 1 – tax rate = Operating Income − NI (AT) = Tax]
Calculation: $21,600 / 1 − 30% = $21,600 / 1 − 70% = $30,857 – $21,600 = $9,257 tax
Alternative: $21,600 / 1 − 30% = $21,600 / 1 − 70% = $30,857 x 30% = $9,257 tax
Total costs including NI (AT) at $155,257 = 25% of total required sales revenue, thus:
$155,257 / 25% = $621,028 = Total sales revenue
Lunch average check is:
(40% × $621,028) / (60 × 2 × 5 × 52) = $248,411 / 31,200 = $7.96
Dinner average check is:
(60% × $621,028) / (60 × 1.25 × 5 × 52) = $372,617 / 19,500 = $19.11
102
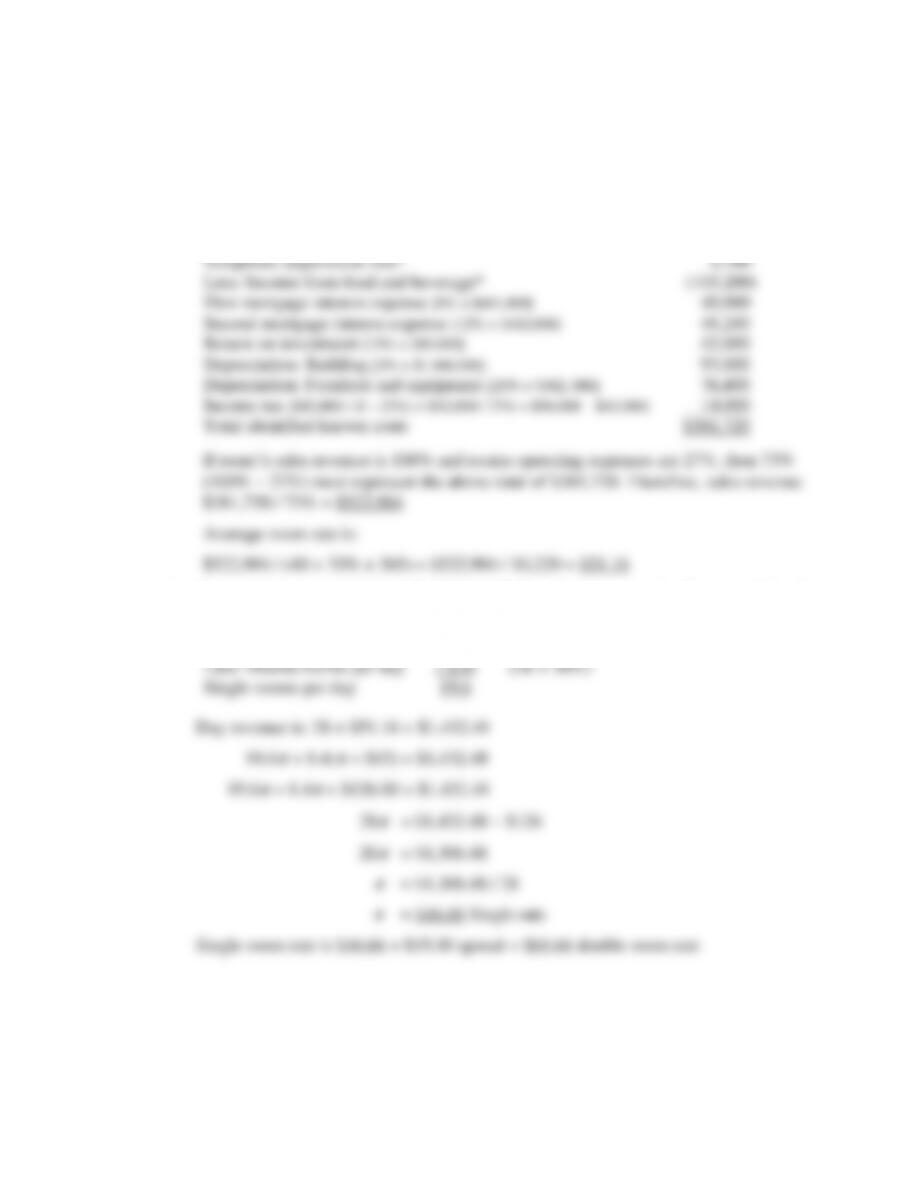
P6.7 a. Calculate the hotel’s average room rate for the next year.
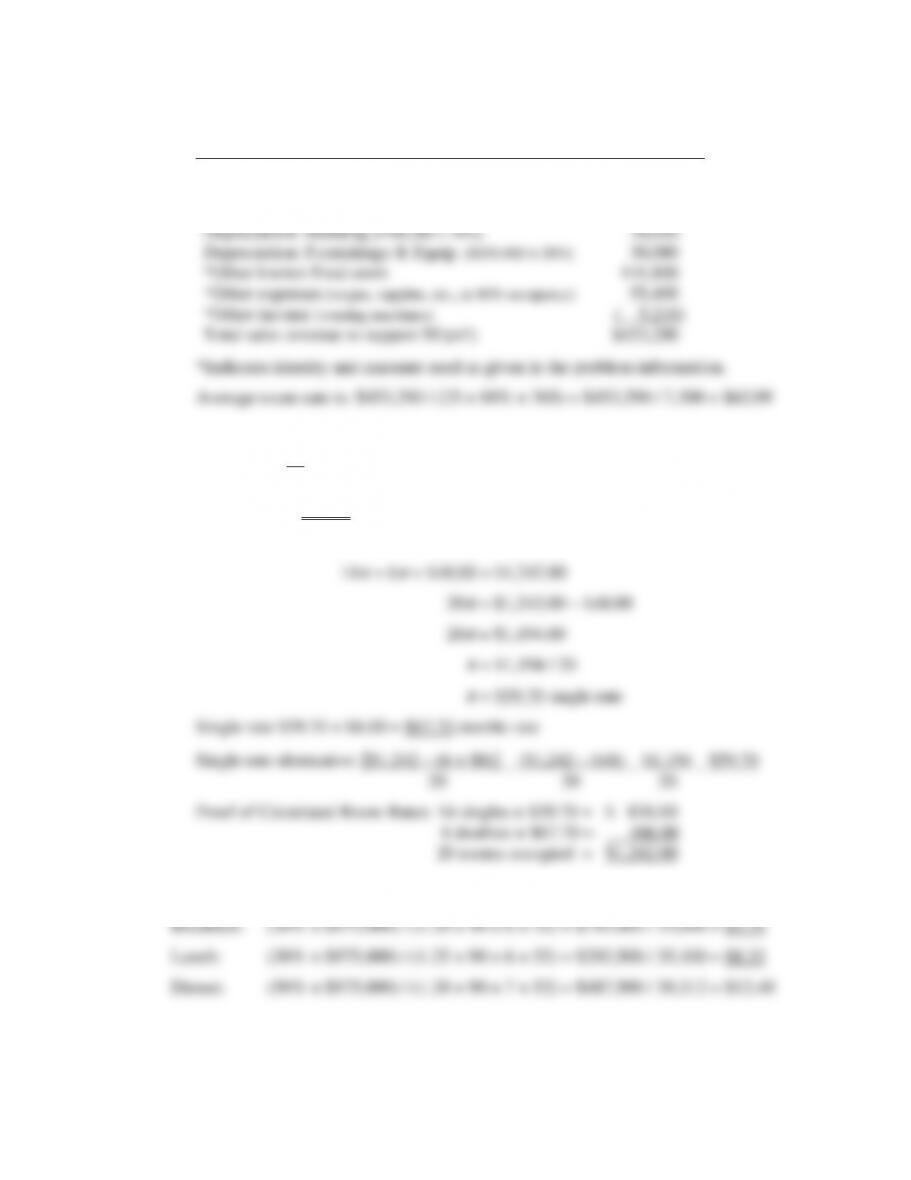
Administrative and general expenses*
$ 38,300
Marketing expenses*
28,900
Energy expense*
35,100
Repairs and maintenance expense*
28,800
Property taxes*
17,600
Insurance expense*
4,800
Telephone department loss*
9,700
Less: Income from food and beverage*
(103,200)
First mortgage interest expense [8% × $601,000]
48,080
Second mortgage interest expense [12% × $402,000]
48,240
Return on investment [15% × 280,000]
42,000
Depreciation: Building [5% × $1,860,000]
93,000
Depreciation: Furniture and equipment [20% × $382, 000]
76,400
Income tax [$42,000 / (1 – 25%) = $42,000 / 75% = $56,000 − $42,000]
14,000
Total identified known costs
$381,720
If room’s sales revenue is 100% and rooms operating expenses are 27%, then 73%
(100% − 27%) must represent the above total of $381,720. Therefore, sales revenue
$381,720 / 73% = $522,904
Average room rate is:
$522,904 / (40 × 70% × 365) = $522,904 / 10,220 = $51.16
b. Average rooms occupied are 28. Of these 30% or 8.4 rooms are double occupied and
the balance of 20 rooms are single occupied.
Rooms sold per day
28.0
(40 × 70%)
Less: Double rooms per day
( 8.4)
(28 × 30%)
Single rooms per day
19.6
Day revenue is: 28 × $51.16 = $1,432.48
19.6
x
+ 8.4(
x
+ $15) = $1,432.48
19.6
x
+ 8.4
x
+ $126.00 = $1,432.48
28
x
= $1,432.48 − $126
28
x
= $1,306.48
x
= $1,306.48 / 28
x
= $46.66 Single rate
Single room rate is $46.66 + $15.00 spread = $61.66 double room rate
103
P6.8 a. Calculate an investment return based on net income after tax and determine an
average single and double room rate.
Return on investment [$520,000 × 12%]
$ 62,400
Income tax [$62,400 / 76% = $82,105 × 24%] or [$82,105 – $62,400]
19,705
First mortgage interest expense [$359,000 × 10%]
35,900
Second mortgage interest expense [$140,000 × 14%]
19,600
Depreciation expense: Building [$632,000 × 5%]
31,600
Consolidate depr: Furniture and Equipment [$117,000 × 20%]
23,400
Indirect expenses
44,800
Direct expenses
59,300
Less: Restaurant lease income
( 12,000)
Total known identified costs
$284,705
Average room rate is:
$284,705 / (30 × 70% × 365) = $284,705 / 7,665 = $37.14
b. Calculate single and set double room rate with a $12.00 spread:
Rooms sold per day 21.0 (30 × 70%)
P6.9 Finding the rate per square foot to set room rates to achieve $912,500 of projected total
sales revenue in the next year. Room sales revenue per day equals $912,500 / 365 =
$2,500 daily sales revenue required.
15 × 150 sq. ft. = 2,250
104
P6.10 Setting discount rates:
Discount 5%: 75% × $60 − $8
$60 × (1 – 5%) − $8
Discount 10%: 75% × $52
$60 × (1 − 10%) − $8
Discount 15%: 75% × $52
$60 × (1 − 15%) − $8
Discount 20%: 75% × $52
$60 × (1 − 20%) − $8
105
P6.11 a. Total potential sales revenue is $62 × 7,300 room nights =$452,600.
The new rack rate will have to be:
b. Vacation traveler: 75% × 7,300 × $64.25 = $351,769
Business traveler: 15% × 7,300 × $57.83 = 63,324
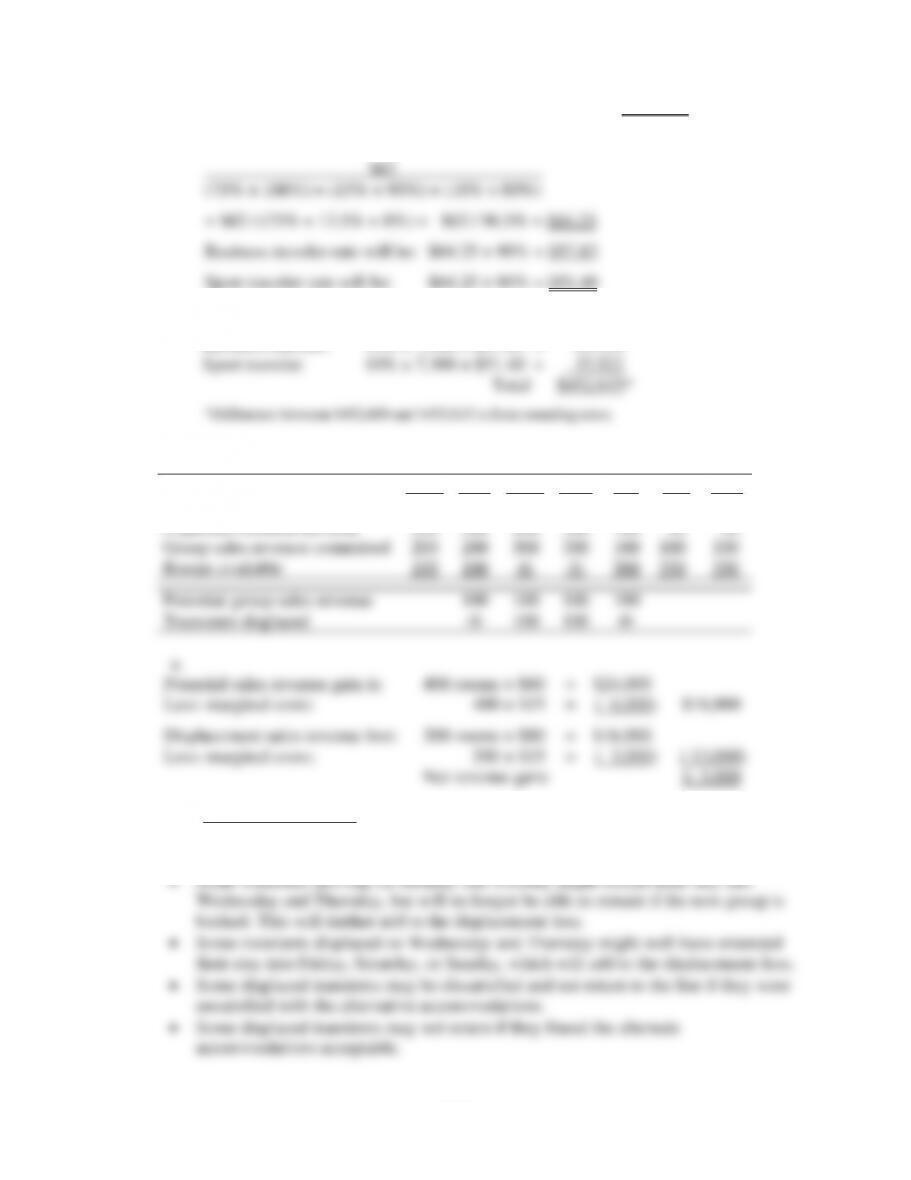
P6.12 Calculating new groups sales revenue, accept group, Yes or No.
Mon.
Tue.
Wed.
Thu.
Fri.
Sat.
Sun.
Rooms available
500
500
500
500
500
500
500
Expected transient demand
200
200
200
200
100
50
50
Group sales revenue committed
200
200
300
300
100
100
100
Rooms available
100
100
-0-
-0-
300
350
350
Potential group sales revenue
100
100
100
100
Transients displaced
-0-
100
100
-0-
a.
Potential sales revenue gain is:
400 rooms × $60
=
$24,000
Less: marginal costs:
400 × $15
=
( 6,000)
$18,000
Displacement sales revenue lost:
200 rooms × $80
=
$16,000
Less: marginal costs:
200 × $15
=
( 3,000)
( 13,000)
Net revenue gain:
$ 5,000
b. Other considerations:
• The additional 100 rooms sold on each Thursday and Friday would likely increase
sales revenue in the food and beverage departments.
106
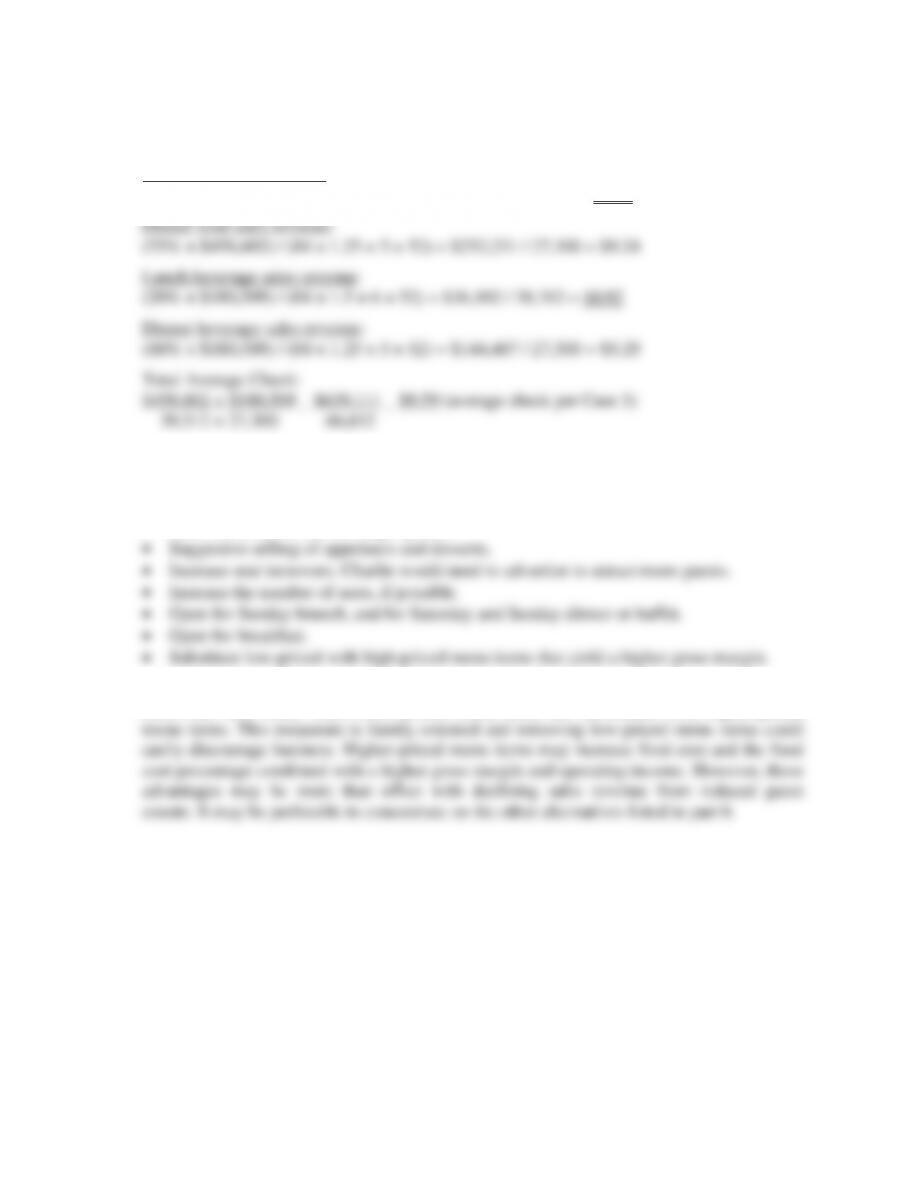
CASE 6 SOLUTIONS
Calculating average checks for food and beverage operations for three meal periods.
a. Lunch food sales revenue:
(45% × $458,602) / (84 × 1.5 × 6 × 52) = $206,371 / 39,312 = $5.25
b. Suggestions on how to raise the average check:
• Use better selling techniques such as promoting wine with meals. However, you have to
be careful with this because of the drinking and driving concerns.
• Raise menu (food and beverage) prices.
c. Raising menu prices will have a psychological impact on customers in general. This same
effect can also occur when lower-priced menu items are substituted with higher-priced


