69
P4.6 Use the information provided from P4.5 and the income statement for year 0007,
calculate the following ratios.
a. Return on Assets: [Income before interest and income tax / Total average assets]
b. Net return on assets: [Net income after income tax / Total average assets]
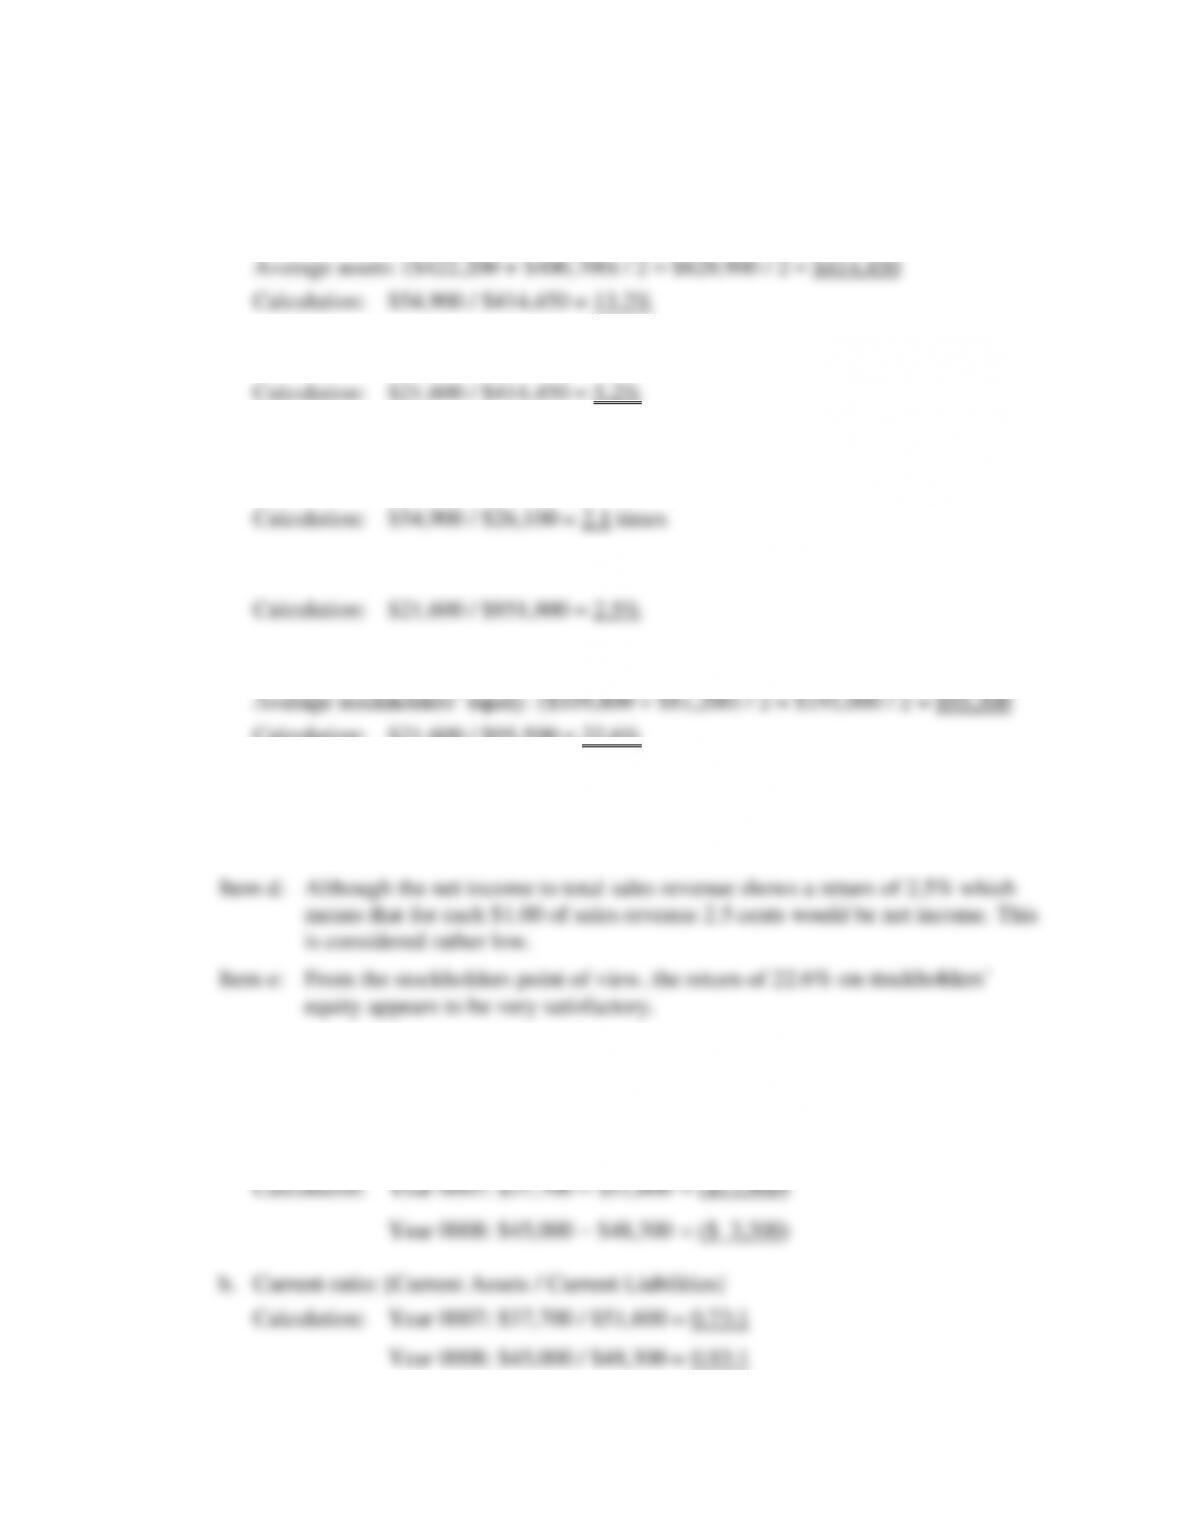
Calculation: $21,600 / $414,450 = 5.2%
c. Number of times interest is earned:
[Income before interest and income tax / Interest expense]
d. Net income to sales revenue ratio: [Net income [AT] / Total sales revenue]
e. Return on stockholders’ equity: [Net income [AT] / Average stockholders’ equity]
Calculation: $21,600 / $95,500 = 22.6%
Discussion:
Item c: The number of times interest is earned is marginally low but acceptable. The
income after tax can drop by 50% before the operation cannot pay its interest
expense.
P4.7 Calculation of liquidity, long-term solvency and profitability ratios:
a. Working Capital: [Current Assets – Current Liabilities]
70
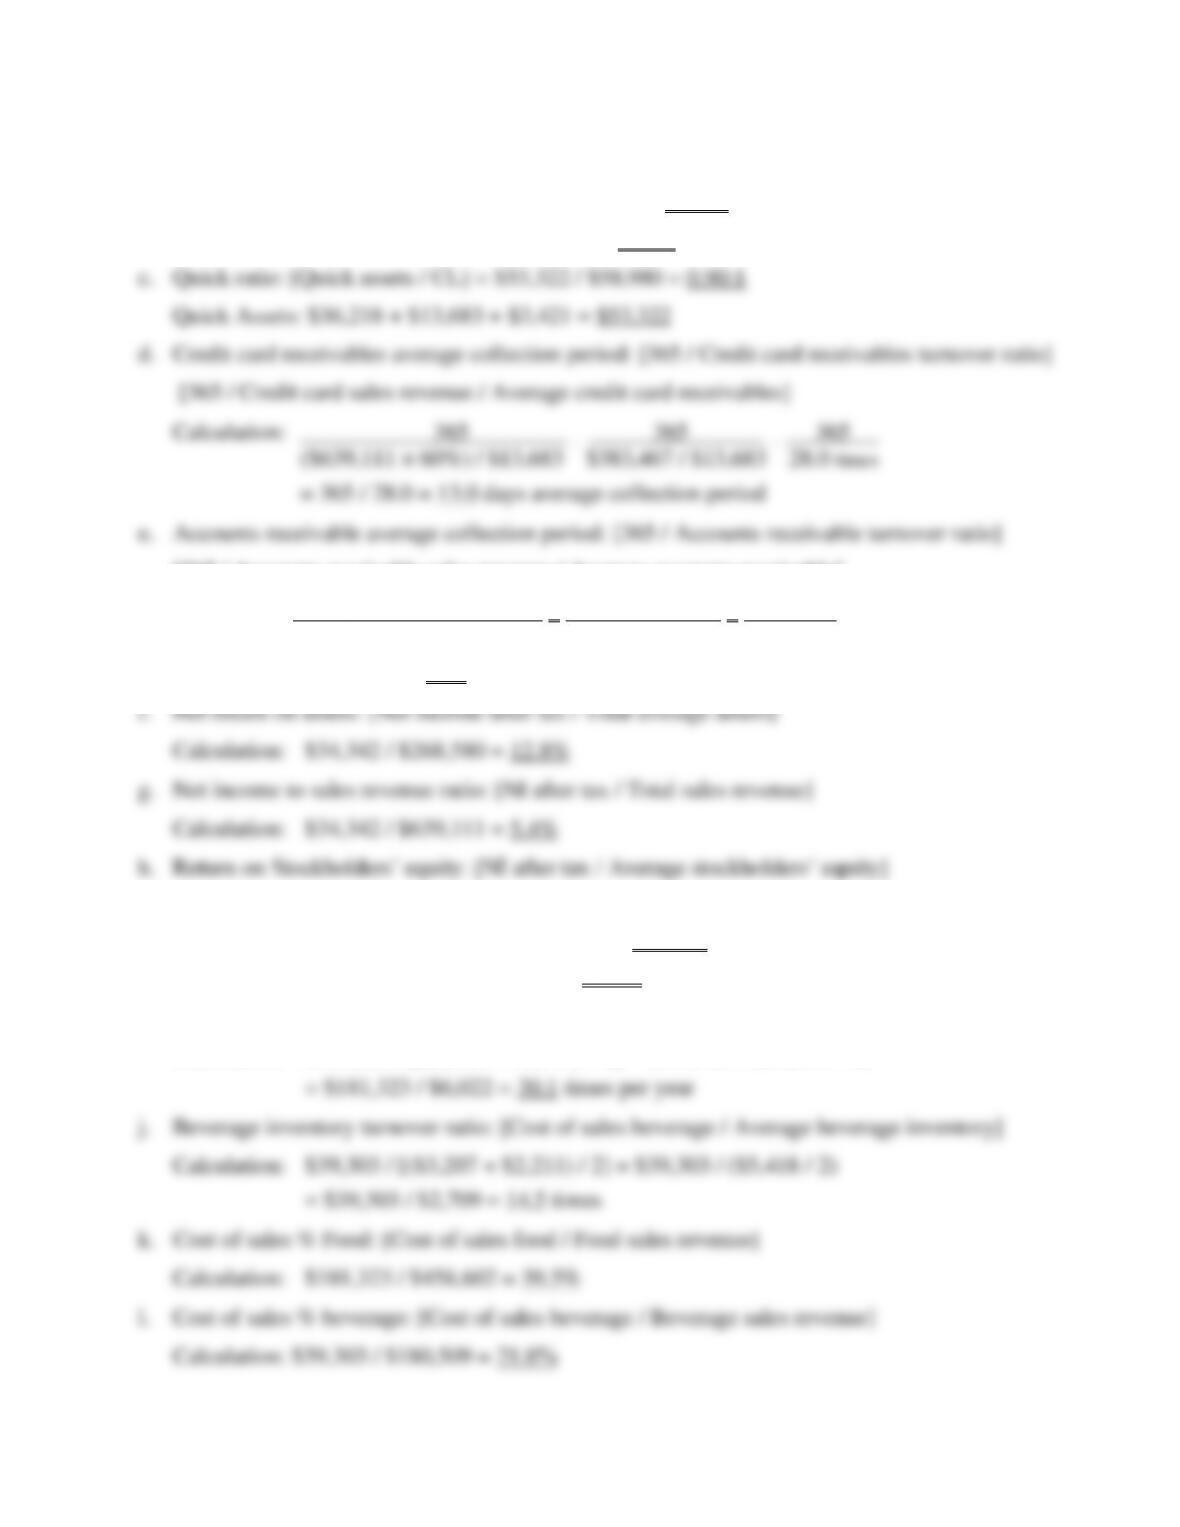
c. Quick ratio (Acid test ratio):
[Total current assets − Inventories − Prepaid expenses / Total current liabilities]
= 0.55:1
d. Credit card receivables as percentage of credit card sales revenue for Year 0008.
[Average credit card receivables / Credit card sales revenue]
Calculation: Year 0008:
e. Credit card receivables turnover ratio, based on credit card sales revenue.
f. Credit card receivables average collection period for Year 0008.
[365 / Credit card turnover]
g. Accounts receivable as a percentage of accounts receivable credit sales revenue.
[Average accounts receivable / Accounts receivable credit sales revenue]
Calculation: Year 0008:
h. Accounts receivable turnover ratio for Year 0008.
[Accounts receivable credit sales revenue / Average accounts receivable]
i. Accounts receivable average collection period for Year 0008.
[Accounts receivable credit sales revenue / Average accounts receivable]
j. Total assets to total liabilities ratio for years 0007 and 0008.
[Total assets / Total liabilities]
71
k. Total liabilities to total assets ratio for years 0007 and 0008.
[Total liabilities / Total assets]
l. Total liabilities to Stockholders’ equity for years 0007 and 0008.
[Total liabilities / Stockholders’ equity]
m. Net return on total assets ratio for Year 0008.
[Net income after income tax / Total average assets]
Calculation: Year 0008:
n. Number of times interest earned for Year 0008.
[Income before interest and income tax / Interest expense]
o. Net income to total sales revenue ratio for Year 0008.
[Net income after tax / Total sales revenue]
p. Return on Stockholders’ equity for Year 0008.
[Net income after tax / Average stockholders’ equity]
Calculation: Year 0008:
q. Food inventory turnover ratio Year 0008: [Cost of sales / Average inventory]
r. Fixed assets turnover ratio Year 0008:
[Total sales revenue / Total average fixed assets]
Calculation: Year 0008:
72
P4.8 a. Projected Incremental Income Statement:
Sales Revenue [$210,000 x 10%]
$21,000
Cost of Sales [$21,000 x 30%]
$6,300
Payroll expense [$125 x 52 weeks]
6,500
Depreciation expense [$20,000 / 5 yrs.]
4,000
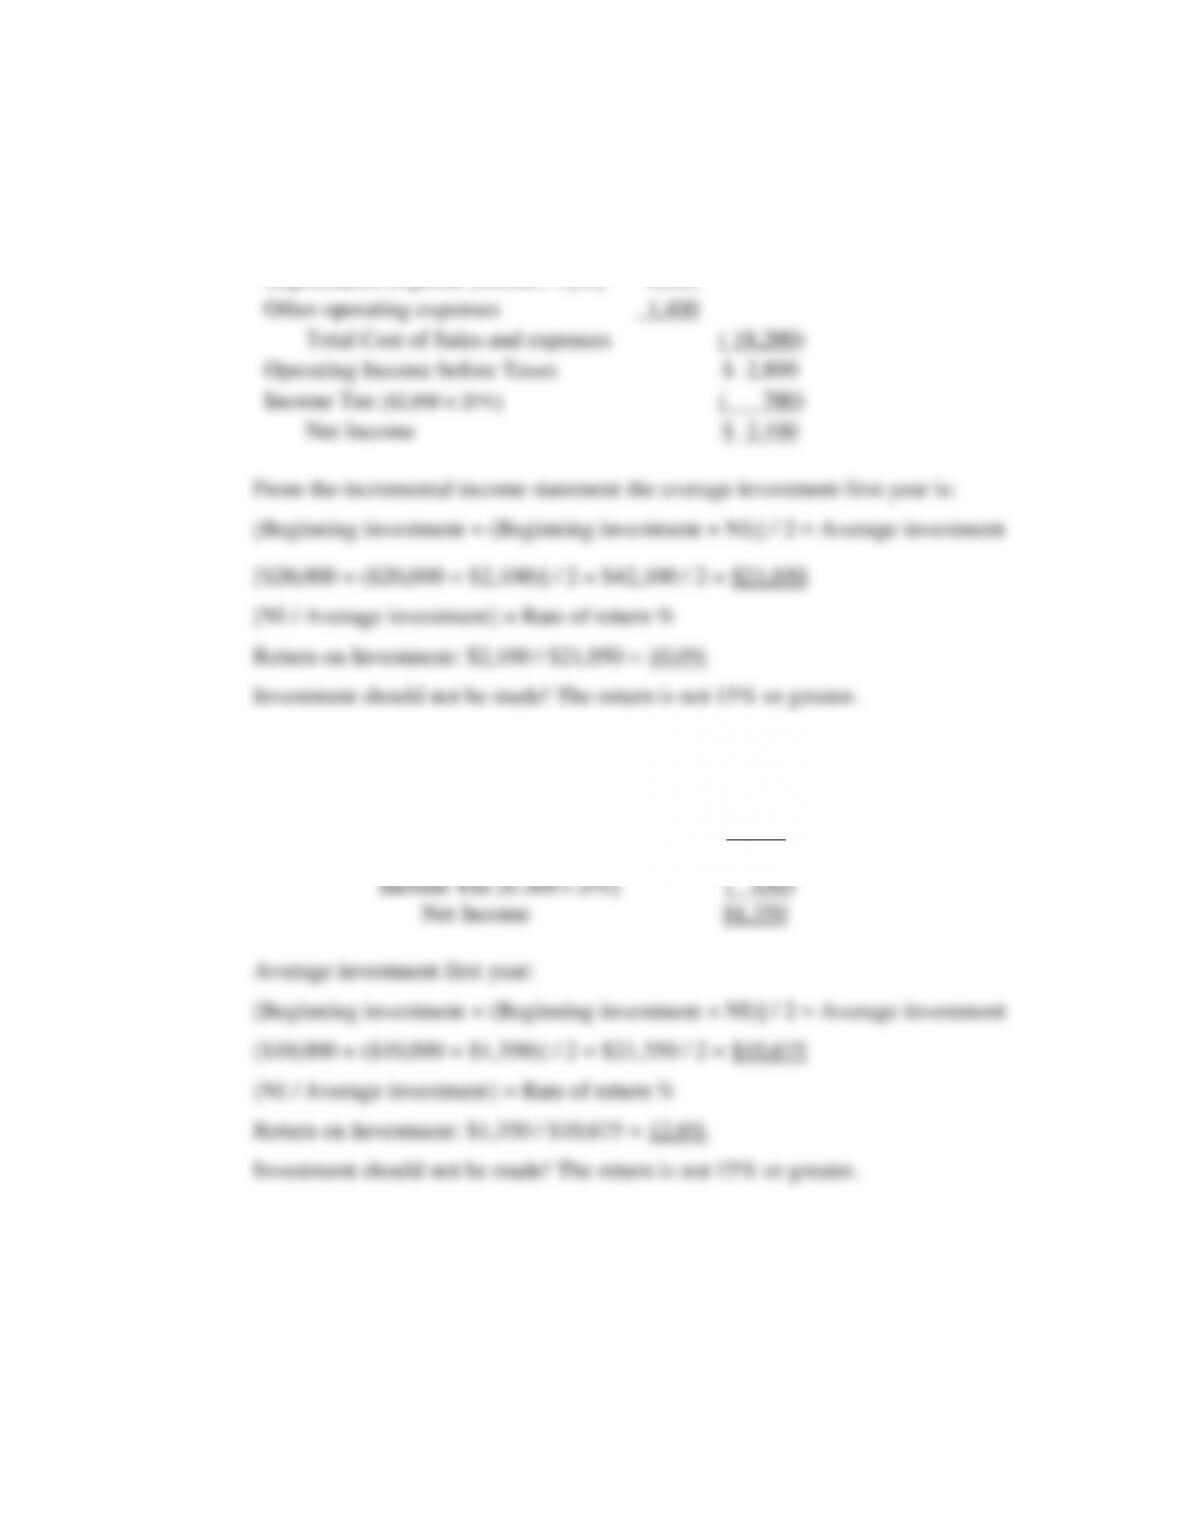
Other operating expenses
1,400
Total Cost of Sales and expenses
( 18,200)
Operating Income before Taxes
$ 2,800
Income Tax [$2,800 x 25%]
( 700)
Net Income
$ 2,100
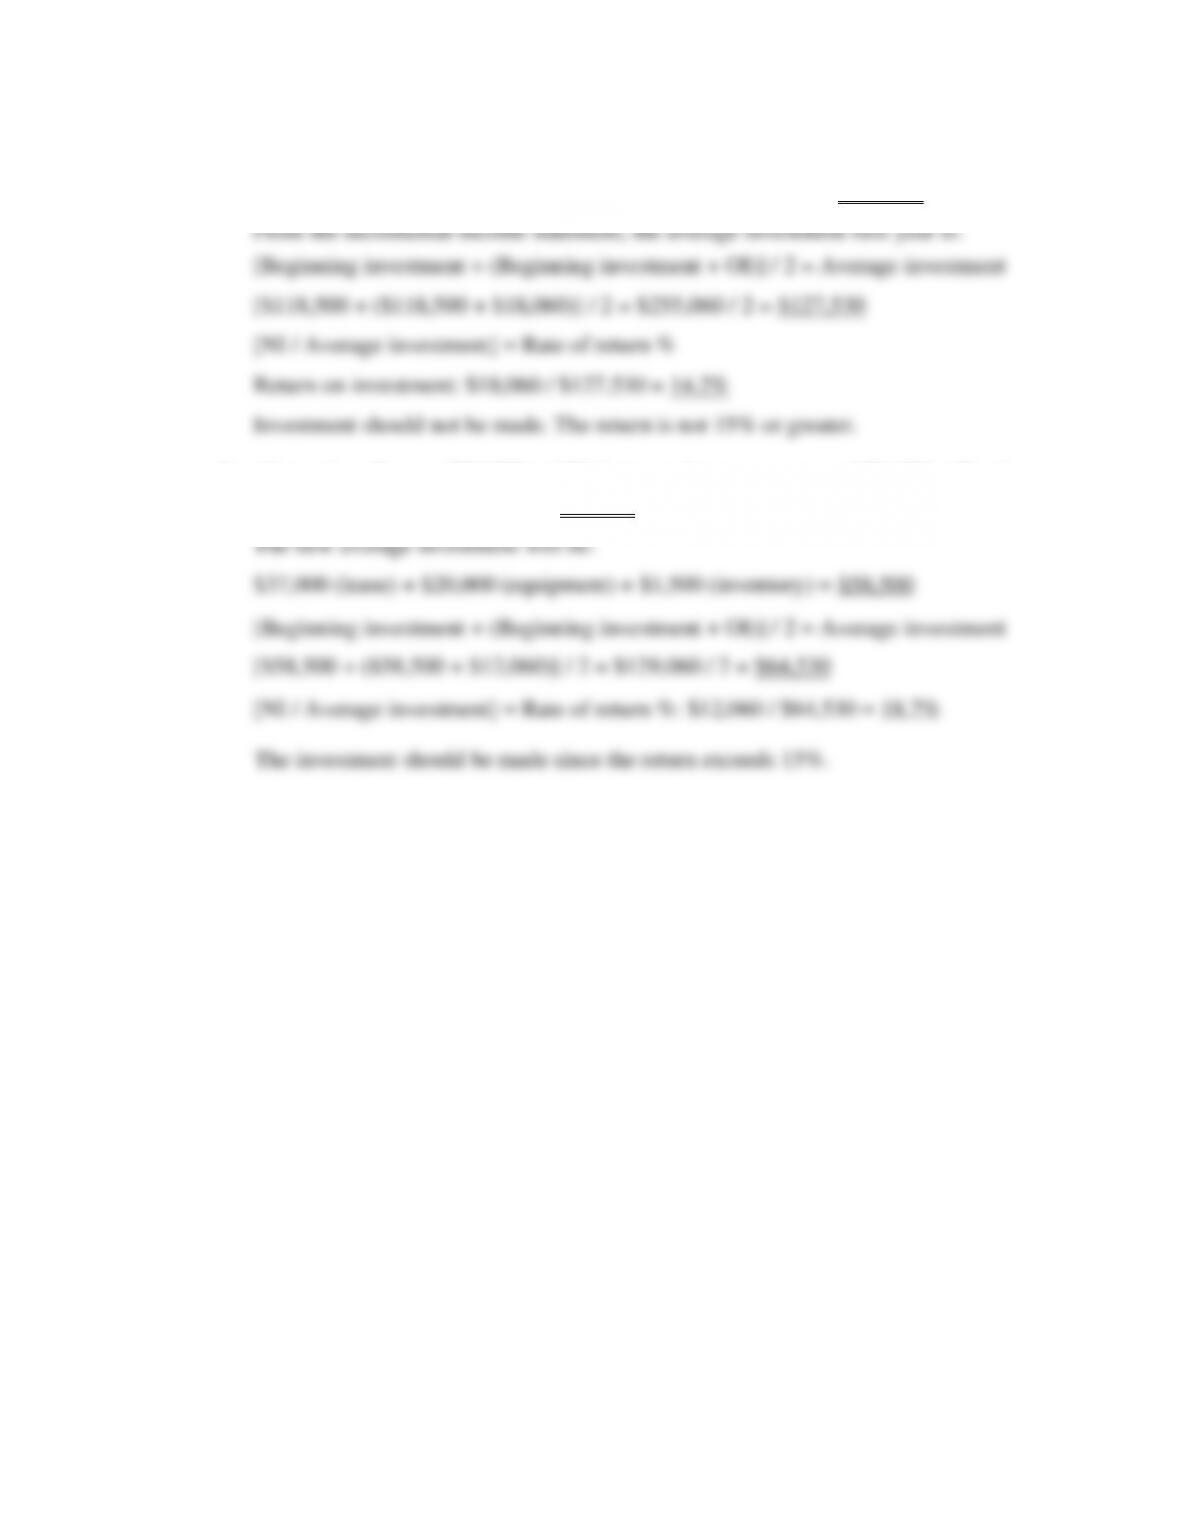
From the incremental income statement the average investment first year is:
[Beginning investment + (Beginning investment + NI)] / 2 = Average investment
[$20,000 + ($20,000 + $2,100)] / 2 = $42,100 / 2 = $21,050
[NI / Average investment] = Rate of return %
Return on Investment: $2,100 / $21,050 = 10.0%
Investment should not be made! The return is not 15% or greater.
b. Return on investment using $10,000 of owner’s funds and $10,000 of debt at 10%
interest:
Income before Interest and Taxes
$2,800
Interest expense [$10,000 × 10%]
(1,000)
Operating Income [BT]
$1,800
Income Tax [$1,800 × 25%]
( 450)
Net Income
$1,350
Average investment first year:
[Beginning investment + (Beginning investment + NI)] / 2 = Average investment
[$10,000 + ($10,000 + $1,350)] / 2 = $21,350 / 2 = $10,675
[NI / Average investment] = Rate of return %
Return on Investment: $1,350 / $10,675 = 12.6%
Investment should not be made! The return is not 15% or greater.
73
P4.9 Ratio analysis and evaluation.
a. Increasing: As the ratio increases, current assets increased in relation to current
liabilities. Current assets increased $0.36 from $1.04 to $1.40 to each $1.00 of
current liabilities.
P4.10 Ratio analysis and evaluation.
a. Decreasing: Current assets decreased in relation to current liabilities, from 1.24:1
to 1.05:1.
9.9%.
f. Three years ago: The liabilities to equity ratio increased from 1.94:1 to 2.95:1,
P4.11 Calculation of various ratios, percentages and values.
1. Average room rate per room occupied: [Rooms Sales Revenue / Rooms Occupied]
74
Calculation: 1,798 / 2,325 = 77.3%
3. Room double occupancy %: [Guests – Rooms Occupied / Rooms Occupied]
Calculation: (3,417 – 1,798) = 1,619 / 1,798 = 90.0% double occupancy
4. Food cost %: [Cost of Sales / Food Sales Revenue]
75
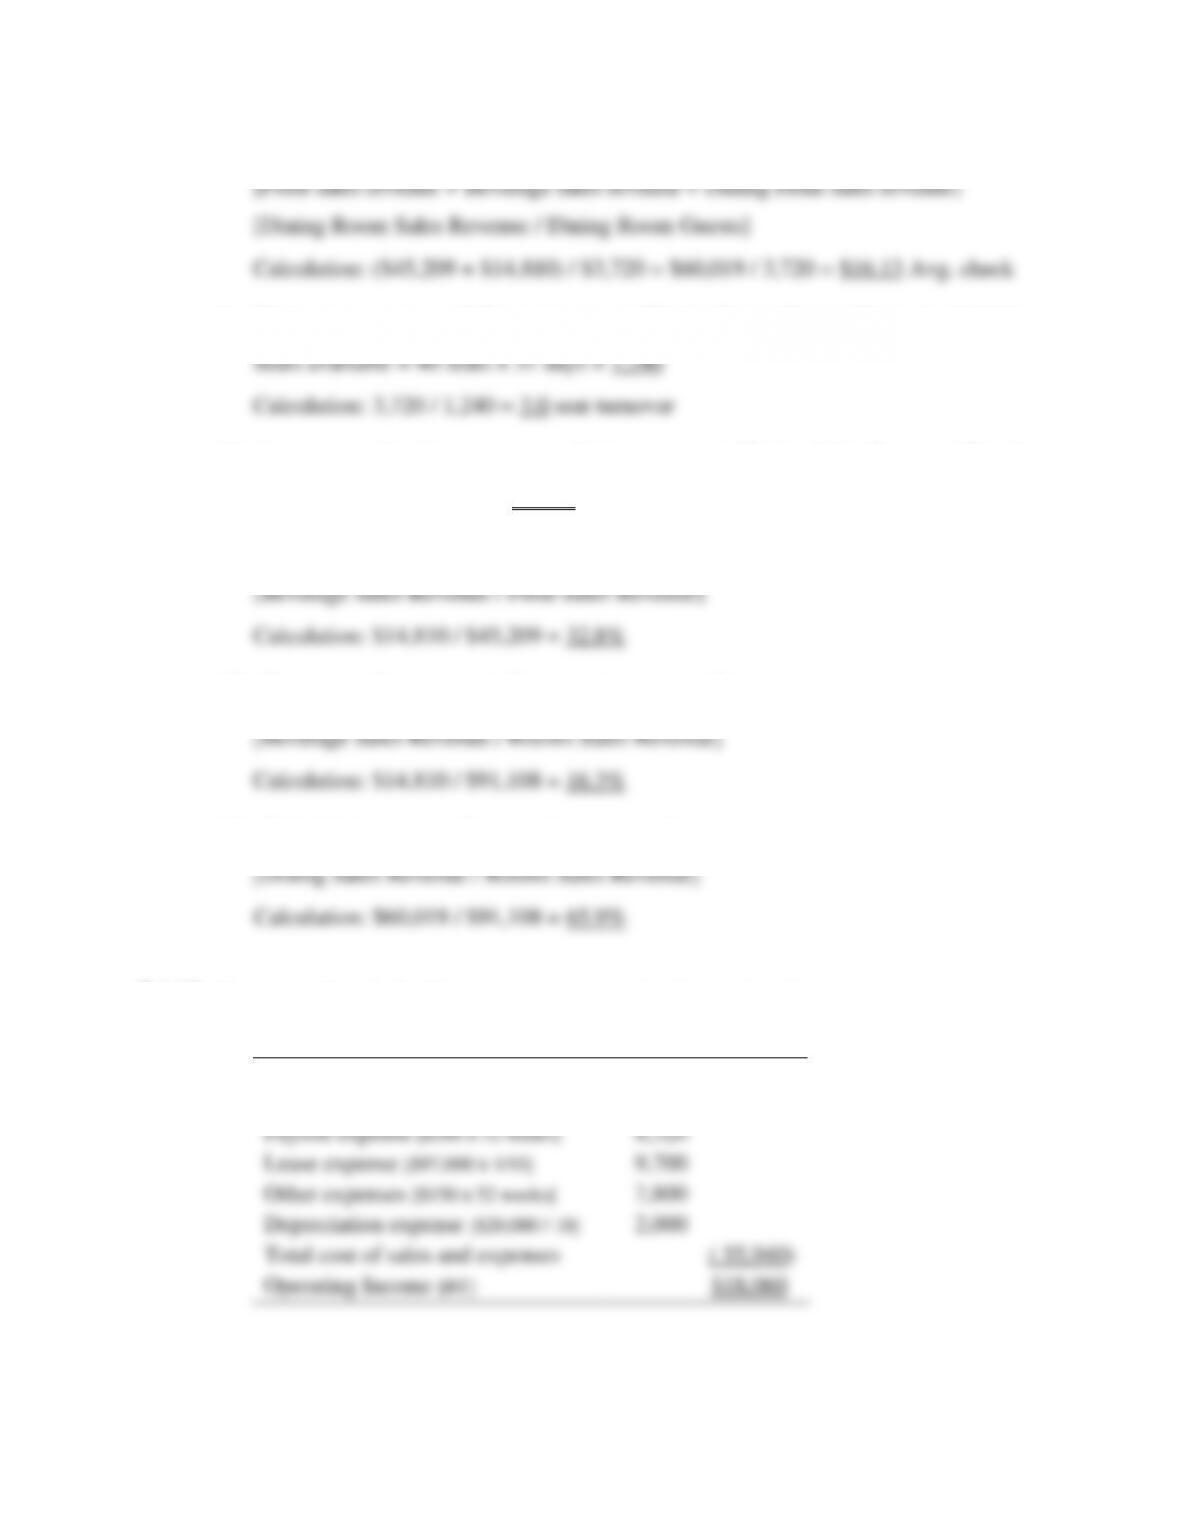
8. Total average check, Dining Room:
9. Dining room average daily seat turnover: [Dining Room Guests / Seats Available]
10. Average month sales revenue per dining room seat: [Dining Sales Revenue / Seats]
Calculation: $60,019 / 40 = $1,500
11. Beverage sales revenue to food sales revenue %:
12. Beverage sales revenue to Rooms sales revenue %:
13. Total dining room to Rooms sales revenue %:
P4.12 Incremental analysis of pre-tax return (operating income) on investment.
1. Projected Pre-tax Incremental Income Statement
Sales Revenue [$370,000 x 20%]
$74,000
Cost of Sales [$74,000 x 38%]
$28,120
Payroll expense [$160 x 52 weeks]
8,320
Lease expense [$97,000 x 1/10]
9,700
Other expenses [$150 x 52 weeks]
7,800
Depreciation expense [$20,000 / 10]
2,000
Total cost of sales and expenses
( 55,940)
Operating Income [BT]
$18,060
76
Investment required:
$97,000 (lease) + $20,000 (equipment) + $1,500 (inventory) = $118,500
2. Alternative: Borrow $60,000 at 10% interest. Interest expense of $6,000 will reduce
operating income (before tax) to $12,060 ($18,060 − $6,000).
77
CASE 4 SOLUTIONS
a. Working Capital: [CA – CL] = $63,584 − $58,980 = $4,604
b. Current ratio: [CA / CL] = $63,584 / $58,980 = 1.08:1
[365 / Accounts receivable sales revenue / Average accounts receivable]
Calculation: 365 365 365
($639,111 × 10%) / $3,421 $63,911 / $3,421 18.7 times
= 365 / 18.7 = 19.5 days average collection period
Average stockholders’ equity: $50,000 + ($50,000 + $34,342) / 2 = ($50,000 + $84,342) / 2
= $134,342 / 2 = $67,171
Calculation of return: $34,342 / $67,171 = 51.1%
i. Food inventory turnover ratio: [Cost of sales food / Average food inventory]
Calculation: $181,323 / [($6,128 + $5,915) / 2] = $181,323 / ($12,043 / 2)
78
1. The 4C company is incorporated and any payments to Mr. Driver for services are
2. Comments on specific ratios of the 4C Company that may be considered unsatisfactory
are identified and discussed in the following comments:
i. The quick ratio of 0.90:1 is unsatisfactory. Since inventories for resale that are
19.5 days. This ratio should be around 24 times per year with an average collection
period of 15 days. Without information this ratio should be investigated.
iv. The food turnover ratio of 30.1 times per year indicates on average the inventory is
3. Assuming $20,000 of stock was purchased back by the 4C Company, the following are
recalculated: Changes in working capital, net return on assets, and the return on
stockholders’ equity.
79
iii. New net return on assets: [Net income after tax / Total average assets]
Calculation: $34,342 / $248,580 = 13.8%
iv. Return on Stockholders’ equity: [NI after tax / Average stockholders’ equity]