57
CHAPTER 4
RATIO ANALYSIS
INTRODUCTION
This chapter could be considered a continuation of Chapter 3, although Chapter 3 is not
necessarily a prerequisite for ratio analysis. However, to have a good comprehension of the
information provided by ratio analysis, the student should have a good understanding of basic
accounting, and in particular its application to the hospitality industry. Therefore, Chapters 1 and
2 should be studied, or assigned for self study, as a prerequisite to this chapter.
TRUE OR FALSE QUESTIONS
(Correct answer indicated by T for True answers and F for False answers)
1. A percentage is a type of ratio.
T
2. The best method of comparing a ratio is with a predetermined standard or base figure.
T
3. The three major users of ratios are management, creditors, and owners of the
business.
T
4. Certain current liquidity ratios are indicative of effective working capital manage–
ment.
T
5. Current liabilities divided by current assets gives the current ratio.
F
6. In a hotel, the current ratio is normally higher than 2 to 1.
F
7. One of the useful current liquidity ratios is known as window dressing.
F
8. The quick ratio is the same as the current ratio except that, in the quick ratio, the
accounts receivable are not included in the current assets.
F
9. The accounts receivable turnover for a given period is calculated by dividing the total
accounts receivable credit sales revenue by the average accounts receivable.
T
10. The accounts receivable average collection period is calculated by dividing 365 by the
annual accounts receivable turnover ratio.
T
11. Net worth is total tangible assets less total liabilities.
T
12. The total liabilities to total equity ratio is one of several long-term solvency ratios.
T
13. Asset shrinkage occurs when the value of assets declines during bankruptcy.
T
14. Calculating long-term solvency ratios using assets at their book value, rather than fair
market value, can be misleading.
T
15. Creditors of a company prefer to see a high, rather than a low, debt to equity ratio.
F
16. High financial leverage is indicated by a low debt to equity ratio.
F
17. A company may have a net income without being profitable.
T
18. The net return on assets is calculated by dividing income before interest and income
tax by total average assets.
F
58
19. The number of times interest is earned ratio indicates a company’s ability to meet its
interest payments as they fall due.
T
20. A company is presently earning 8% return on its assets. The company wishes to
borrow funds from its stockholders for expansion, guaranteeing them a 10 percent
dividend rate. The stockholders should be eager to lend the money to the company.
F
21. The net income to sales revenue ratio is also known as the gross margin.
F
22. Earnings per share is calculated by dividing the average number of shares outstanding
into net income.
T
23. The price earnings ratio is calculated by dividing earnings per share by market price
per share.
F
24. Food inventory turnover is calculated by dividing average food inventory during the
period by cost of food sales for the period.
F
25. Beverage inventory turnover is usually between 6 and 12 times a year.
F
26. The fixed asset turnover ratio is usually higher for a hotel than for a restaurant.
F
27. Analysis tools, when used properly, can indicate that a problem exists and offer the
solution to that problem.
F
28. Seat turnover in a restaurant is calculated by dividing the number of seats by the
number of guests served during a meal period.
F
29. The lowering of dining room standards of service could be indicated by a declining
seat turnover figure.
T
30. Annual sales revenue per restaurant seat is calculated by dividing total annual sales
revenue by the number of seats in the restaurant.
T
31. The comparison of percentage of beverage sales revenue to food sales revenue in a
restaurant has no value.
F
32. Daily average room rate is calculated by dividing monthly sales revenue by the
number of days in the month, times the number of rooms available.
T
33. The average room rate is not affected by the rate of double occupancy.
F
34. The number of rooms cleaned per housekeeper per day is a type of productivity
measure.
T
35. The manager’s daily report is primarily concerned with information from the
balance sheet.
F
36. As long as an establishment carries out comprehensive internal analysis of its
operations, external comparisons can be ignored.
F
37. Many of the ratios available and useful in ratio analysis can be affected by whether
the assets are owned or leased.
T
38. A high debt to equity ratio usually reduces the risk to the stockholders.
F
59
MULTIPLE CHOICE QUESTIONS
(correct answer indicated by asterisk)
1. One method of comparing a ratio is with an industry average. Three other methods are:
(a) Percentages, turnovers, and results from previous periods
(b) Percentages, results from previous periods, and a competitor’s figures
2. A current ratio of 2 to 1 means that:
(c) The odds are two to one that the company will not be able to pay off its short-term debts
(d) The company will take twice as long as normal to pay what it owes
3. The three major users of ratios are:
(c) Supervisors, department heads, and managers
(d) Lenders, creditors, and investors
4. Window dressing means:
(a) The reduction of current assets to bring them more into line with current liabilities
(b) The use of current assets to pay off long-term liabilities
5. A company has cash $1,400, accounts receivable $2,100, marketable securities $4,000,
inventory $1,200, accounts payable $4,700, accrued expenses $500, and common stock
$1,000. Its quick ratio is:
(a) 1.39:1
6. Accounts receivable turnover is:
(c) Calculated by dividing total sales revenue for a year by 365
(d) The average number of days that accounts receivable is outstanding
7. The debt to equity ratio is:
(a) Total assets divided by total liabilities
(b) Total long-term liabilities divided by total fixed assets
60
8. A debt to equity ratio of 1.75 means there is:
(c) $1.75 of equity for each $1.00 of debt
(d) $0.75 of equity for each $1.00 of debt
9. Net return on assets is calculated by dividing:
(a) Income after interest but before income tax by total average assets
(b) Net income into total average assets
10. A company’s sales revenue for the year is $1,000,000 and income before tax $100,000. Tax
rate is 50%. Average total assets are $750,000. Average stockholders’ equity is $250,000.
(c) 5.0%
(d) 6.7 %
11. The net income to sales revenue ratio is also known as the:
(a) Sales ratio
(b) Profit turnover
12. The credit card receivables turnover ratio is:
(a) The average collection period divided by 365
(b) The average credit card receivables divided by credit card sales revenue
(c) Dividing earnings per share by the market price per share
(d) Dividing prices by sales revenue
(c) Average inventory during the period divided by cost of sales for the period
(d) Beginning inventory plus ending inventory divided by two
15. A restaurant with a monthly food inventory turnover of 4.0 would find that its food inventory
is turning over:
(c) Once every four weeks
(d) Four times as fast as its beverage inventory
61
16. Ratio analysis is most favorable for an individual restaurant when:
(a) The restaurant’s figures are higher than the industry averages
17. Restaurant seat turnover is calculated by dividing:
(a) Customers served during the year by 365
(b) Sales revenue for a period by the average check for that period
18. Double occupancy is:
(c) The result of a desk clerk reserving the same room for two different people on the same
night
(d) Only desirable if the hotel has a low general occupancy rate
19. Sales revenue per available room can be calculated by:
(a) Dividing the occupancy percentage by average room rate
(b) Dividing the average room rate by occupancy percentage
20. Financial leverage is:
(a) The use of equity rather than debt to improve return on owners’ equity
(b) A method of decreasing the debt to equity ratio
62
EXERCISE SOLUTIONS
E4.1 Calculate the current and quick ratios.
a. Current ratio: [CA / CL]
CA = $11,200 + $808 + $260 + $4,482 + $1,220 = $17,970
E4.2 Calculate working capital using E4.1 Information.
CA = $11,200 + $808 + $260 + $4,482 + $1,220 = $17,970
E4.3 Calculate average credit card receivables and the percentage of credit card receivables
of total credit sales revenue.
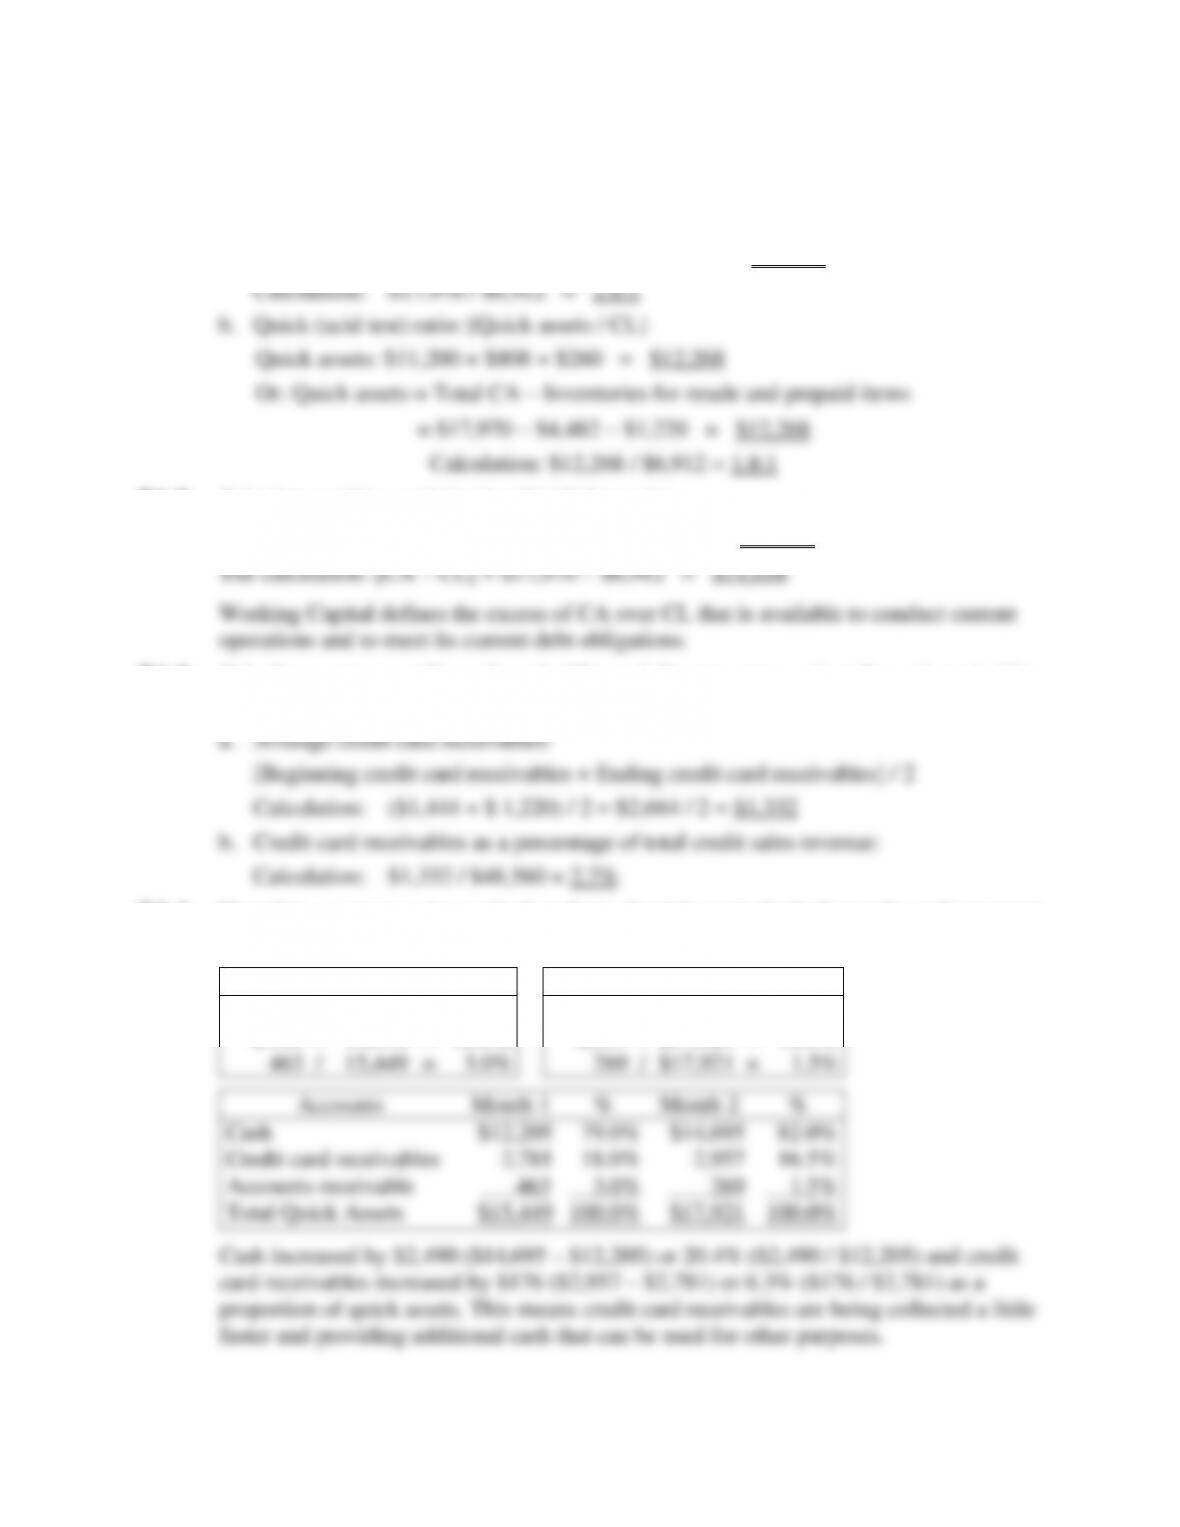
E4.4 Complete a common-size vertical analysis of quick assets for both months and comment
on the changes to quick assets.
Month 1
%
Month 2
%
$12,205
/
$15,449
=
79.0%
$14,695
/
$17,921
=
82.0%
2,781
/
15,449
=
18.0%
2,957
/
$17,921
=
16.5%
463
/
15,449
=
3.0%
269
/
$17,921
=
1.5%
Accounts
Month 1
%
Month 2
%
Cash
$12,205
79.0%
$14,695
82.0%
Credit card receivables
2,781
18.0%
2,957
16.5%
Accounts receivable
463
3.0%
269
1.5%
Total Quick Assets
$15,449
100.0%
$17,921
100.0%
Cash increased by $2,490 ($14,695 – $12,205) or 20.4% ($2,490 / $12,205) and credit
card receivables increased by $176 ($2,957 – $2,781) or 6.3% ($176 / $2,781) as a
proportion of quick assets. This means credit card receivables are being collected a little
faster and providing additional cash that can be used for other purposes.
63
E4.5 Calculate working capital and define its structure and purpose.
Working Capital = [CA – CL] = $87,200 – $64,400 = $22,800
Structure: Working capital indicates the excess of current assets to current liabilities that
is available to conduct current daily operations. When current assets are less than
E4.6 You are given the working capital at the end of two consecutive years: Year 1 was
$20,800 and Year 2 is $30,520. Sales revenue for Year 2 is $1,078,444. Calculate the
working capital turnover ratio. Sales revenue / Average working capital
E4.7 Calculate food inventory turnover ratio and the average food inventory holding period in
days that it takes the food inventory to turnover.
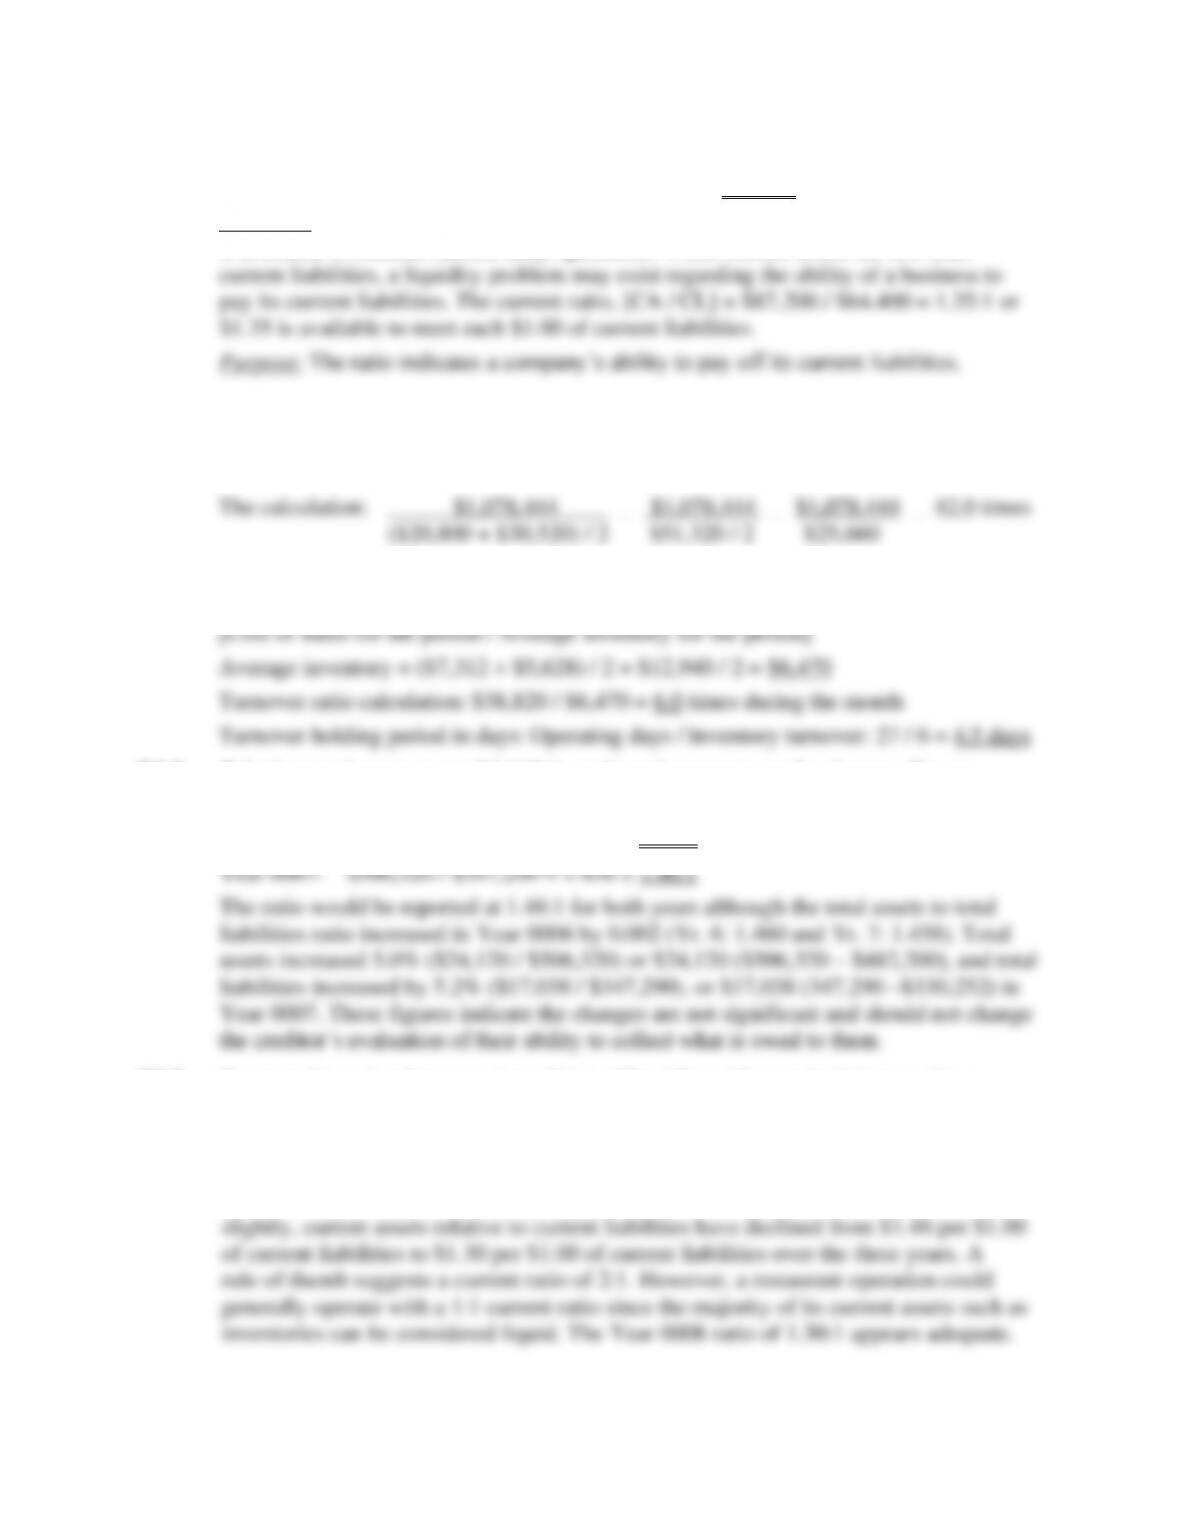
E4.8 Calculate total assets to total liabilities ratio and comment on the changes. Do any
additional analysis you need so you can comment on these figures.
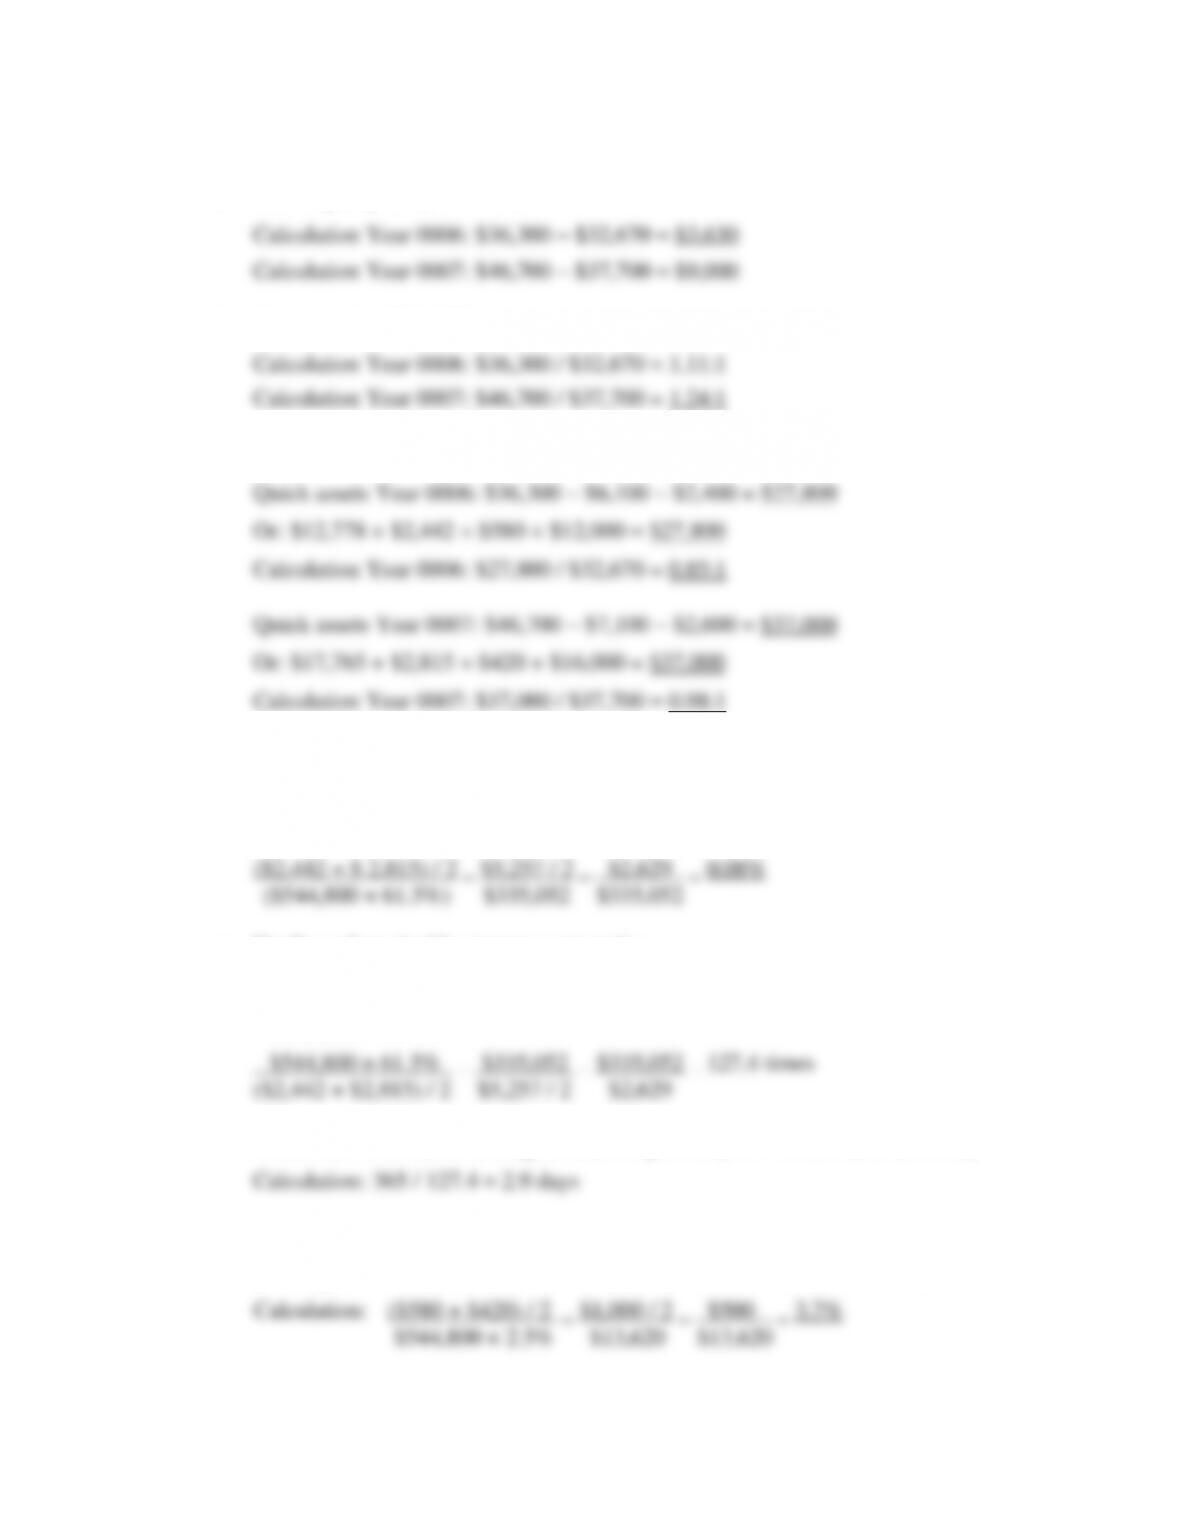
Year 0006: $482,200 / $330,252 = 1.460 1.46:1
E4.9 Can you determine the general condition of liquidity without calculating working
capital? If the following ratios apply to a restaurant, would the ratio for Year 0008 be
considered adequate?
The current ratios for the 3 years indicate a steady decline in liquidity, and it’s
not necessary to calculate working capital. While working capital has changed only
64
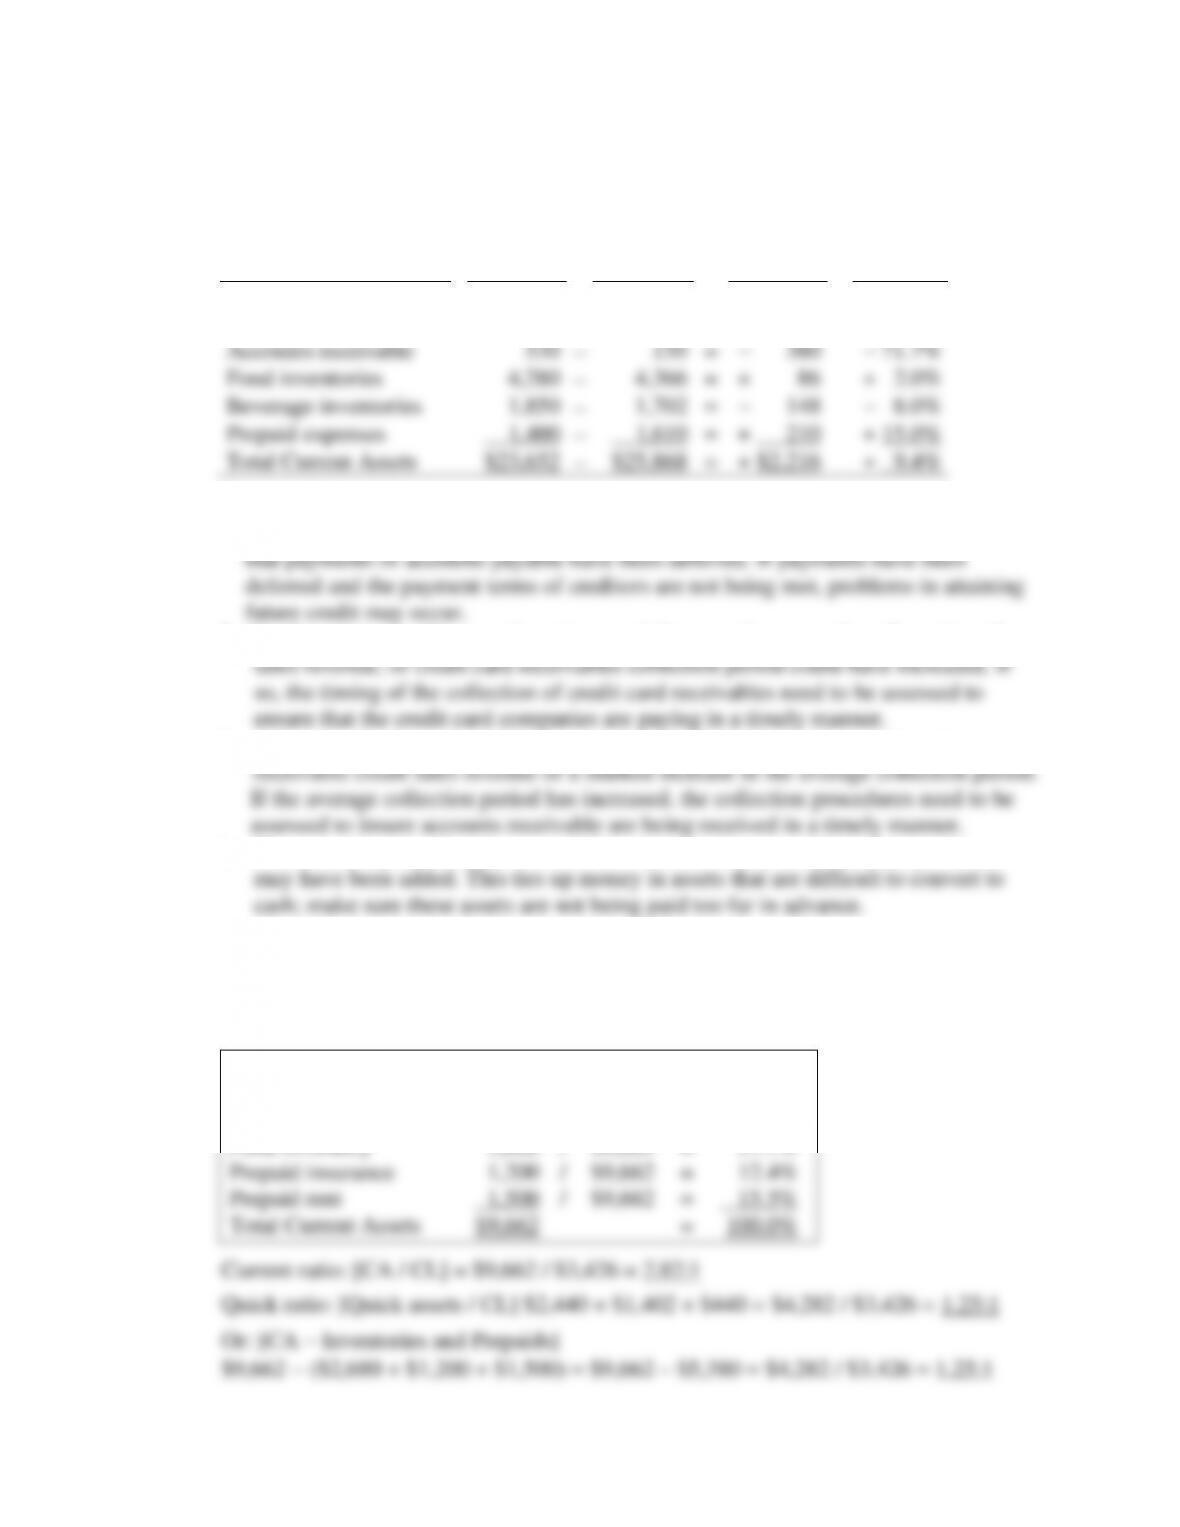
E4.10 Complete a comparative horizontal analysis of the change in each current asset.
Comment on the change if it exceeds 10%. What, if anything, would you do as a
manager?
Dollar
Change
Current Assets
Yr. 0006
−
Yr. 0007
=
Change
%
Cash
$12,892
−
$14,580
=
+ $1,688
+ 13.1%
Credit card receivables
2,700
−
3,460
=
+ 760
+ 28.1%
Accounts receivable
530
−
150
=
– 380
– 71.7%
Food inventories
4,280
−
4,366
=
+ 86
+ 2.0%
Beverage inventories
1,850
−
1,702
=
– 148
– 8.0%
Prepaid expenses
1,400
−
1,610
=
+ 210
+ 15.0%
Total Current Assets
$23,652
−
$25,868
=
+ $2,216
+ 9.4%
Comments:
1. Cash may have changed due to an increase in cash sales revenue. It is also possible
2. Credit card receivables may have increased due to an increase of credit card credit
3. A decrease in accounts receivable may have resulted from a decrease in accounts
4. The cost of a prepaid expense could have increased or an additional prepaid item
PROBLEM SOLUTIONS
P4.1 Complete a common-size vertical analysis of current assets and calculate a current
and quick ratio. Total current liabilities are $3,426.
Cash
$2,440
/
$9,662
=
25.3%
Credit card receivables
1,402
/
$9,662
=
14.5%
Accounts receivable
440
/
$9,662
=
4.6%
Food inventory
2,680
/
$9,662
=
27.7%
Prepaid insurance
1,200
/
$9,662
=
12.4%
Prepaid rent
1,500
/
$9,662
=
15.5%
Total Current Assets
$9,662
=
100.0%
Current ratio: [CA / CL] = $9,662 / $3,426 = 2.82:1
Quick ratio: [Quick assets / CL] $2,440 + $1,402 + $440 = $4,282 / $3,426 = 1.25:1
Or: [CA − Inventories and Prepaids]
$9,662 − ($2,680 + $1,200 + $1,500) = $9,662 – $5,380 = $4,282 / $3,426 = 1.25:1
65
P4.2 a. Working Capital: [CA – CL]
b. Current ratio: [CA / CL]
c. Quick (acid test) ratio: [Quick assets / Current Liabilities]
d. Credit card receivables as a percentage of credit card sales revenue:
[Average credit card receivables / Credit card sales revenue]
Calculation Year 0007:
e. Credit card receivables turnover rate ratio:
[Credit card sales revenue / Average credit card receivables]
Calculation Year 0007:
f. Credit card receivables average collection period: [365 / Credit card turnover]
g. Accounts receivable as a percentage of accounts receivable credit sales revenue:
[Average accounts receivable / Accounts receivable credit sales revenue]
66
h. Accounts receivable turnover ratio: [AR credit sales revenue / Average AR]
i. Accounts receivable average collection period: 365 / Accounts receivable turnover
k. Comment on what these ratios tell you about the restaurant.
For the Year 0007, the restaurant has cash sales revenue of 36% or $196,128 and
credit sales revenue of $378,636. Credit card sales revenue was 61.5% or $335,052
and credit card receivables as a percentage of credit card sales revenue is 0.08% and
credit card receivables are collected on the average of every 2.9 days which is
acceptable. Accounts receivable credit sales revenue was 2.5% or $13,620 and
industry standards which currently ranges from 29% to 37%.
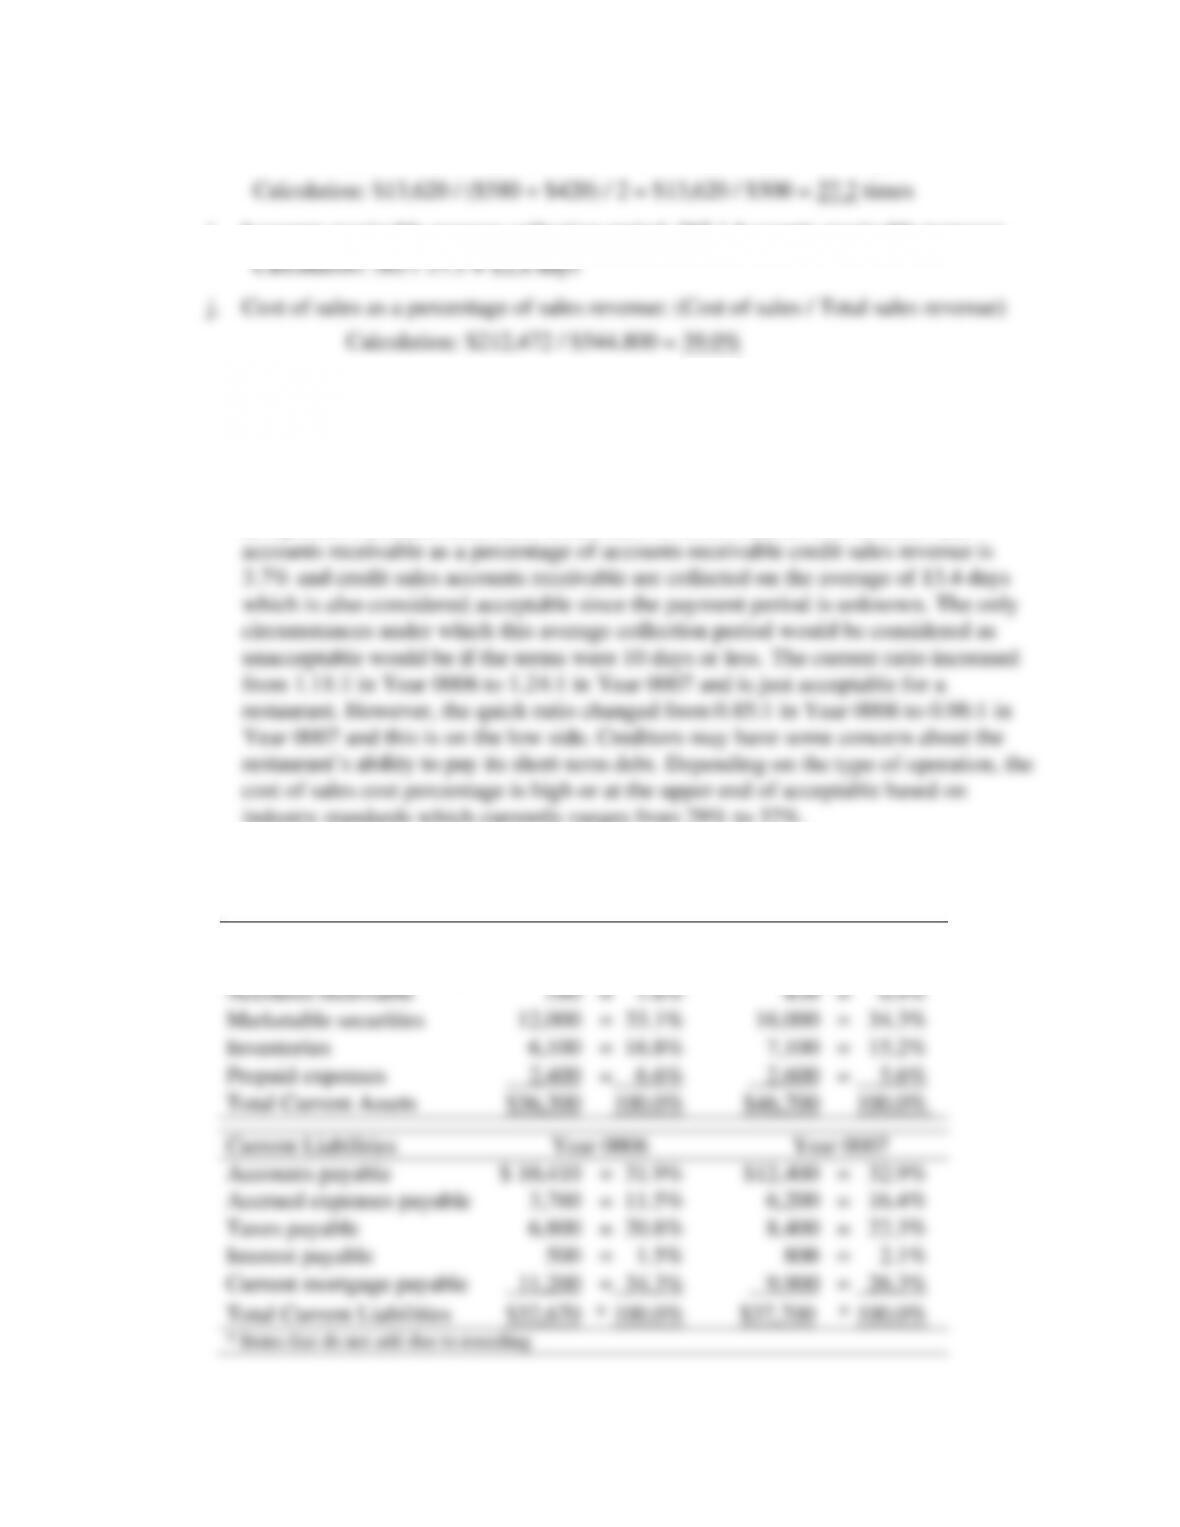
P4.3 Complete a common-size vertical analysis of CA and CL from P4.2.
Current Assets
Year 0006
Year 0007
Cash
$12,778
= 35.2%
$17,765
= 38.0%
Credit card receivables
2,442
= 6.7%
2,815
= 6.0%
Accounts receivable
580
= 1.6%
420
= 0.9%
Marketable securities
12,000
= 33.1%
16,000
= 34.3%
Inventories
6,100
= 16.8%
7,100
= 15.2%
Prepaid expenses
2,400
= 6.6%
2,600
= 5.6%
Total Current Assets
$36,300
100.0%
$46,700
100.0%
Current Liabilities
Year 0006
Year 0007
Accounts payable
$ 10,410
= 31.9%
$12,400
= 32.9%
Accrued expenses payable
3,760
= 11.5%
6,200
= 16.4%
Taxes payable
6,800
= 20.8%
8,400
= 22.3%
Interest payable
500
= 1.5%
800
= 2.1%
Current mortgage payable
11,200
= 34.3%
9,900
= 26.3%
Total Current Liabilities
$32,670
* 100.0%
$37,700
* 100.0%
* Items that do not add due to rounding
67
Discussion:
Current Assets: Cash increased as did marketable securities over the operating year from
Years 0006 to 0007. The total of cash and marketable securities was 68.3% (35.2% +
reviewed. Prepaid expenses have also increased slightly, indicating a possible increase
of an existing prepaid or the acquisition of a new prepaid.
Current Liabilities: In both absolute and percentage terms, all payables increased
slightly and only the current mortgage payable decreased over the year. Overall, the
P4.4 Using limited information to reconstruct a balance sheet.
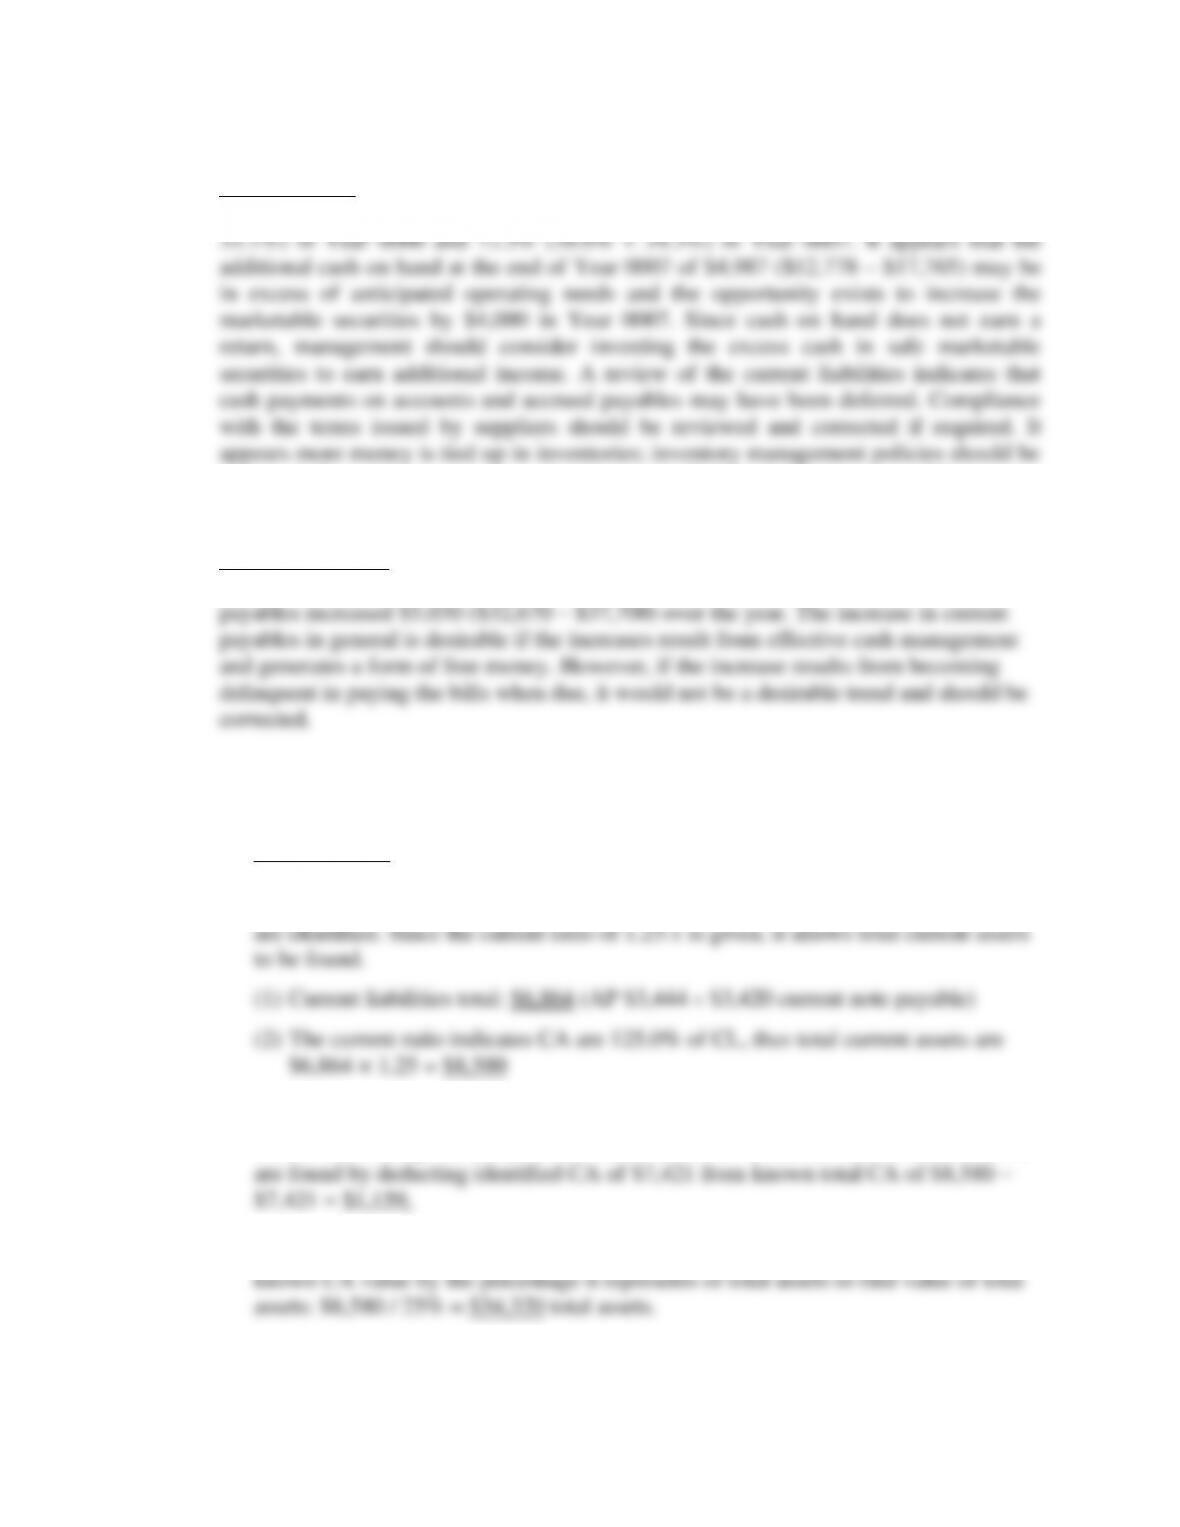
a. Current assets: Reliance on the known current ratio and the relation of current assets
to total assets is the key that will allow all unknown current assets, fixed assets and
total assets to be identified. Not all current assets are identified, but current liabilities
b. Since current assets (CA) have been calculated as $8,580: Cash ($976 + $1,500) =
$2,476 and ending inventory is $4,945, for a total of $7,421, credit card receivables
c. Knowing CA are 25% of total assets, total assets can be found by dividing the
68
d. With CA and total assets identified, we can identify fixed assets by deducting CA
from total assets: ($34,320 − $8,580) = Fixed assets of $25,740.
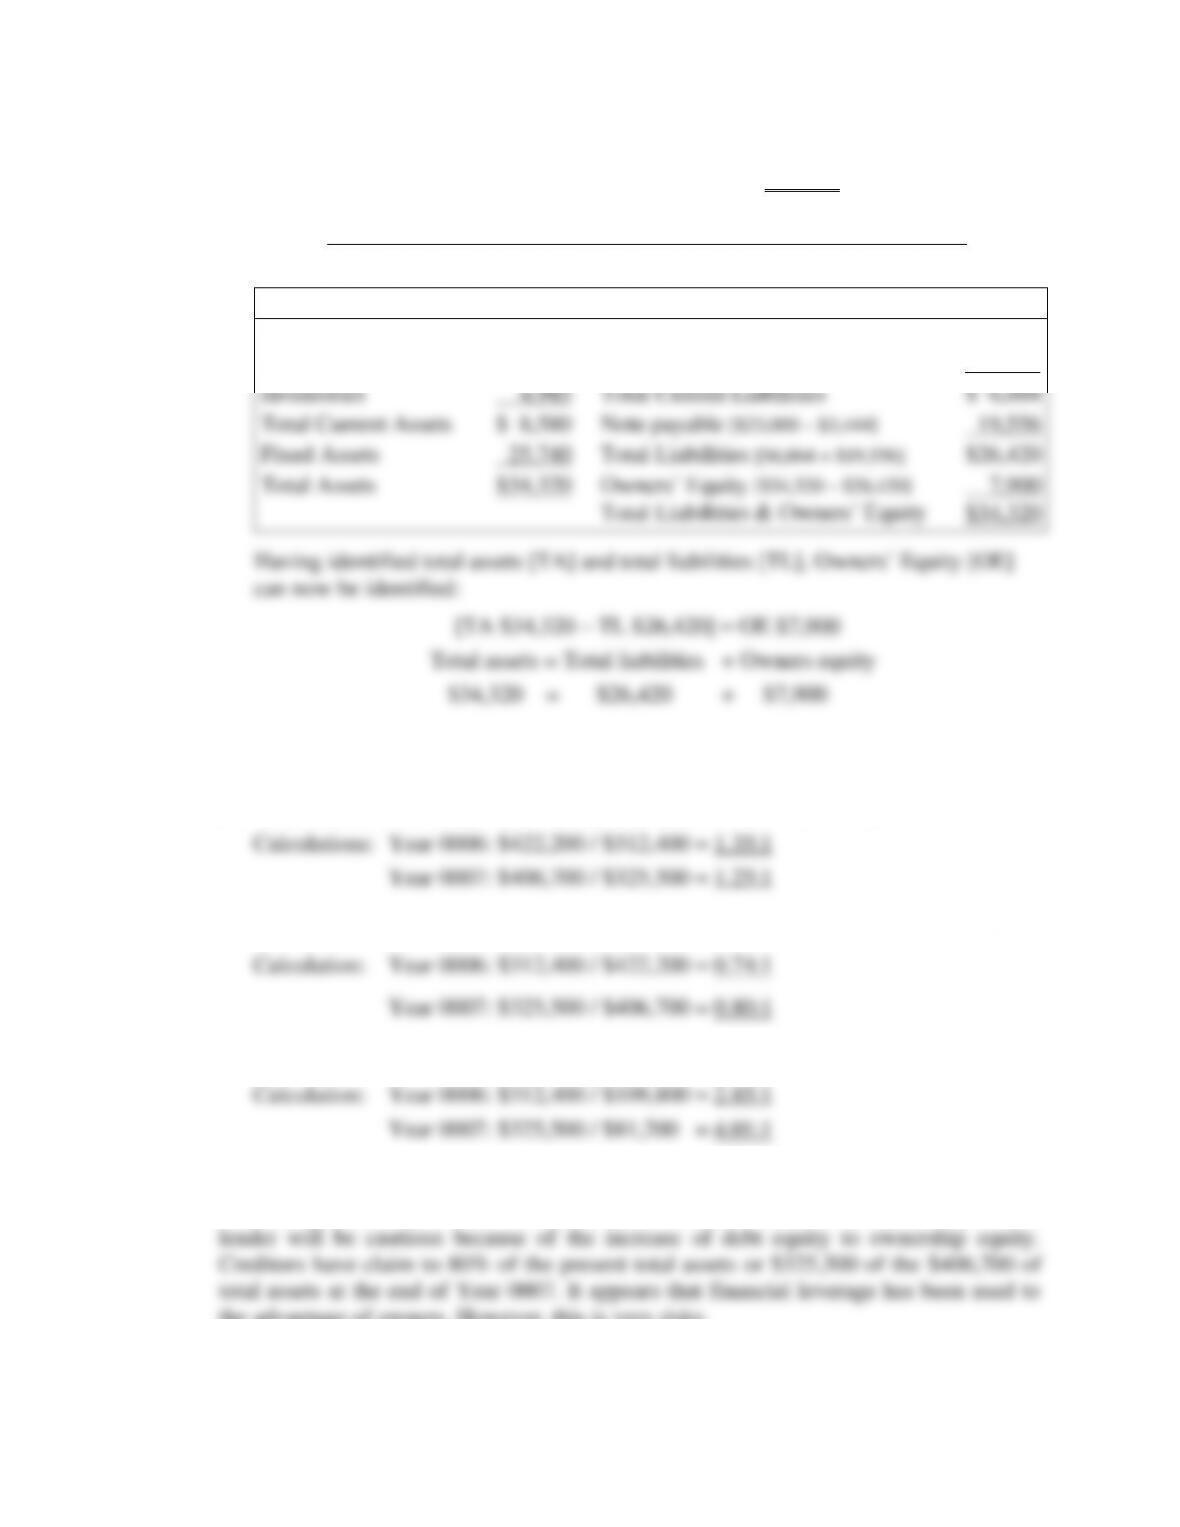
With all information identified, a balance sheet can now be prepared.
Balance Sheet December 31, Year 0007
Assets
Liabilities & Owners Equity
Cash [$976 + $1,500]
$ 2,476
Accounts payable
$ 3,420
Credit card receivables
1,159
Current note payable
3,444
Inventories
4,945
Total Current Liabilities
$ 6,864
Total Current Assets
$ 8,580
Note payable [$23,000 – $3,444]
19,556
Fixed Assets
25,740
Total Liabilities [$6,864 + $19,556]
$26,420
Total Assets
$34,320
Owners’ Equity [$34,320 – $26,420]
7,900
Total Liabilities & Owners’ Equity
$34,320
Having identified total assets [TA] and total liabilities [TL], Owners’ Equity [OE]
can now be identified:
[TA $34,320 – TL $26,420] = OE $7,900
Total assets = Total liabilities + Owners equity
$34,320 = $26,420 + $7,900
P4.5 Calculate the ratios from information provided.
a. Total assets to Total liabilities ratio: [Total assets / Total liabilities]
b. Total liabilities to Total assets ratio: [Total liabilities / Total assets]
c. Total liabilities to Total equity ratio: [Total liabilities / Total Stockholders’ equity]
Discussion: These ratios show an undesirable trend from the stockholders’ and
creditors’ point of view. Debit increased by 1.16 (4.01 − 2.85) in one year. A potential
the advantage of owners. However, this is very risky