CHAPTER 3
ANALYSIS AND INTERPRETATION OF
FINANCIAL STATEMENTS
INTRODUCTION
Before financial statements can be analyzed, the reader must have a good grasp of the way
different statements are prepared. It is extremely beneficial to have a firm conceptual under–
standing of basic accounting and the accounting terminology used by hospitality industry firms.
For this reason, Chapters 1 and 2 should be reviewed or studied, as a prerequisite to this chapter
on analysis and interpretation of information presented by balance sheets and income statements.
TRUE OR FALSE QUESTIONS
(Correct answer indicated by T for True answers and F for False answers)
1. Various readers of financial statements will generally analyze them in different ways.
T
2. Comparative horizontal balance sheet analysis shows each individual account, subtotal
and total balance changes from one balance sheet date to the next. Changes are
described in both dollars and percentages.
T
3. Comparison of periodic balance sheets is useful for controlling the day-to-day
operations of a business.
F
4. In doing comparative horizontal analysis, the two terms used to describe changes from
one period to the next are absolute changes for percent differences, and relative
changes for dollar differences.
F
5. Common-size vertical income statements show each expense item as a percent of total
sales revenue.
T
6. The average check is calculated by dividing the number of customers served during a
period by the sales revenue for that period.
F
7. All other things being equal, it would be preferable to serve 4,000 guests each spending
$2.50, than 4,200 guests each spending $2.40.
F
8. If a net income of $825 was made at a banquet and 750 customers were served,
average net income per guest would be $1.10.
T
9. An analysis of trend results over time is usually more useful than looking at the results
for two consecutive periods only.
T
10. Trend results are often useful in forecasting future results.
T
11. A trend index for several periods usually assigns the current period figure the value of
100.
F
12. A trend index shows sales revenue has increased from Year 1 to Year 4 by 63%.
During the same period the accounts receivable trend index shows an increase of 75%.
This would normally be a desirable trend.
F
13. Comparison of operating results in times of inflation can be done quite easily without
adjusting for the effects of inflation.
F
38
14. To convert historic dollars to current dollars one multiplies historic dollars by the trend
index number for the historic period and then divides that result by the trend index
number for the current period.
F
15. Year 1 sales revenue is $240,000, and its trend index number is 120. Year 5 sales
revenue (current year) is $360,000 and its trend index number is 150. Year 1 sales
revenue converted to current dollars is $300,000.
T
16. An establishment can use internally generated information to produce its own series of
trend index numbers.
T
17. The calculation of percentage change figures for specific income statement items when
viewed over multiple periods can identify the direction in which a business is going.
T
18. Vertical analysis and trends analysis are similar forms used to conduct financial
statements analysis.
F
MULTIPLE CHOICE QUESTIONS
(Correct answer indicated by asterisk)
1. Financial statement analysis is carried out by:
(c) Management for the use of the tax department.
(d) Stockholders for the use of management.
2. Comparative horizontal balance sheets show the:
(a) Change in individual account balances in dollars from one period to the next.
(b) Change in individual account balances in percentage terms from one period to the next.
3. In doing comparative horizontal analysis:
(c) Total assets are given the value of 100%, and all other assets are expressed relative to
that.
(d) Relative changes show dollar differences and absolute changes show percent differences.
4. Common-size vertical income statements:
(c) Show net income as 100% and express all other items as a percentage of that.
(d) Show the change from last period’s income statement to this period’s in percentage
terms.
39
(c) Sales revenue for a period by the number of guests served during that period and
multiplying by 100.
(d) Annual sales revenue by 365 and multiplying by number of guests served.
6. Average guest check has increased from $12.50 to $14.00. Average operating income per
guest has increased from $1.00 to $1.50. From this information it is obvious that:
(a) Higher prices are driving away customers.
(b) More total net income is being made by the restaurant.
7. Sales revenue in Period 1 is $100,000 and food cost is 40%. Sales revenue in Period 2 is
$104,000 and food cost is 44%. The percent change in food cost percentage from Period 1 to
Period 2 is:
(a) 4%.
(b) $4,400
8. Sales revenue in Period 1 is $3,000 and in Period 2 it is $4,000. The trend index figure for
Period 2 (assuming Period 1 is given the value of 100) will be:
(a) 104.0
(b) 130.0
9. Sales revenue in Year 1 is $120,000 with a trend index number of 110. Sales revenue in Year
2 is $140,000 with a 121 trend index number. Year 1 sales revenue converted to current
dollars is:
(c) $151,000
(d) $110,000
10. A restaurant’s average check in Year 1 is $20.00, in Year 2 is $21.00, and in Year 3 is
$22.00. Using this as a basis, calculate the trend index numbers. The trend index numbers for
the three years respectively, would be:
(a) 120, 121, 122.
40
EXERCISE SOLUTIONS
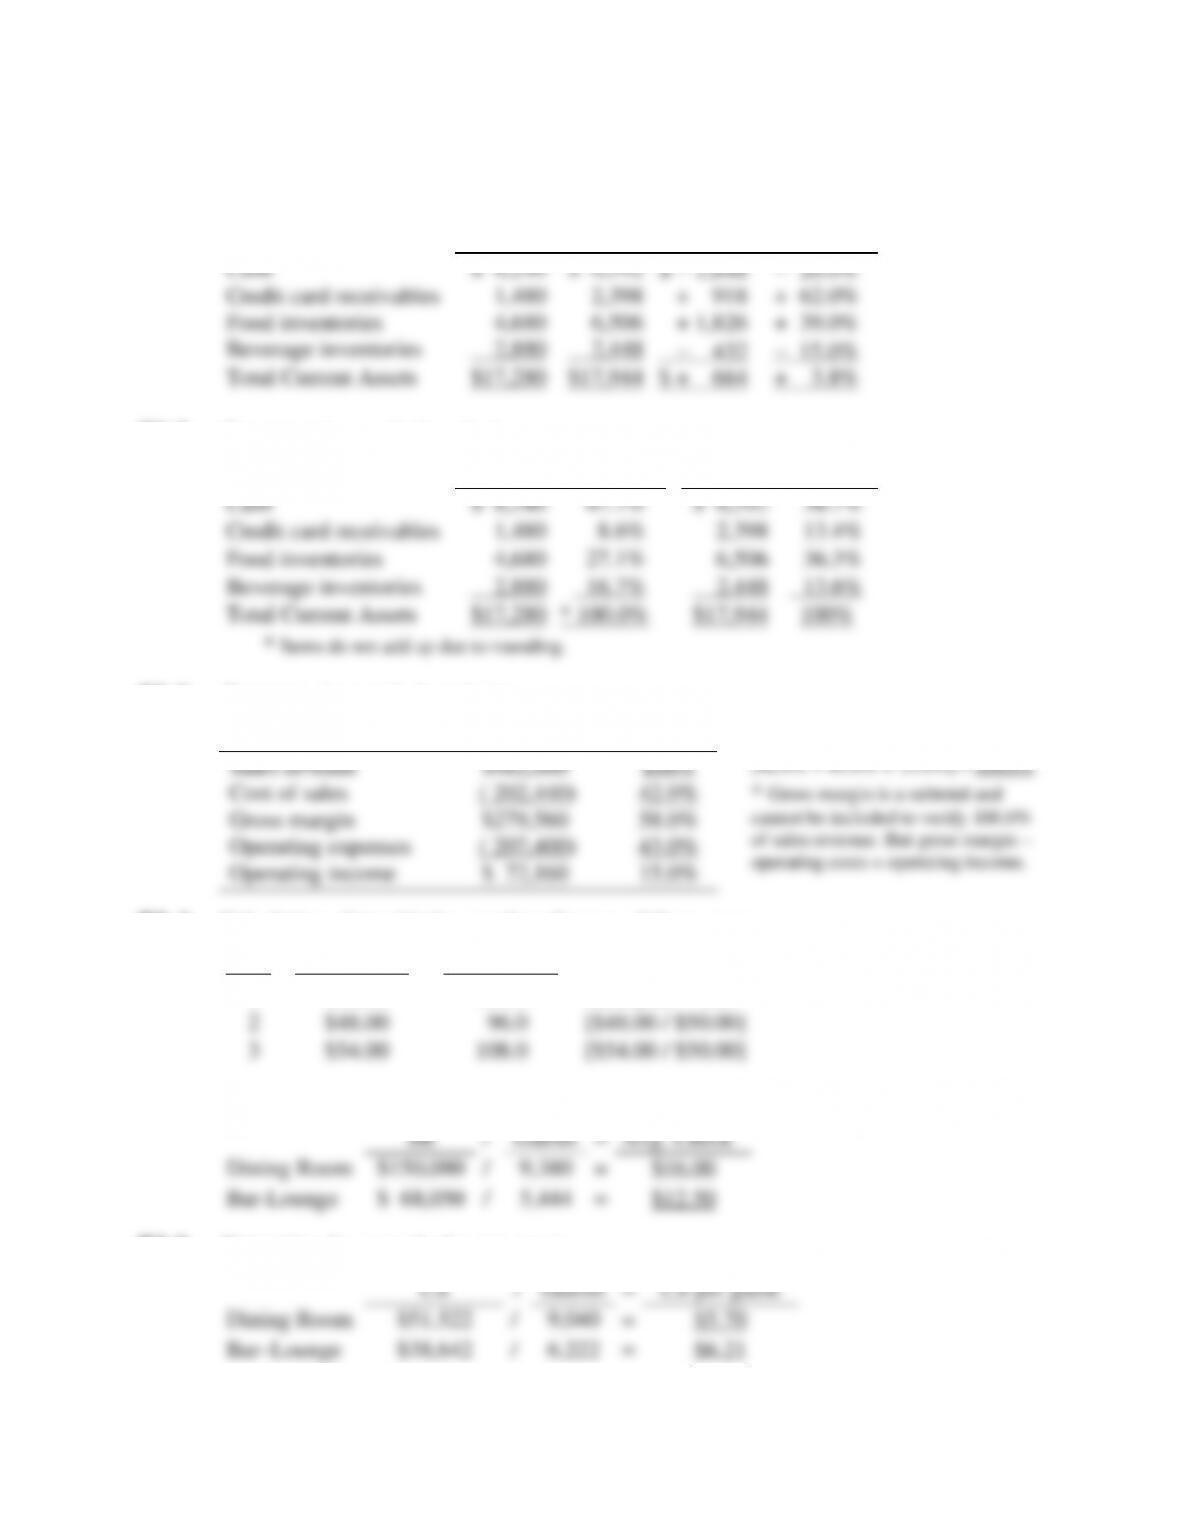
E3.1 Comparative horizontal analysis:
July
August
Change
Change %
Cash
$ 8,240
$ 6,592
$ − 1,648
− 20.0%
Credit card receivables
1,480
2,398
+ 918
+ 62.0%
Food inventories
4,680
6,506
+ 1,826
+ 39.0%
Beverage inventories
2,880
2,448
− 432
− 15.0%
Total Current Assets
$17,280
$17,944
$ + 664
+ 3.8%
E3.2 Common-size vertical analysis:
July
August
Cash
$ 8,240
47.7%
$ 6,592
36.7%
Credit card receivables
1,480
8.6%
2,398
13.4%
Food inventories
4,680
27.1%
6,506
36.3%
Beverage inventories
2,880
16.7%
2,448
13.6%
Total Current Assets
$17,280
* 100.0%
$17,944
100%
* Items do not add up due to rounding.
E3.3 Common-size vertical analysis:
Condensed Income Statement
Sales revenue
$482,000
100%
[42.0% + 43.0% + 15.0%] = 100.0%
Cost of sales
( 202,440)
42.0%
* Gross margin is a subtotal and
cannot be included to verify 100.0%
of sales revenue. But gross margin –
operating costs = operating income.
Gross margin
$279,560
58.0%
Operating expenses
( 207,400)
43.0%
Operating income
$ 72,160
15.0%
E3.4 Calculation of trend index numbers for two of three years.
Year
Room Rates
Trend Index
1
$50.00
100.0
Base year = 100
2
$48.00
96.0
[$48.00 / $50.00]
3
$54.00
108.0
[$54.00 / $50.00]
E3.5 Determine the average check per guest for two sales revenue divisions.
SR
/
Guests
=
Avg. Check
Dining Room
$150,080
/
9,380
=
$16.00
Bar-Lounge
$ 68,050
/
5,444
=
$12.50
E3.6 Determine the cost of sales per guest.
CS
/
Guests
=
CS per guest
Dining Room
$51,522
/
9,040
=
$5.70
Bar–Lounge
$38,642
/
6,222
=
$6.21
41
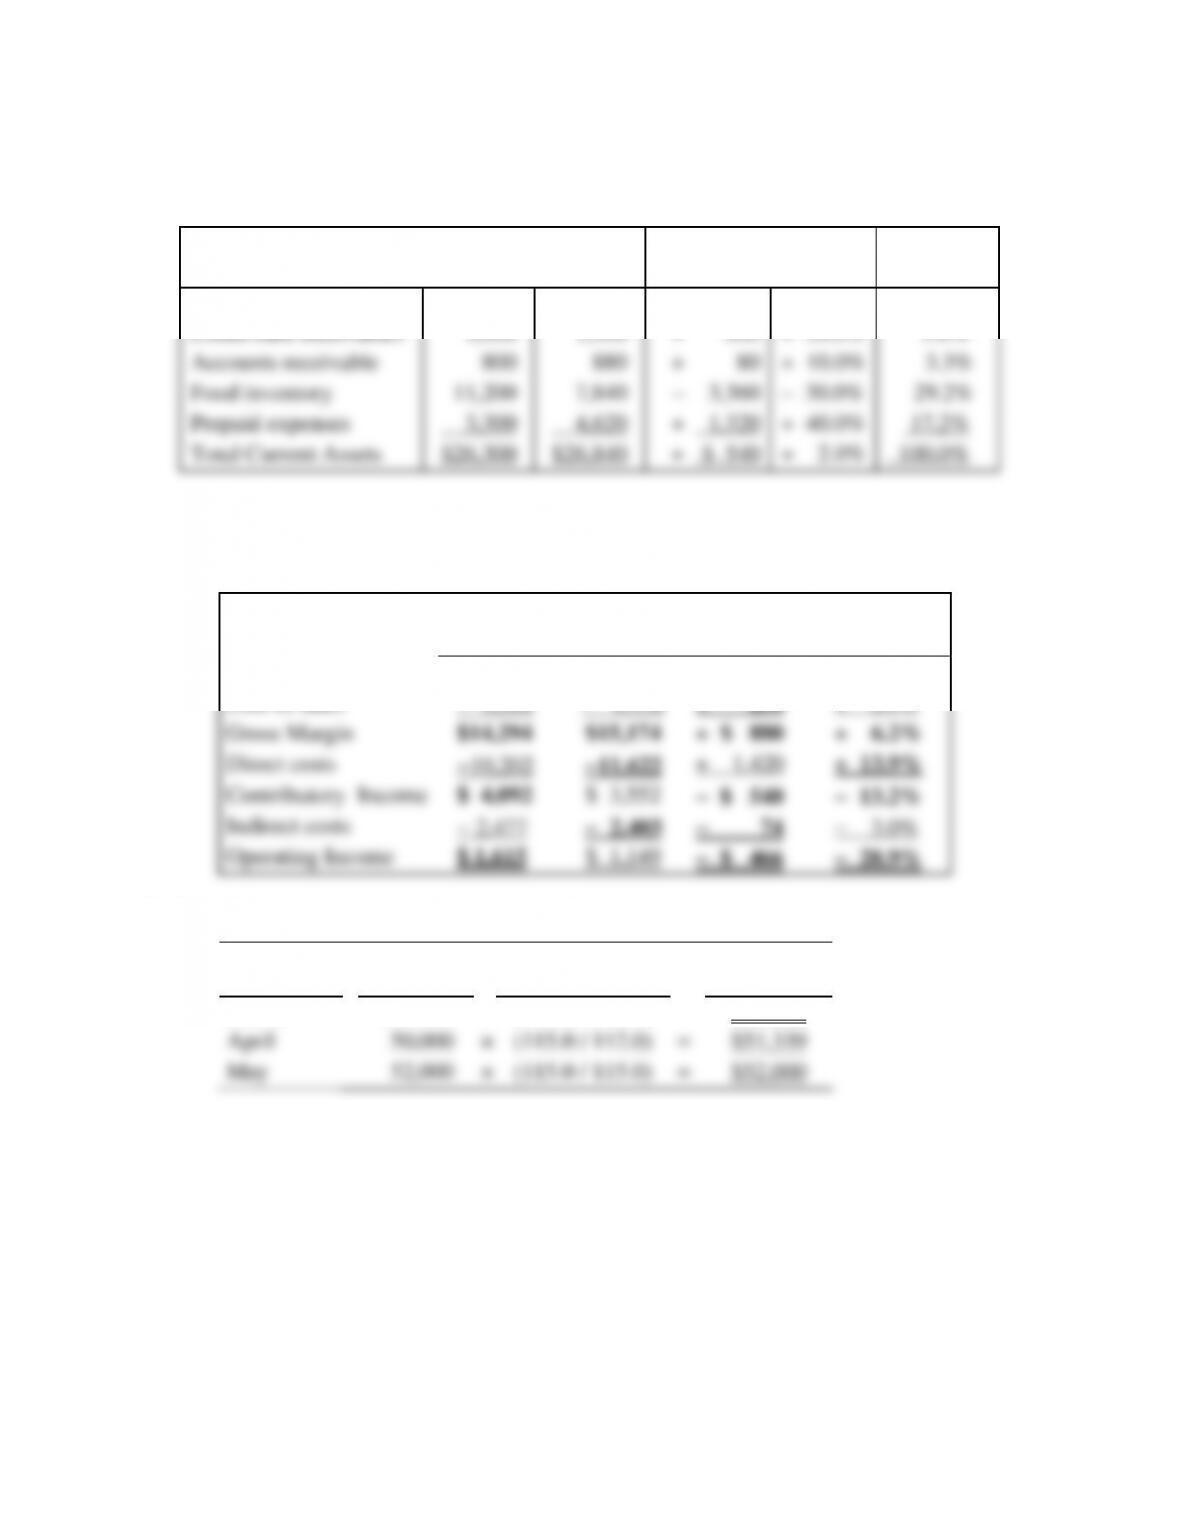
E3.7 Complete a horizontal analysis for Years 0007 to 0008 and a common-sized vertical
analysis for Year 0008.
Horizontal Analysis
Vertical
Current Assets
Yr. 0007
Yr. 0008
▲ Dollars
▲ %
Yr. 0008
Cash
$10,000
$12,000
+ $2,000
+ 20.0%
44.7%
Credit card receivables
1,000
1,500
+ 500
+ 50.0%
5.6%
Accounts receivable
800
880
+ 80
+ 10.0%
3.3%
Food inventory
11,200
7,840
– 3,360
– 30.0%
29.2%
Prepaid expenses
3,300
4,620
+ 1,320
+ 40.0%
17.2%
Total Current Assets
$26,300
$26,840
+ $ 540
+ 2.0%
100.0%
E3.8 Complete comparative horizontal statement analysis. Determine the missing dollar
values and the missing percentages; show the plus (+) or negative (–) effects.
Changes
Year 0007
Year 0008
Dollars
Percentage
Sales Revenue
$23,502
$24,612
+ $1,110
+ 4.7%
Cost of sales
− 9,208
− 9,438
+ 230
+ 2.5%
Gross Margin
$14,294
$15,174
+ $ 880
+ 6.2%
Direct costs
−10,202
−11,622
+ 1,420
+ 13.9%
Contributory Income
$ 4,092
$ 3,552
− $ 540
− 13.2%
Indirect costs
− 2,477
− 2,403
− 74
− 3.0%
Operating Income
$ 1,615
$ 1,149
− $ 466
− 28.9%
E3.9 Convert historic dollars to current dollars.
Year 0007
Month
Sales
Revenue
×
Conversion
=
Current
Dollars
March
$48,000
×
(115.0 / 110.0)
=
$50,182
April
50,000
×
(115.0 / 112.0)
=
$51,339
May
52,000
×
(115.0 / 115.0)
=
$52,000
42
PROBLEM SOLUTIONS
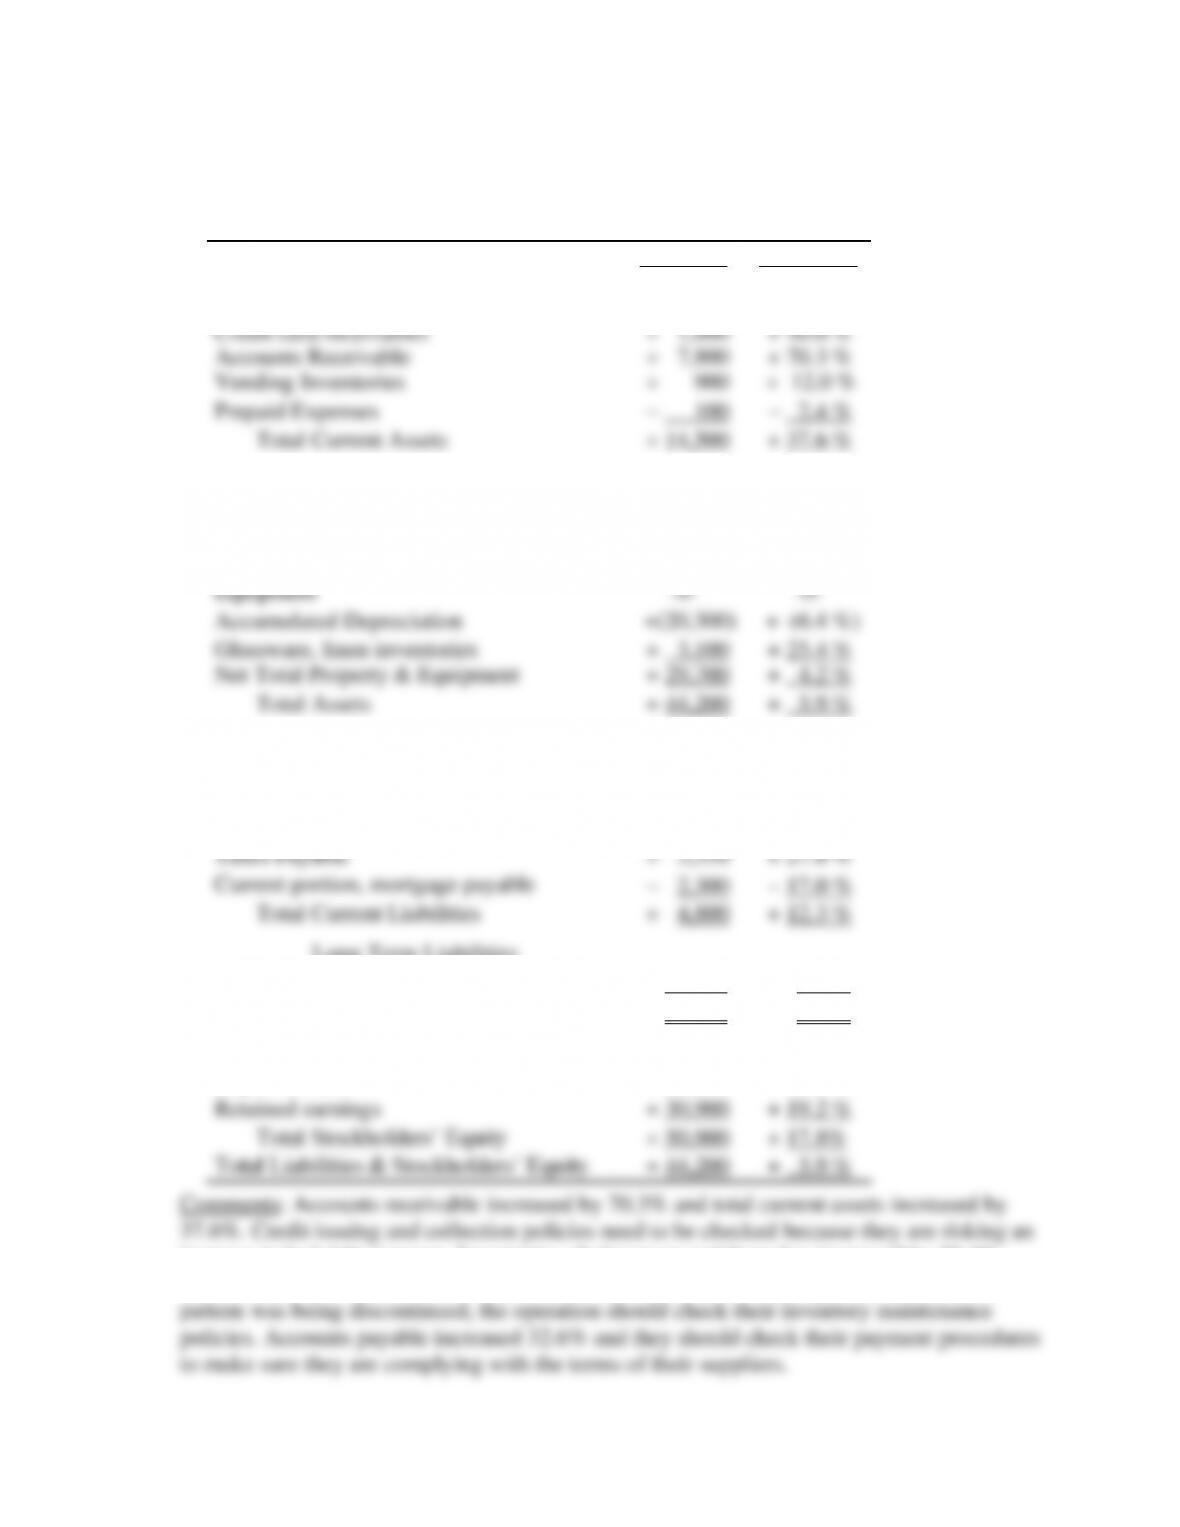
P3.1 Complete a comparative horizontal analysis of balance sheets for Years 0007 – 0008.
Comparative horizontal Analysis Year 0007 Year 0008
Assets
Dollar ▲
Percent ▲
Current Assets
Cash
+ 4,100
+ 36.3 %
Credit card receivables
+ 1,800
+ 40.0 %
Accounts Receivable
+ 7,800
+ 70.3 %
Vending Inventories
+ 900
+ 12.0 %
Prepaid Expenses
– 100
– 2.4 %
Total Current Assets
+ 14,500
+ 37.6 %
Property Plant & Equipment
Land
-0-
-0-
Building
+ 37,200
+ 4.9 %
Furnishings
+ 9,700
+ 11.6 %
Equipment
-0-
-0-
Accumulated Depreciation
+(20,300)
+ (6.4 %)
Glassware, linen inventories
+ 3,100
+ 25.4 %
Net Total Property & Equipment
+ 29,700
+ 4.2 %
Total Assets
+ 44,200
+ 5.9 %
Liabilities & Stockholders’ Equity
Current Liabilities
Accounts Payable
+ 3,000
+ 32.6 %
Accrued Expenses Payable
+ 750
+ 18.1 %
Taxes Payable
+ 3,350
+ 27.6 %
Current portion, mortgage payable
− 2,300
− 17.0 %
Total Current Liabilities
+ 4,800
+ 12.3 %
Long Term Liabilities
Mortgage payable
− 11,500
− 2.7 %
Total Liabilities
− 6,700
− 1.4 %
Stockholders’ Equity
Capital stock
+ 20,000
+ 16.0 %
Retained earnings
+ 30,900
+ 19.2 %
Total Stockholders’ Equity
+ 50,900
+ 17.8%
Total Liabilities & Stockholders’ Equity
+ 44,200
+ 5.9 %
Comments: Accounts receivable increased by 70.3% and total current assets increased by
37.6%. Credit issuing and collection policies need to be checked because they are risking an
increase in bad debt expense. Inventories of glassware and linen has increased by 25.4%.
Unless they recently received a shipment or had to purchase a large quantity because the
43
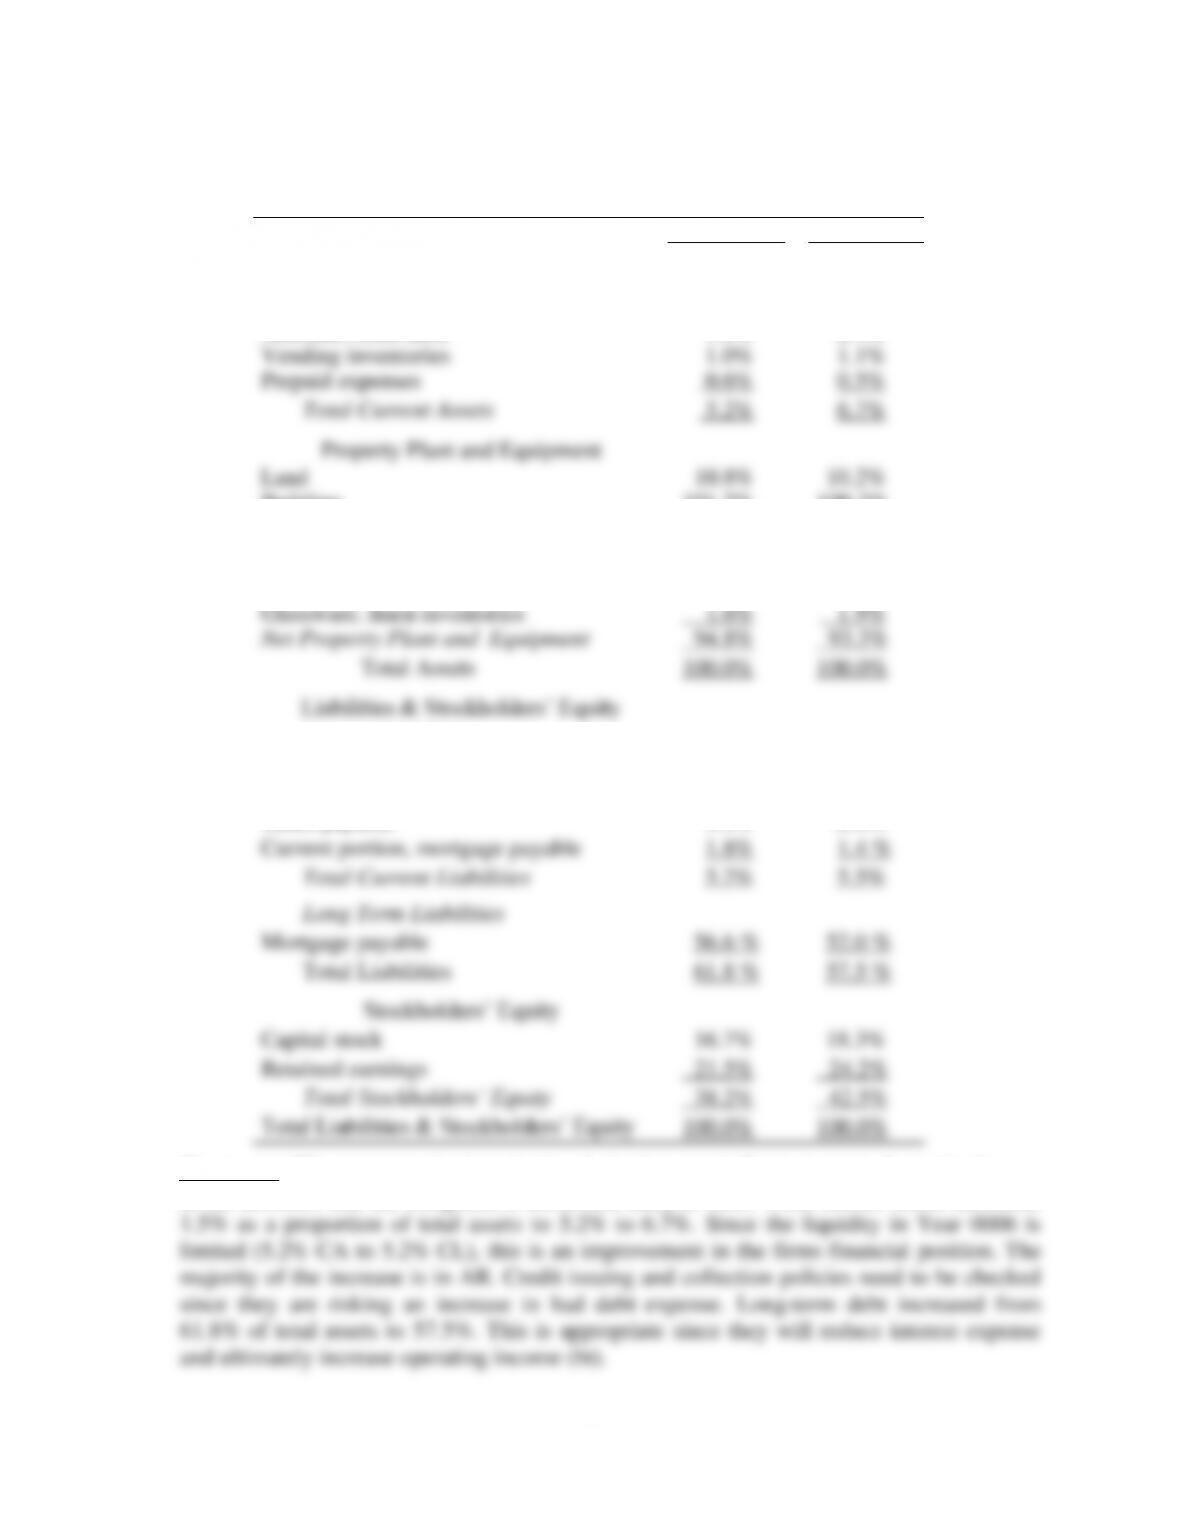
P3.2 Calculate a common-size vertical analysis of balance sheets for years 0007 – 0008
from P3.1.
Common-Size Vertical Balance Sheet Analysis
Assets
Year 0007
Year 0008
Current Assets
Cash
1.5%
1.9%
Credit card receivables
0.6%
0.8%
Accounts receivable
1.5%
2.4%
Vending inventories
1.0%
1.1%
Prepaid expenses
0.6%
0.5%
Total Current Assets
5.2%
6.7%
Property Plant and Equipment
Land
10.8%
10.2%
Building
101.2%
100.3%
Furnishings
11.2%
11.8%
Equipment
12.1%
11.4%
Accumulated Depreciation
(42.1%)
(42.3%)
Glassware, linen inventories
1.6%
1.9%
Net Property Plant and Equipment
94.8%
93.3%
Total Assets
100.0%
100.0%
Liabilities & Stockholders’ Equity
Current Liabilities
Accounts payable
1.2%
1.5%
Accrued expenses payable
0.6%
0.6%
Taxes payable
1.6%
2.0%
Current portion, mortgage payable
1.8%
1.4 %
Total Current Liabilities
5.2%
5.5%
Long Term Liabilities
Mortgage payable
56.6 %
52.0 %
Total Liabilities
61.8 %
57.5 %
Stockholders’ Equity
Capital stock
16.7%
18.3%
Retained earnings
21.5%
24.2%
Total Stockholders’ Equity
38.2%
42.5%
Total Liabilities & Stockholders’ Equity
100.0%
100.0%
in the accounts that the comparative horizontal analysis does. Total current assets increased
44
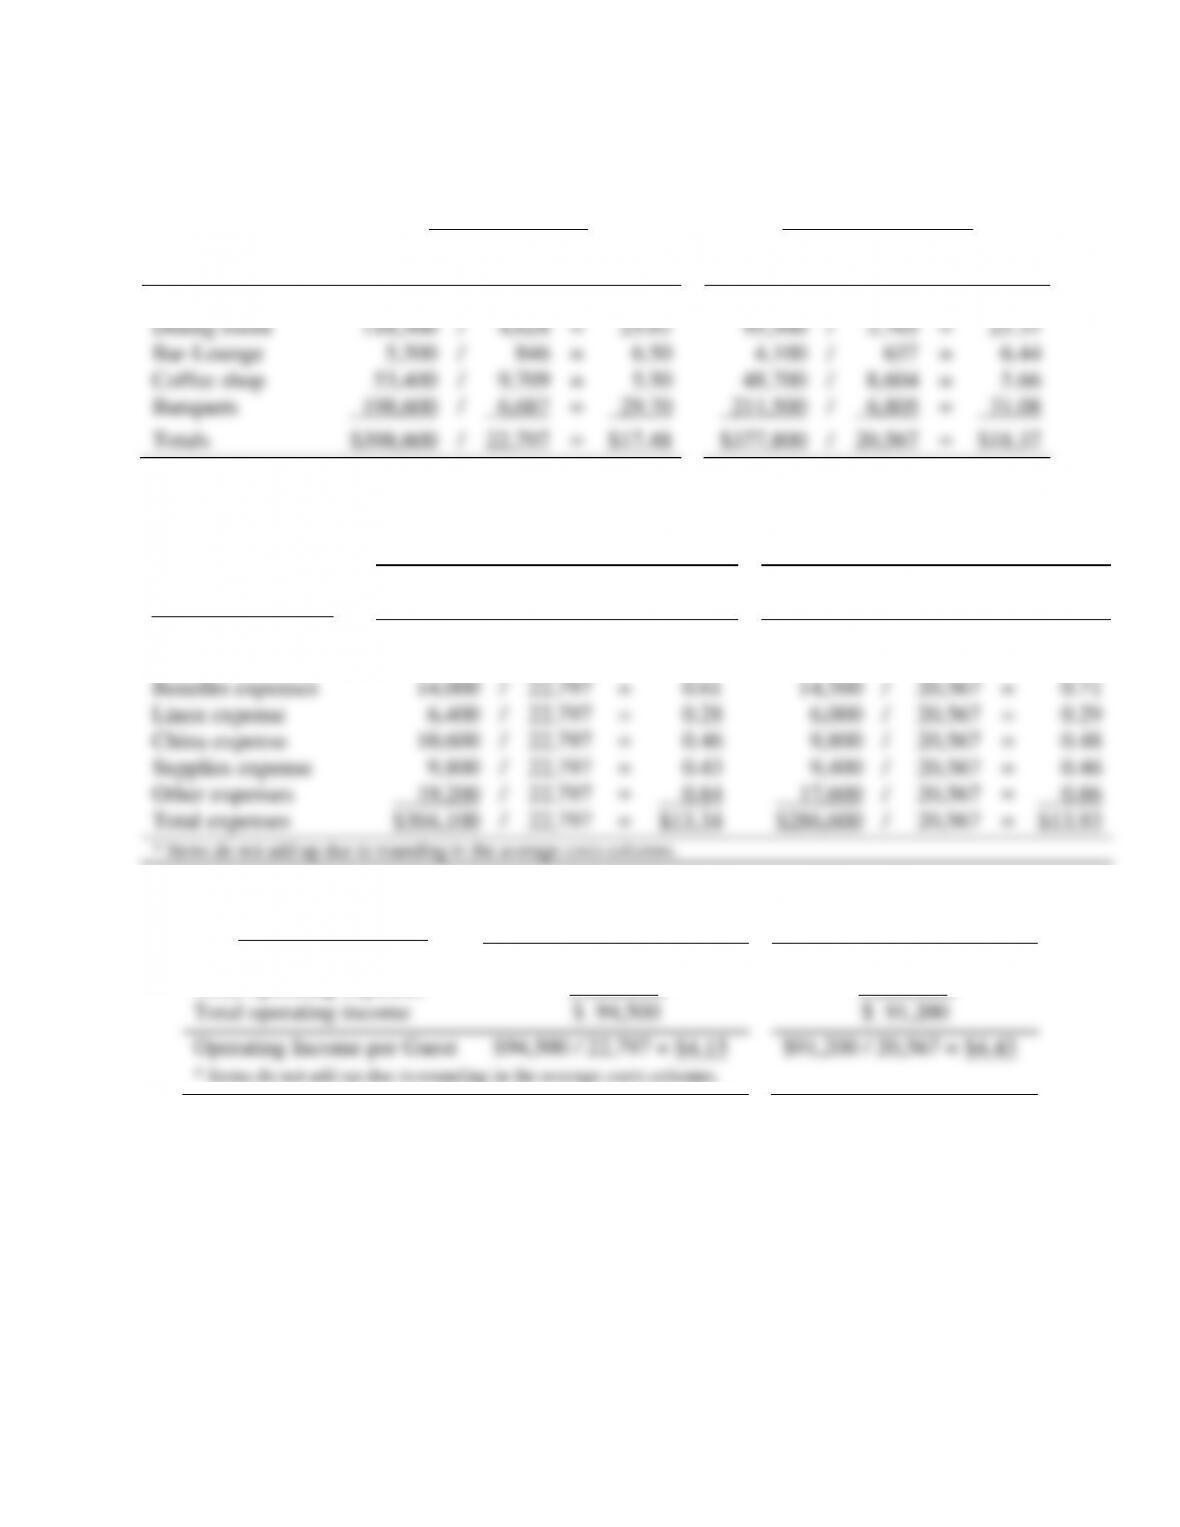
P3.3 a. Calculate the average check per guest for each operating division for August and
September.
Month of August
Month of September
Departmental
Sales
Avg.
Sales
Avg.
Divisions
Revenues
/
Guests
=
Check
Revenues
/
Guests
=
Check
Room Service
$ 22,600
/
927
=
$24.38
$ 18,000
/
756
=
$23.81
Dining room
118,500
/
4,628
=
25.61
95,500
/
3,765
=
25.37
Bar-Lounge
5,500
/
846
=
6.50
4,100
/
637
=
6.44
Coffee shop
53,400
/
9,709
=
5.50
48,700
/
8,604
=
5.66
Banquets
198,600
/
6,687
=
29.70
211,500
/
6,805
=
31.08
Totals
$398,600
/
22,797
=
$17.48
$377,800
/
20,567
=
$18.37
b. Calculation of average cost per guest and total average per guest for the months of
August and September.
Month of August
Month of September
Total
Total
Avg.
Total
Total
Avg.
Operating expenses
Cost
/
Guests
=
Cost
Cost
/
Guests
=
Cost
Cost of sales
$136,200
/
22,797
=
$ 5.97
$127,800
/
20,567
=
$ 6.21
Wages & salaries exp.
107,900
/
22,797
=
4.73
101,500
/
20,567
=
4.94
Benefits expenses
14,000
/
22,797
=
0.61
14,500
/
20,567
=
0.71
Linen expense
6,400
/
22,797
=
0.28
6,000
/
20,567
=
0.29
China expense
10,600
/
22,797
=
0.46
9,800
/
20,567
=
0.48
Supplies expense
9,800
/
22,797
=
0.43
9,400
/
20,567
=
0.46
Other expenses
19,200
/
22,797
=
0.84
17,600
/
20,567
=
0.86
Total expenses
$304,100
/
22,797
=
$13.34
$286,600
/
20,567
=
$13.93
* Items do not add up due to rounding in the average costs columns.
c. Determine the departmental income per guest for August and September.
Departmental Totals
August
September
Total sales revenue
$398,600
$377,800
Total operating expenses
( 304,100)
( 286,600)
Total operating income
$ 94,500
$ 91,200
Operating Income per Guest
$94,500 / 22,797 = $4.15
$91,200 / 20,567 = $4.43
* Items do not add up due to rounding in the average costs columns.
45
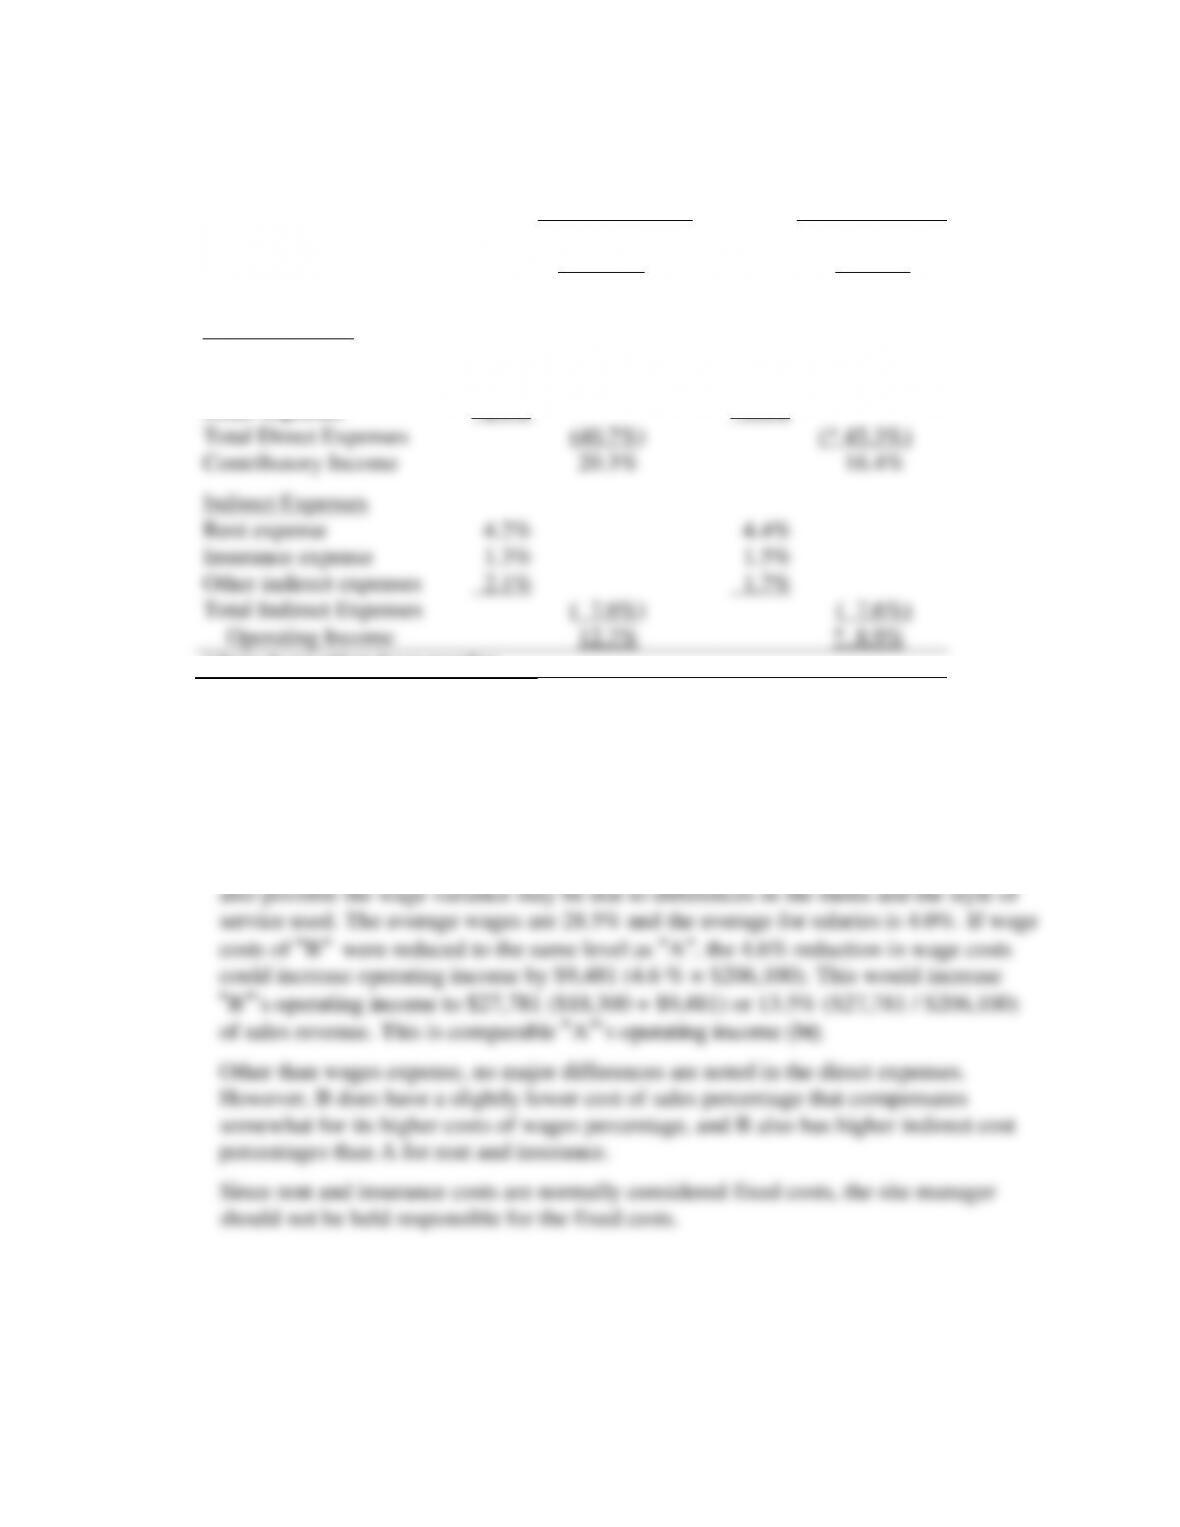
P3.4 Common-size vertical analysis of two similar restaurants:
Restaurant
“A”
Restaurant
“B”
Sales revenue
100.0%
100.0%
Cost of sales
( 39.0%)
(38.3%)
Gross Margin
61.0%
61.7%
Direct Expenses
Wages & salaries expense
29.6%
34.2%
Supplies expense
8.2%
8.2%
Other expenses
2.9%
3.0%
Total Direct Expenses
(40.7%)
(* 45.3%)
Contributory Income
20.3%
16.4%
Indirect Expenses
Rent expense
4.2%
4.4%
Insurance expense
1.3%
1.5%
Other indirect expenses
2.1%
1.7%
Total Indirect Expenses
( 7.6%)
( 7.6%)
Operating Income
12.7%
* 8.9%
* Items do not add up due to rounding
The operating income of “A” is 3.8% above “B” (12.7% − 8.9%). The difference in
operating income appears to be the cost of wages. “B” has a 4.6% higher wage cost than
A (34.2% − 29.6%). Since both “A” and “B” are in the same town, the cost of wages
should be evaluated further.
This situation can result from a difference in employee staffing, salaries and hourly
wage rates, which have been lumped into combined wages and salaries expense. It is
×
=
Current $
$ 96,200
×
(124.9
/
100.0)
=
$120,154
×
(124.9
/
113.8)
=
121,278
×
(124.9
/
118.8)
=
118,907
×
(124.9
/
121.2)
=
122,530
×
(124.9
/
124.9)
=
123,700
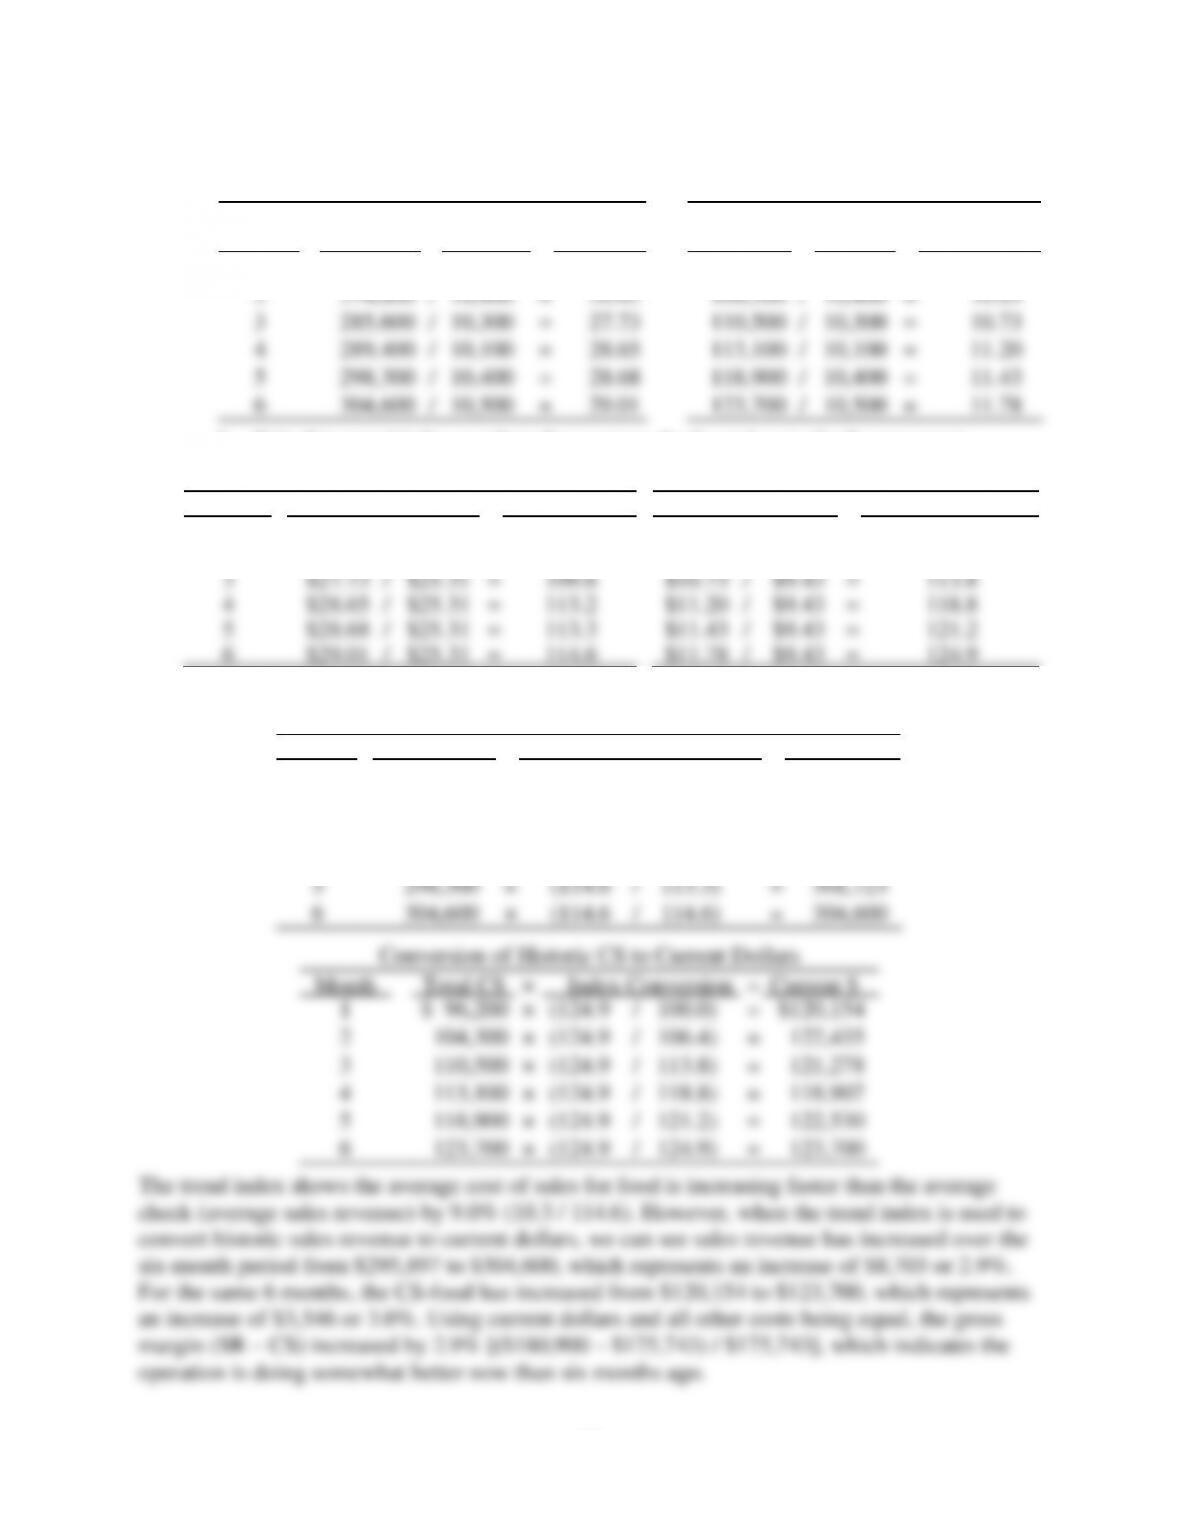
P3.5 a. Calculate the average check and average cost of sales food per guest.
Average Check per Guest
Average CS Food per Guest
Total
Avg.
Total
CS per
Month
SR
/
Guests
=
Check
CS
/
Guests
=
Guest
1
$258,200
/
10,200
=
$25.31
$ 96,200
/
10,200
=
$ 9.43
2
274,800
/
10,400
=
26.42
104,300
/
10,400
=
10.03
3
285,600
/
10,300
=
27.73
110,500
/
10,300
=
10.73
4
289,400
/
10,100
=
28.65
113,100
/
10,100
=
11.20
5
298,300
/
10,400
=
28.68
118,900
/
10,400
=
11.43
6
304,600
/
10,500
=
29.01
123,700
/
10,500
=
11.78
b. Calculate trend index numbers for average checks and cost of sales per guest.
Trend Index Calculations, Average Checks
Trend Index Calculations, CS per Guest
Month
Conversion
Trend Index
Conversion
Trend Index
1
$25.31
/
$25.31
=
100.0
$ 9.43
/
$9.43
=
100.0
2
$26.42
/
$25.31
=
104.4
$10.03
/
$9.43
=
106.4
3
$27.73
/
$25.31
=
109.6
$10.73
/
$9.43
=
113.8
4
$28.65
/
$25.31
=
113.2
$11.20
/
$9.43
=
118.8
5
$28.68
/
$25.31
=
113.3
$11.43
/
$9.43
=
121.2
6
$29.01
/
$25.31
=
114.6
$11.78
/
$9.43
=
124.9
c. Convert historic sales revenue and cost of sales to current dollars.
Conversion of Historic SR to Current Dollars
Month
Total SR
×
Trend Index Conversion
=
Current $
1
$258,200
×
(114.6
/
100.0)
=
$295,897
2
274,800
×
(114.6
/
104.4)
=
301,648
3
285,600
×
(114.6
/
109.6)
=
298,629
4
289,400
×
(114.6
/
113.2)
=
292,979
5
298,300
×
(114.6
/
113.3)
=
301,723
6
304,600
×
(114.6
/
114.6)
=
304,600
47
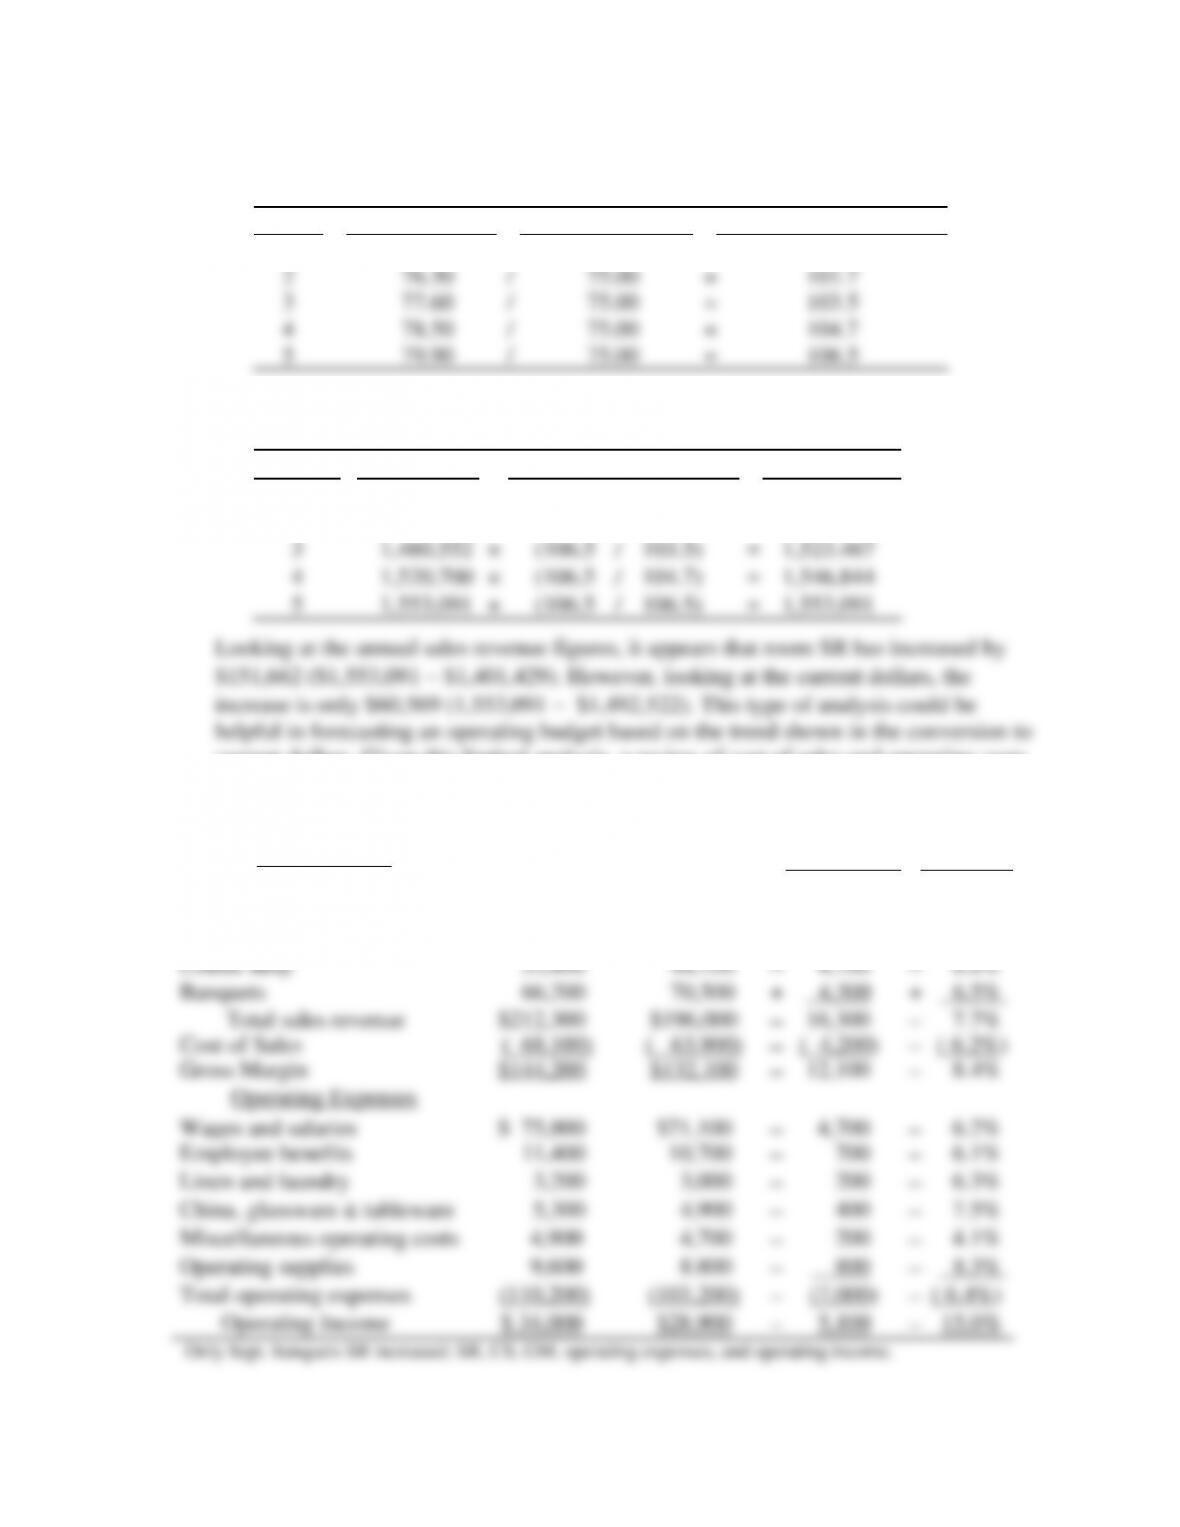
P3.6 a. Prepare a room rate index trend based on average room rates.
Conversion of room rates to Trend Index numbers
Year
Room Rates
/
Rm. Rate Yr. 1
=
Trend Index Numbers
1
$75.00
/
$75.00
=
100.0
2
76.30
/
75.00
=
101.7
3
77.60
/
75.00
=
103.5
4
78.50
/
75.00
=
104.7
5
79.90
/
75.00
=
106.5
b. Using room rate trend index numbers, convert annual SR to current dollars.
Conversion of Historic Sales Revenue to Current Dollars
Year
Annual SR
Conversion Equation
Current $
1
$1,401,429
×
(106.5
/
100.0)
=
$1,492,522
2
1,429,367
×
(106.5
/
101.7)
=
1,496,830
3
1,480,552
×
(106.5
/
103.5)
=
1,523,467
4
1,520,700
×
(106.5
/
104.7)
=
1,546,844
5
1,553,091
×
(106.5
/
106.5)
=
1,553,091
current dollars. Given this limited analysis, a review of cost of sales and operating costs
should also be carried out.
P3.7 Complete a balance sheet comparative horizontal analysis for August and September
Sales Revenue
August
September
Dollar ▲
% ▲
Room service
$ 11,300
$ 9,000
−
2,300
−
20.4%
Dining room
75,900
63,700
−
12,200
−
16.1%
Bar-lounge
5,500
4,100
−
1,400
−
25.5%
Coffee shop
53,400
48,700
−
4,700
−
8.8%
Banquets
66,200
70,500
+
4,300
+
6.5%
Total sales revenue
$212,300
$196,000
−
16,300
−
7.7%
Cost of Sales
( 68,100)
( 63,900)
−
( 4,200)
−
( 6.2%)
Gross Margin
$144,200
$132,100
−
12,100
−
8.4%
Operating Expenses
Wages and salaries
$ 75,800
$71,100
−
4,700
−
6.2%
Employee benefits
11,400
10,700
−
700
−
6.1%
Linen and laundry
3,200
3,000
−
200
−
6.3%
China, glassware & tableware
5,300
4,900
−
400
−
7.5%
Miscellaneous operating costs
4,900
4,700
−
200
−
4.1%
Operating supplies
9,600
8.800
−
800
−
8.3%
Total operating expenses
(110,200)
(103,200)
−
(7,000)
−
( 6.4%)
Operating Income
$ 34,000
$28,900
−
5,100
−
15.0%
Only Sept. banquets SR increased; SR, CS, GM, operating expenses, and operating income.
48
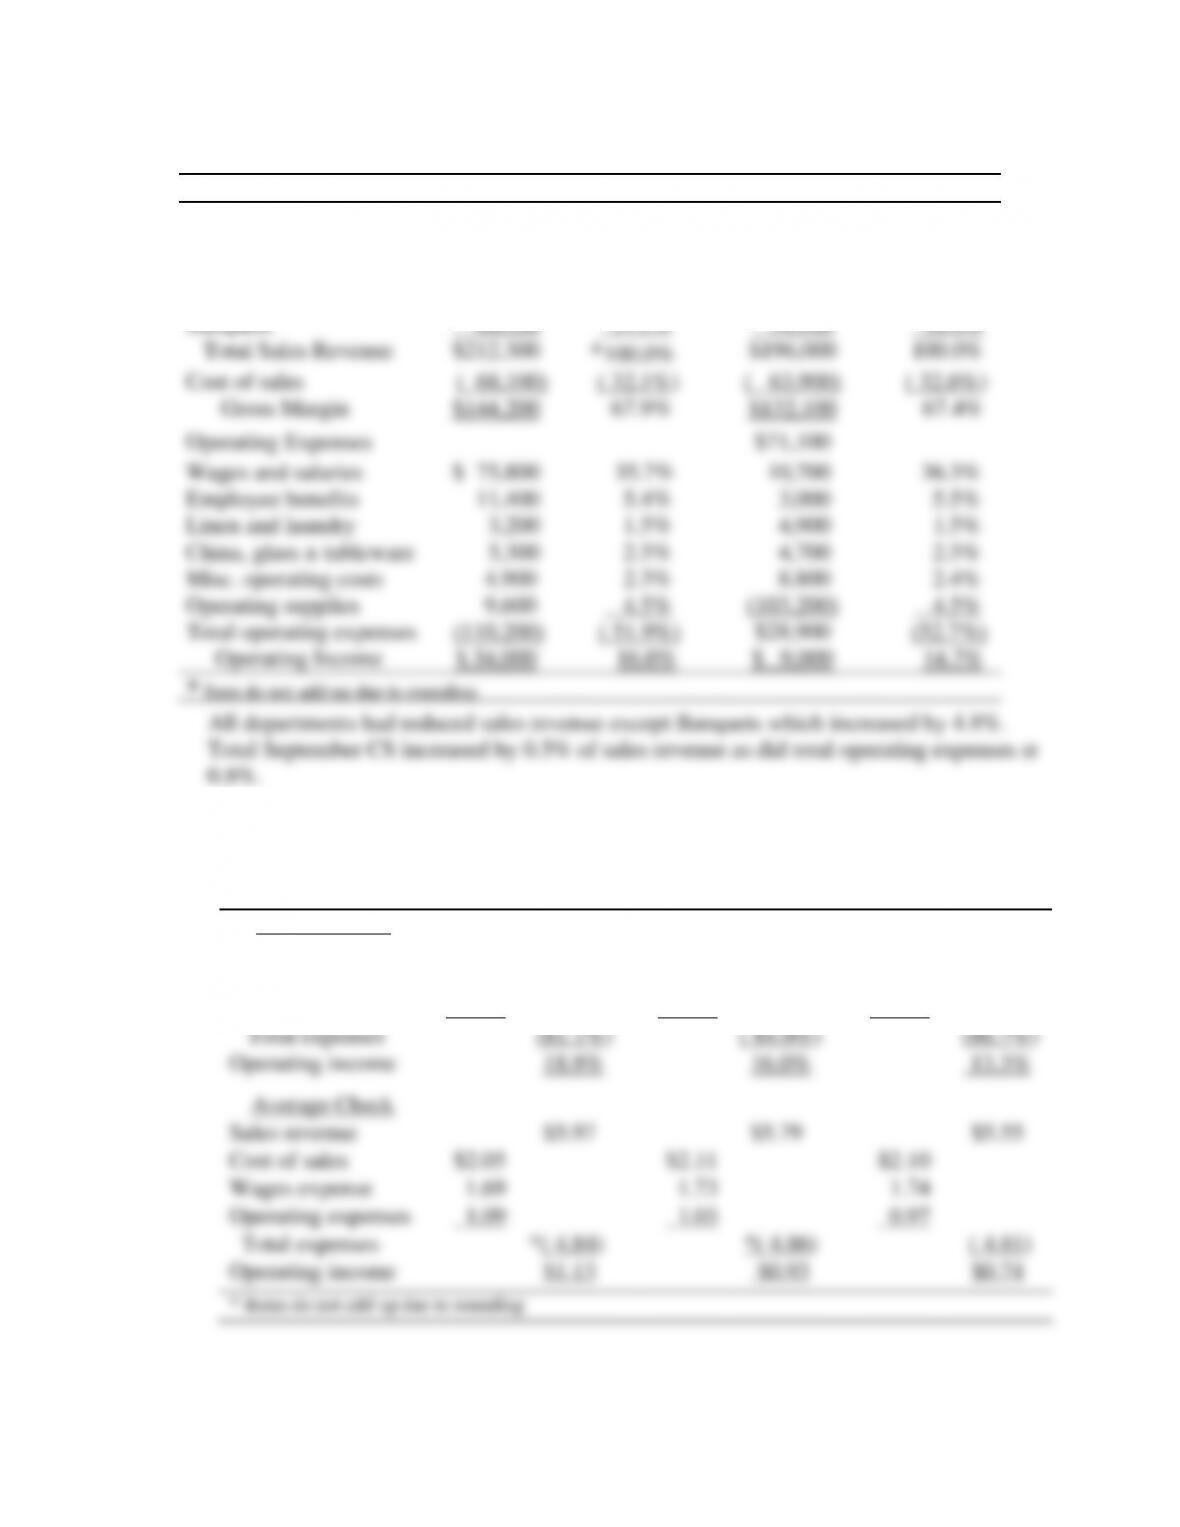
P3.8 Using P3.7 information, complete common-size vertical income statement analysis.
Sales Revenue
August
September
Room service
$ 11,300
5.3%
$ 9,000
4.6%
Dining room
75,900
35.8%
63,700
32.5%
Bar-lounge
5,500
2.6%
4,100
2.1%
Coffee shop
53,400
25.2%
48,700
24.8%
Banquets
66,200
31.2%
70,500
36.0%
Total Sales Revenue
$212,300
*100.0%
$196,000
100.0%
Cost of sales
( 68,100)
( 32.1%)
( 63,900)
( 32.6%)
Gross Margin
$144,200
67.9%
$132,100
67.4%
Operating Expenses
$71,100
Wages and salaries
$ 75,800
35.7%
10,700
36.3%
Employee benefits
11,400
5.4%
3,000
5.5%
Linen and laundry
3,200
1.5%
4,900
1.5%
China, glass & tableware
5,300
2.5%
4,700
2.5%
Misc. operating costs
4,900
2.3%
8.800
2.4%
Operating supplies
9,600
4.5%
(103,200)
4.5%
Total operating expenses
(110,200)
( 51.9%)
$28,900
(52.7%)
Operating Income
$ 34,000
16.0%
$ 9,000
14.7%
* Item do not add up due to rounding
All departments had reduced sales revenue except Banquets which increased by 4.8%.
Total September CS increased by 0.5% of sales revenue as did total operating expenses at
0.8%.
P3.9 Convert the consolidated income statements to common-size vertical analysis income
statements and determine the average check for each month.
April
May
June
Sales Revenue
100.0%
100.0%
100.0%
Cost of sales
34.4%
36.4%
37.9%
Wages expense
28.4%
29.8%
31.3%
Operating expenses
18.3%
17.8%
17.5%
Total expenses
(81.1%)
( 84.0%)
(86.7%)
Operating income
18.9%
16.0%
13.3%
Average Check
Sales revenue
$5.97
$5.79
$5.55
Cost of sales
$2.05
$2.11
$2.10
Wages expense
1.69
1.73
1.74
Operating expenses
1.09
1.03
0.97
Total expenses
*( 4.84)
*( 4.86)
( 4.81)
Operating income
$1.13
$0.93
$0.74
* Items do not add up due to rounding
49
The trend percentages for this operation need to be investigated. The number of guests
has increased considerably from April (May was 4,200 and 5,500 in June) over the 3
months beginning in April. The sales revenue and operating income per guest have both
declined in May and June; however, cost of sales and wages expense increased relative
P3.10 Freddie’s Fried Chicken Restaurant:
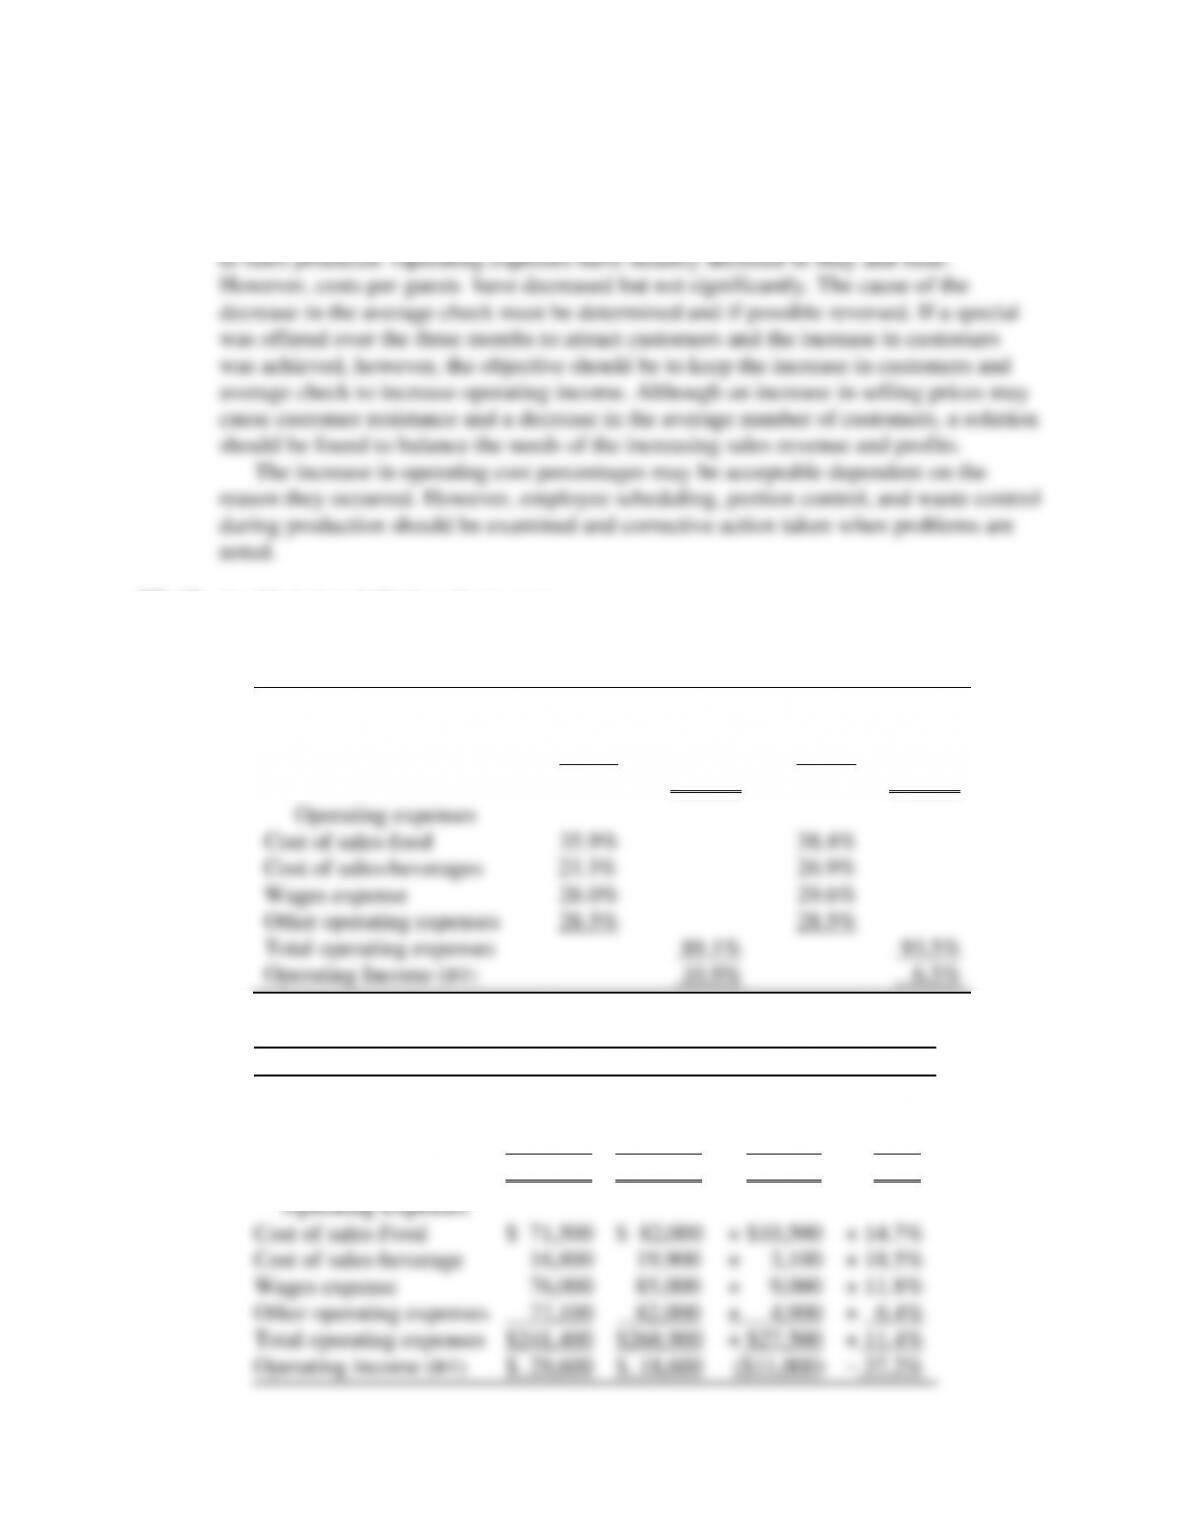
a. Prepare a common-size vertical analysis income statement for 2 months.
April Percentages
May Percentages
Sales Revenue
Sales revenue-food
73.4%
74.3%
Sales revenue-beverages
26.6%
25.7%
Total Sales Revenue
100.0%
100.0%
Operating expenses
Cost of sales-food
35.9%
38.4%
Cost of sales-beverages
23.3%
26.9%
Wages expense
28.0%
29.6%
Other operating expenses
28.5%
28.5%
Total operating expenses
89.1%
93.5%
Operating Income (BT)
10.9%
6.5%
b. Prepare a comparative horizontal analysis income statement.
April
May
$ Change
% Change
Sales Revenue
Sales revenue-food
$199,000
$213,500
+ $14,500
+ 7.3%
Sales revenue-beverages
72,000
74,000
+ 2,000
+ 2.8%
Total Sales Revenue
$271,000
$287,500
+ $16,500
+ 6.1%
Operating Expenses
Cost of sales-Food
$ 71,500
$ 82,000
+ $10,500
+ 14.7%
Cost of sales-beverage
16,800
19,900
+ 3,100
+ 18.5%
Wages expense
76,000
85,000
+ 9,000
+ 11.8%
Other operating expenses
77,100
82,000
+ 4,900
+ 6.4%
Total operating expenses
$241,400
$268,900
+ $27,500
+ 11.4%
Operating income (BT)
$ 29,600
$ 18,600
($11,000)
– 37.2%
50
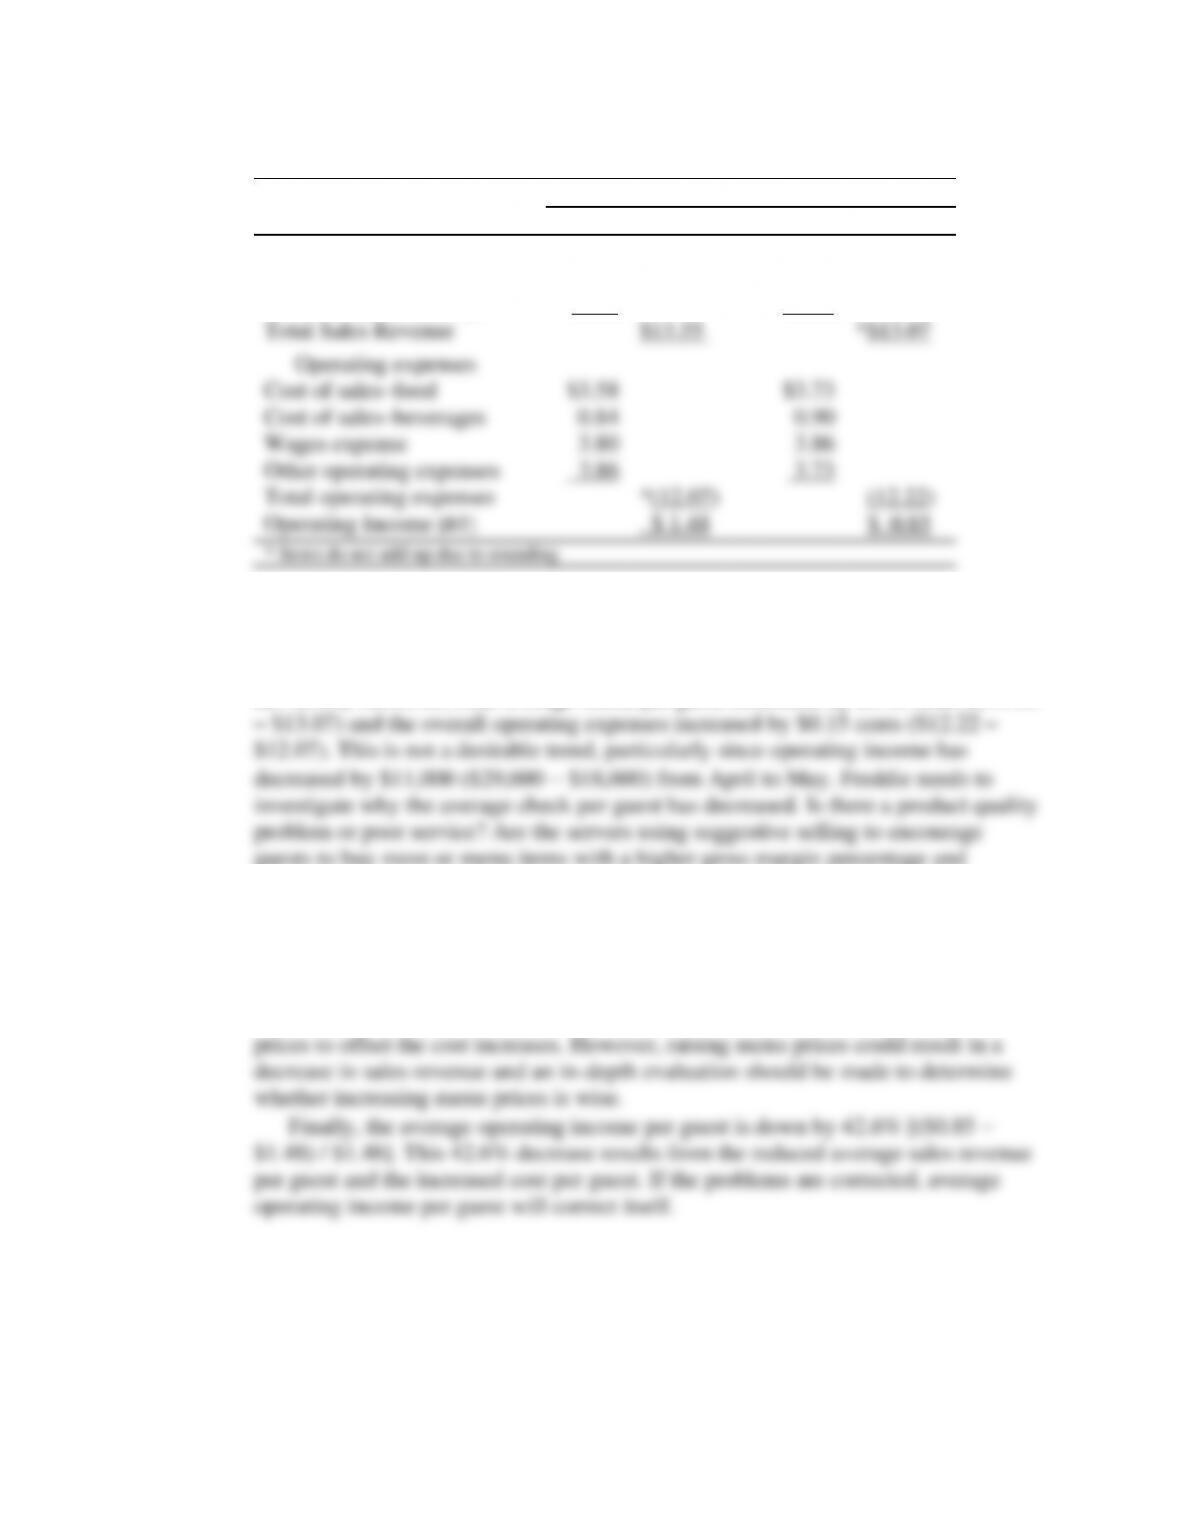
c. Calculate the average check, cost and operating income per guest.
April
May
[20,000 Guests]
[22,000 Guests]
Sales revenue
Sales revenue–food
$9.95
$9.70
Sales revenue–beverages
3.60
3.36
Total Sales Revenue
$13.55
*$13.07
Operating expenses
Cost of sales–food
$3.58
$3.73
Cost of sales–beverages
0.84
0.90
Wages expense
3.80
3.86
Other operating expenses
3.86
3.73
Total operating expenses
*(12.07)
(12.22)
Operating Income [BT]
$ 1.48
$ 0.85
* Items do not add up due to rounding
d. Comments:
In May the restaurant has 10% or 2,000 (22,000 − 20,000 / 20,000) more guests,
May sales revenue increased slightly by 6.1% or $16,500 [($287,500 – $271,000) /
$271,500]. However, total average check per guest decreased by $0.48 cents ($13.55
guests to buy more or menu items with a higher gross margin percentage and
therefore increase the average check?
The average cost per guest has also increased except for other operating costs.
Freddie needs to investigate why costs have increased. If there are control problems
such as portion control, wasted food, poor quality products, or the employees are not
being productive, then Freddie needs to take corrective action. If costs have
increased and there is no waste, consideration must be given to raising the menu
51
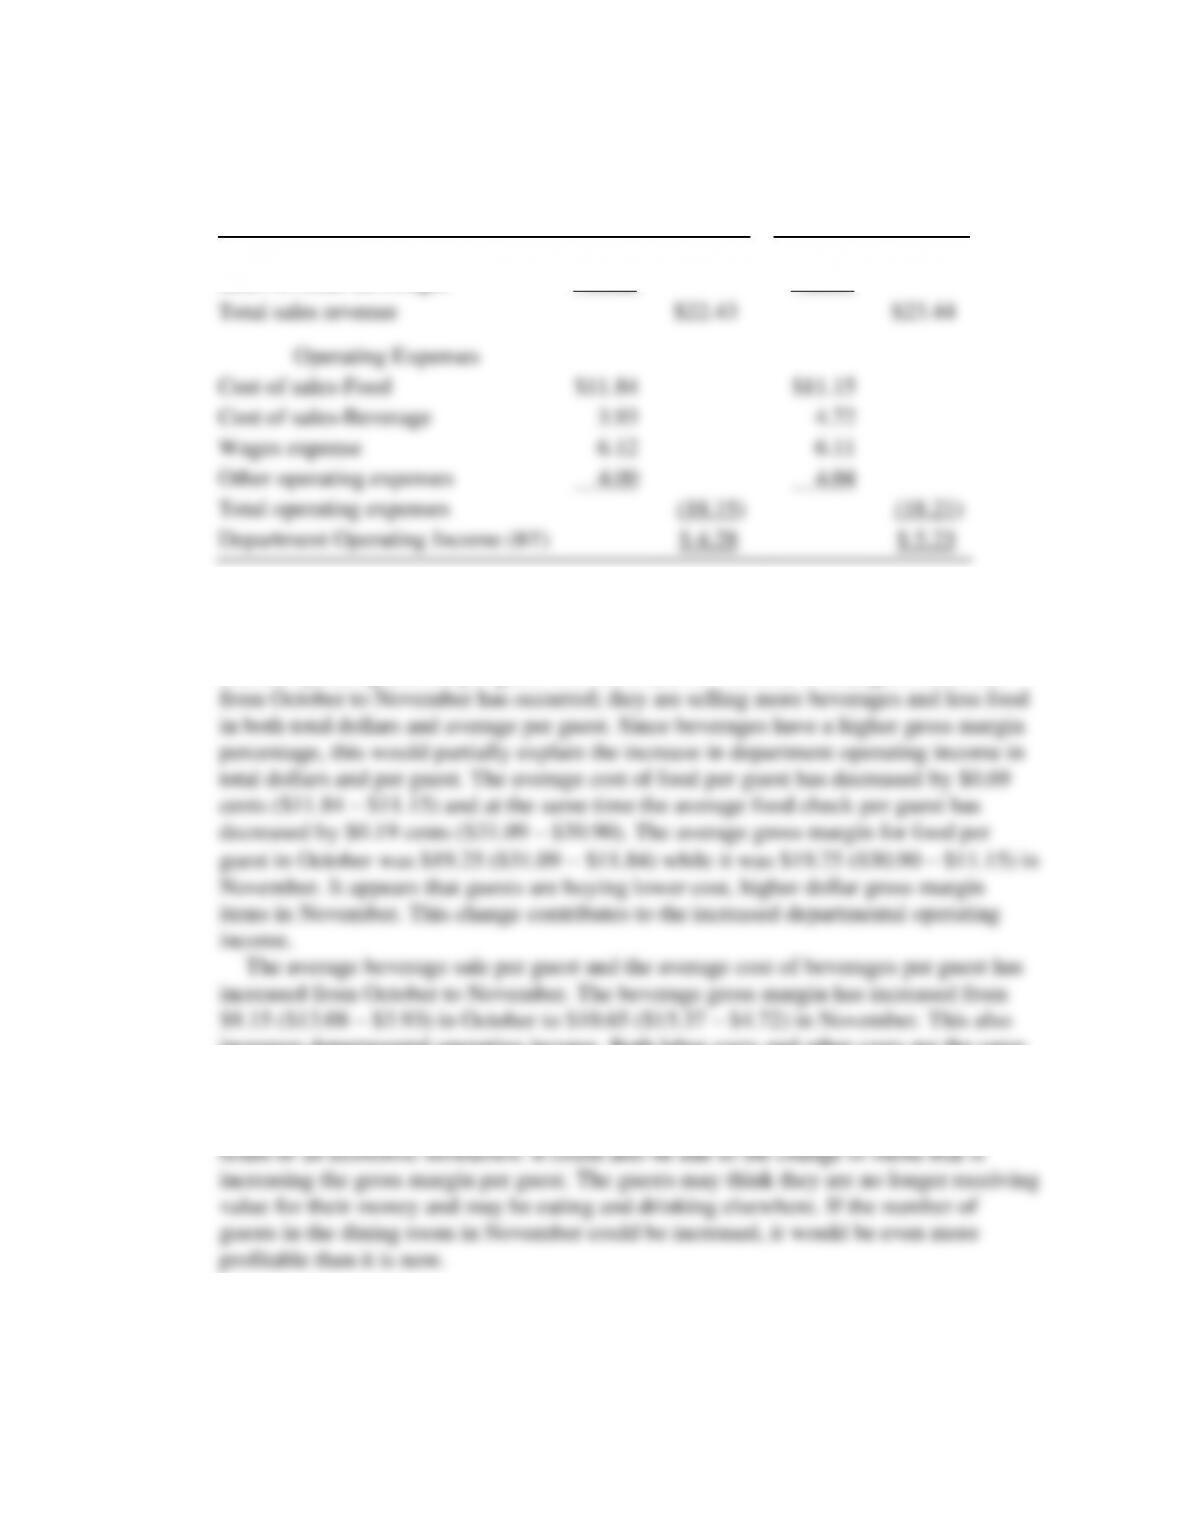
P3.11 Calculate sales revenue average check, expenses and operating income on a per guest
basis. Comment on the dinning room’s operating results.
Sales Revenue
October
November
Sales revenue-Food
$31.09
$30.90
Sales revenue-Beverages
13.08
15.37
Total sales revenue
$22.43
$23.44
Operating Expenses
Cost of sales-Food
$11.84
$11.15
Cost of sales-Beverage
3.93
4.72
Wages expense
6.12
6.11
Other operating expenses
4.00
4.04
Total operating expenses
(18.15)
(18.21)
Department Operating Income (BT)
$ 4.28
$ 5.23
While the total sales revenue in November increased slightly by $592 ($119,273 –
$118,681) the number of guests have decreased by 201 (5290 – 5089). In addition, the
November departmental operating income has increased $3,958 ($26,608 – $22,650)
and the operating income per guest was $0.95 ($5.23 – $4.28). A change in sales mix
increases departmental operating income. Both labor costs and other costs are the same
per guest in both months.
The manager of the dining room needs to determine why the number of guests has
decreased. This decrease could be a normal seasonal decrease or it could also be the
52
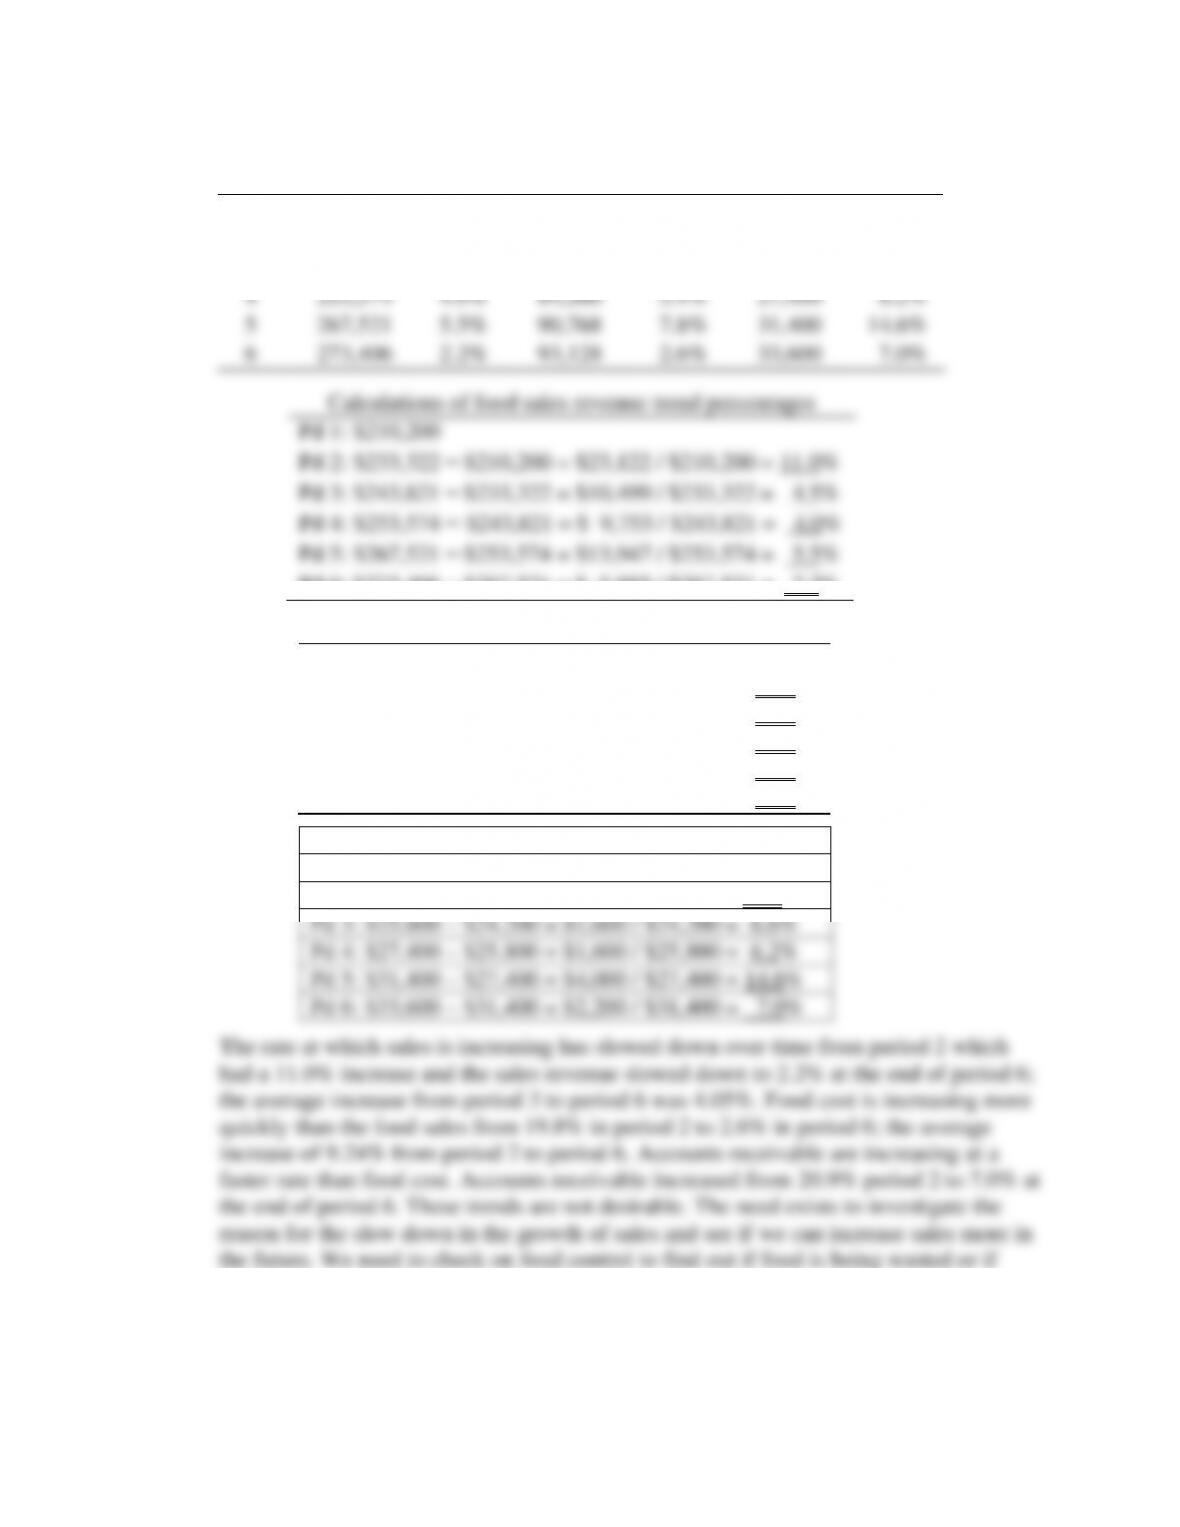
P3.12 Calculation of trend percentages:
Period
SR Food
Trend %
CS Food
Trend %
A/R
Trend %
1
$210,200
$60,330
$20,020
2
233,322
11.0%
72,275
19.8%
24,200
20.9%
3
243,821
4.5%
81,400
12.6%
25,800
6.6%
4
253,574
4.0%
84,200
3.4%
27,400
6.2%
5
267,521
5.5%
90,768
7.8%
31,400
14.6%
6
273,406
2.2%
93,128
2.6%
33,600
7.0%
Calculations of food sales revenue trend percentages
Pd 1: $210,200
Pd 2: $233,322 – $210,200 = $23,122 / $210,200 = 11.0%
Pd 3: $243,821 – $233,322 = $10,499 / $233,322 = 4.5%
Pd 4: $253,574 – $243,821 = $ 9,753 / $243,821 = 4.0%
Pd 5: $267,521 – $253,574 = $13,947 / $253,574 = 5.5%
Pd 6: $273,406 – $267,521 = $ 5,885 / $267,521 = 2.2%
Calculations of cost of sales trend percentages
Pd 1: $60,330
Pd 2: $72,275 – $60,330 = $11,945 / $60,330 = 19.8%
Pd 3: $81,400 – $72,275 = $ 9,125 / $72,275 = 12.6%
Pd 4: $84,200 – $81,400 = $ 2,800 / $81,400 = 3.4%
Pd 5: $90,768 – $84,200 = $ 6,568 / $84,200 = 7.8%
Pd 6: $93,128 – $90,768 = $ 2,360 / $90,768 = 2.6%
Calculations of accounts receivable percentages
Pd 1: $20,020
Pd 2: $24,200 – $20,020 = $4,180 / $20,020 = 20.9%
Pd 3: $25,800 – $24,200 = $1,600 / $24,200 = 6.6%
Pd 4: $27,400 – $25,800 = $1,600 / $25,800 = 6.2%
Pd 5: $31,400 – $27,400 = $4,000 / $27,400 = 14.6%
Pd 6: $33,600 – $31,400 = $2,200 / $31,400 = 7.0%
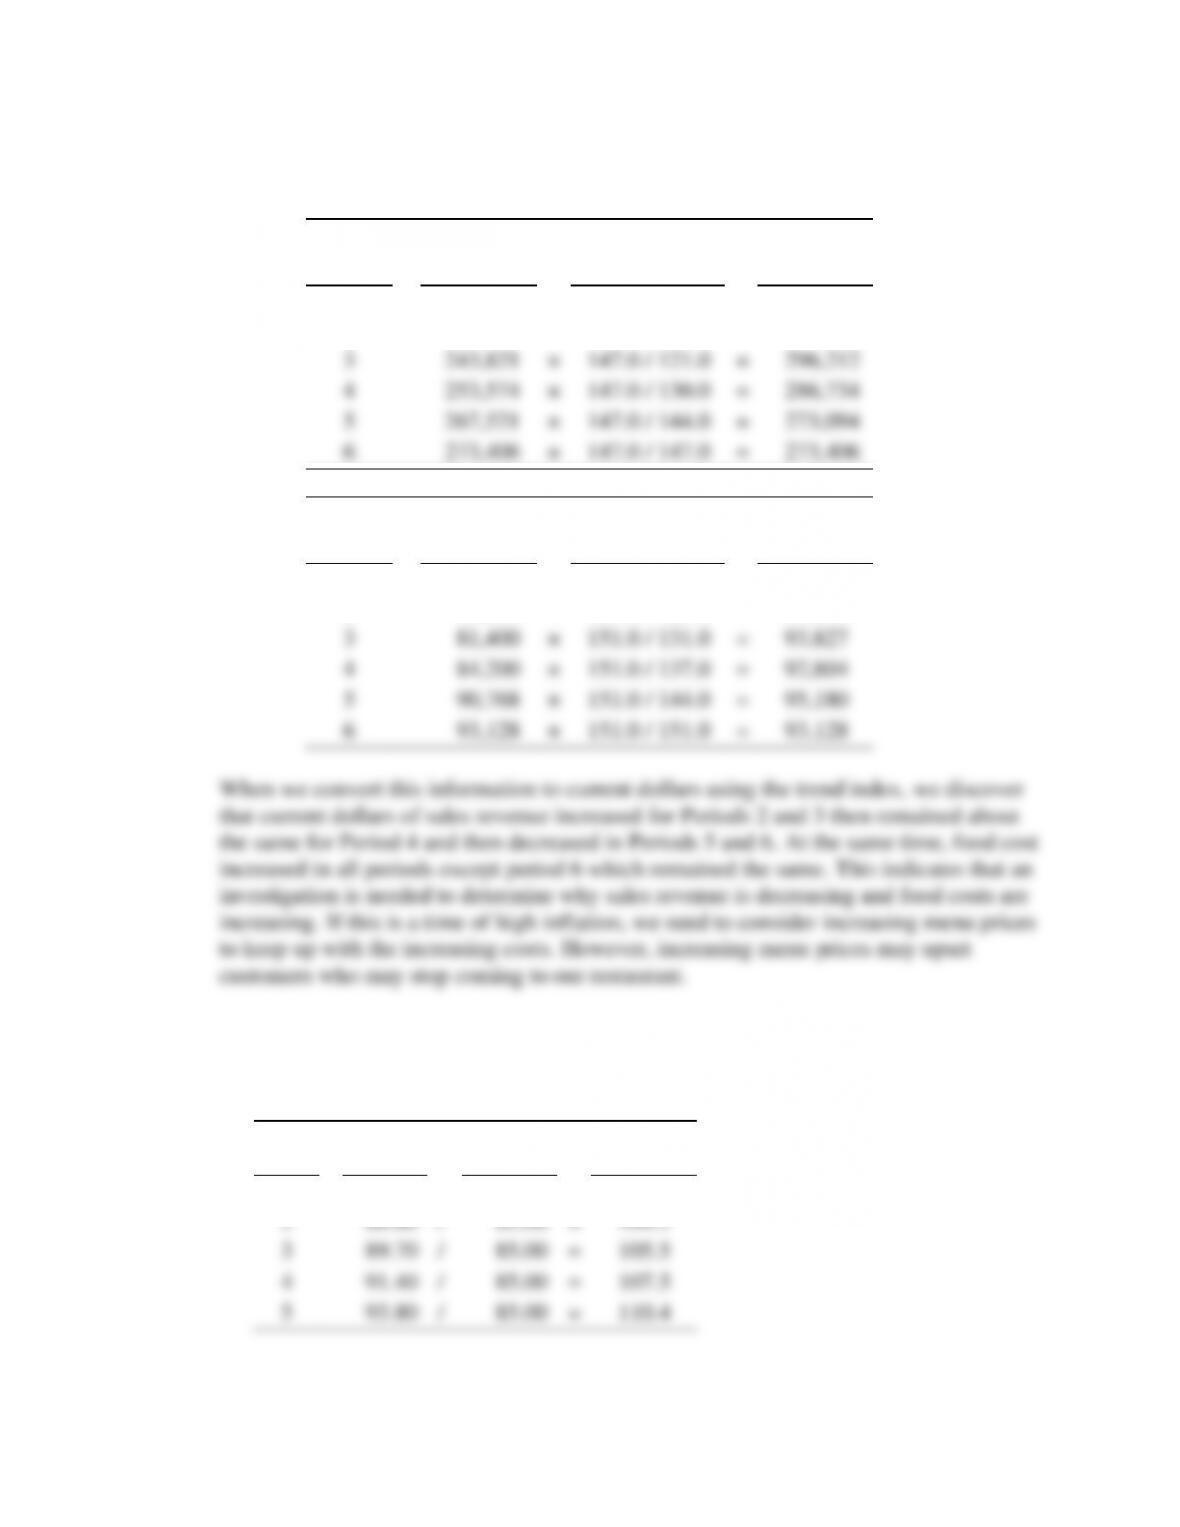
The rate at which sales is increasing has slowed down over time from period 2 which
had a 11.0% increase and the sales revenue slowed down to 2.2% at the end of period 6;
the average increase from period 3 to period 6 was 4.05%. Food cost is increasing more
quickly than the food sales from 19.8% in period 2 to 2.6% in period 6; the average
increase of 9.24% from period 2 to period 6. Accounts receivable are increasing at a
faster rate than food cost. Accounts receivable increased from 20.9% period 2 to 7.0% at
the end of period 6. These trends are not desirable. The need exists to investigate the
reason for the slow down in the growth of sales and see if we can increase sales more in
the future. We need to check on food control to find out if food is being wasted or if
there is a problem with purchasing. If we find any problems, we need to correct them.
The increasing accounts receivable increases the risk of bad debt expense. We need to
check and make sure that accounts receivable collection procedures are being followed
and correct any problems we find.
53
P3.13 Conversion of historic sales revenue and cost of sales to current dollars for the six periods
referred to in P3.12.
Historic
Conversion
Current
Period
SR Food
×
Equation
=
Dollars
1
$210,200
×
147.0 / 107.0
=
$288,779
2
233,322
×
147.0 / 114.0
=
300,863
3
243,821
×
147.0 / 121.0
=
296,212
4
253,574
×
147.0 / 130.0
=
286,734
5
267,521
×
147.0 / 144.0
=
273,094
6
273,406
×
147.0 / 147.0
=
273,406
Historic
Conversion
Current
Period
Food Cost
×
Equation
=
Dollars
1
$60,330
×
151.0 / 121.0
=
$75,288
2
72,275
×
151.0 / 125.0
=
87,308
3
81,400
×
151.0 / 131.0
=
93,827
4
84,200
×
151.0 / 137.0
=
92,804
5
90,768
×
151.0 / 144.0
=
95,180
6
93,128
×
151.0 / 151.0
=
93,128
P3.14 a. Calculate index numbers from the average room rates using the first period as the
base index number.
Room
First
Index
Year
Rate
Year
Numbers
1
$85.00
/
$85.00
=
100.0
2
88.60
/
85.00
=
104.2
3
89.70
/
85.00
=
105.5
4
91.40
/
85.00
=
107.5
5
93.80
/
85.00
=
110.4
54
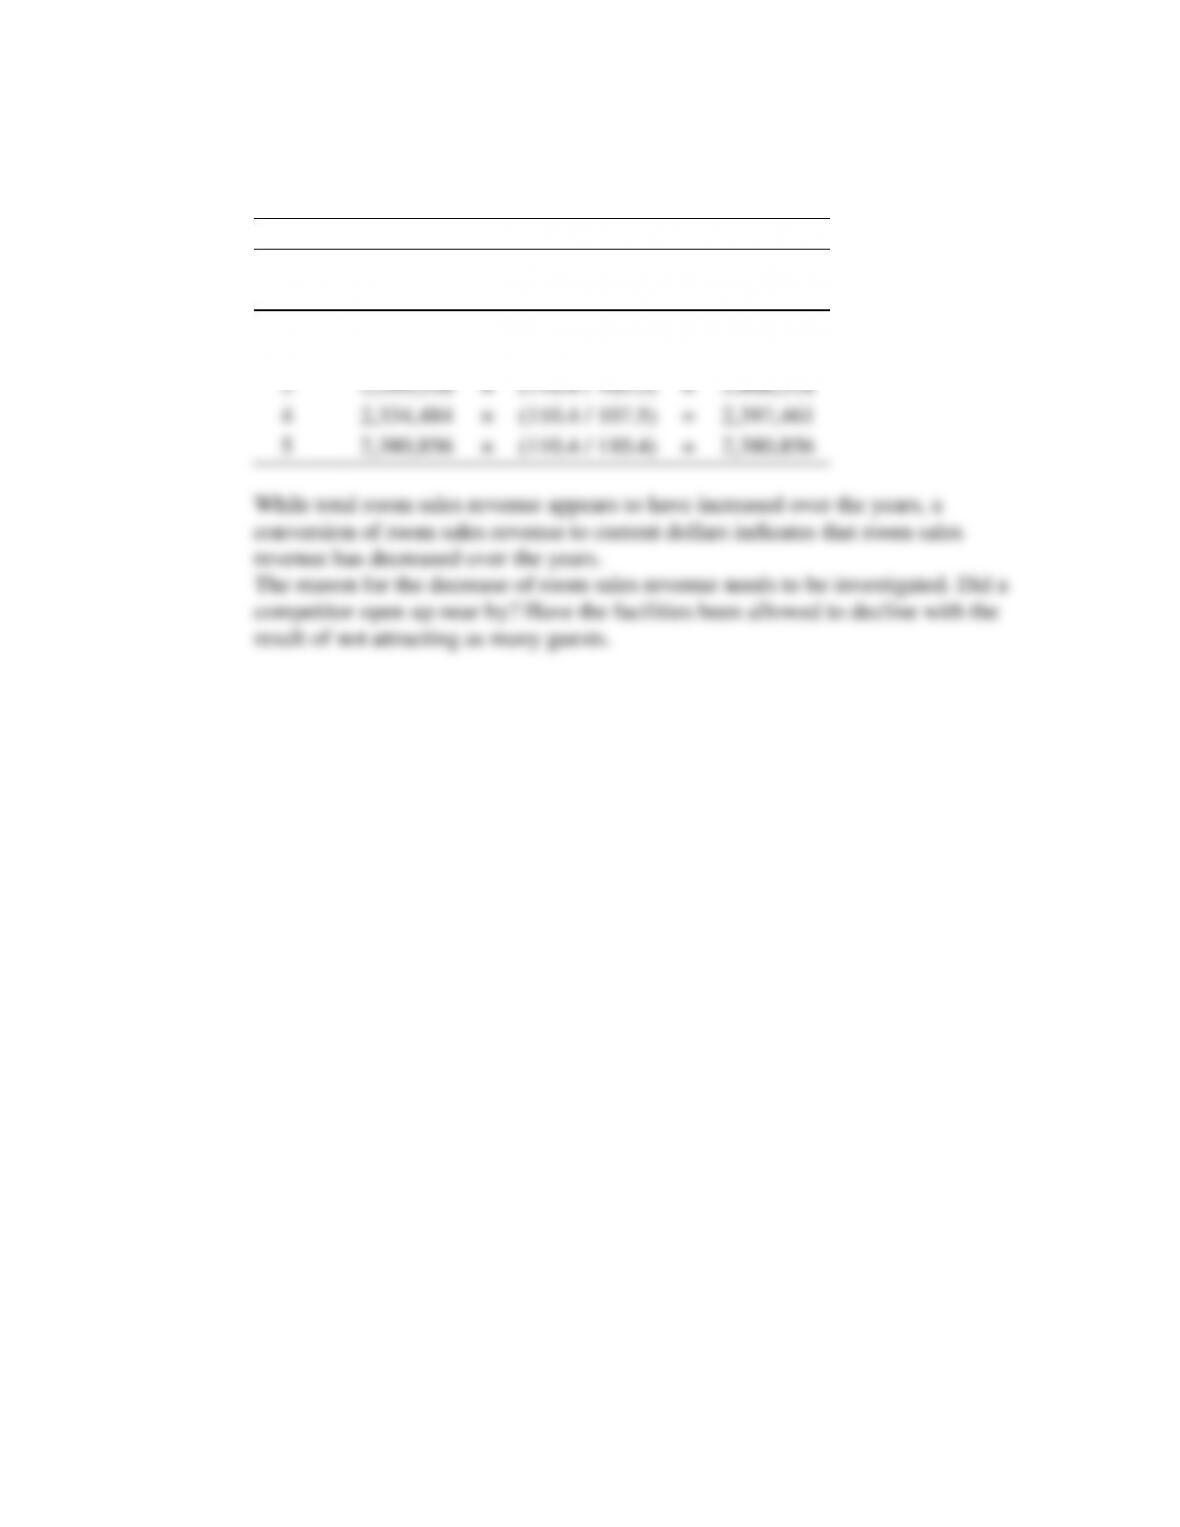
b. Using the index numbers from part a., convert the annual sales revenue of year 1
through year 5 to current dollars, and comment on your analysis.
Conversion of Annual Sales Revenue
Historic
Conversion
Current
Year
Dollars
×
Equation
=
Dollars
1
$2,205,952
×
(110.4 / 100.0)
=
$2,435,371
2
2,254,695
×
(110.4 / 104.2)
=
2,388,851
3
2,299,526
×
(110.4 / 105.5)
=
2,406,328
4
2,334,484
×
(110.4 / 107.5)
=
2,397,461
5
2,380,856
×
(110.4 / 110.4)
=
2,380,856
55
CASE 3 SOLUTIONS
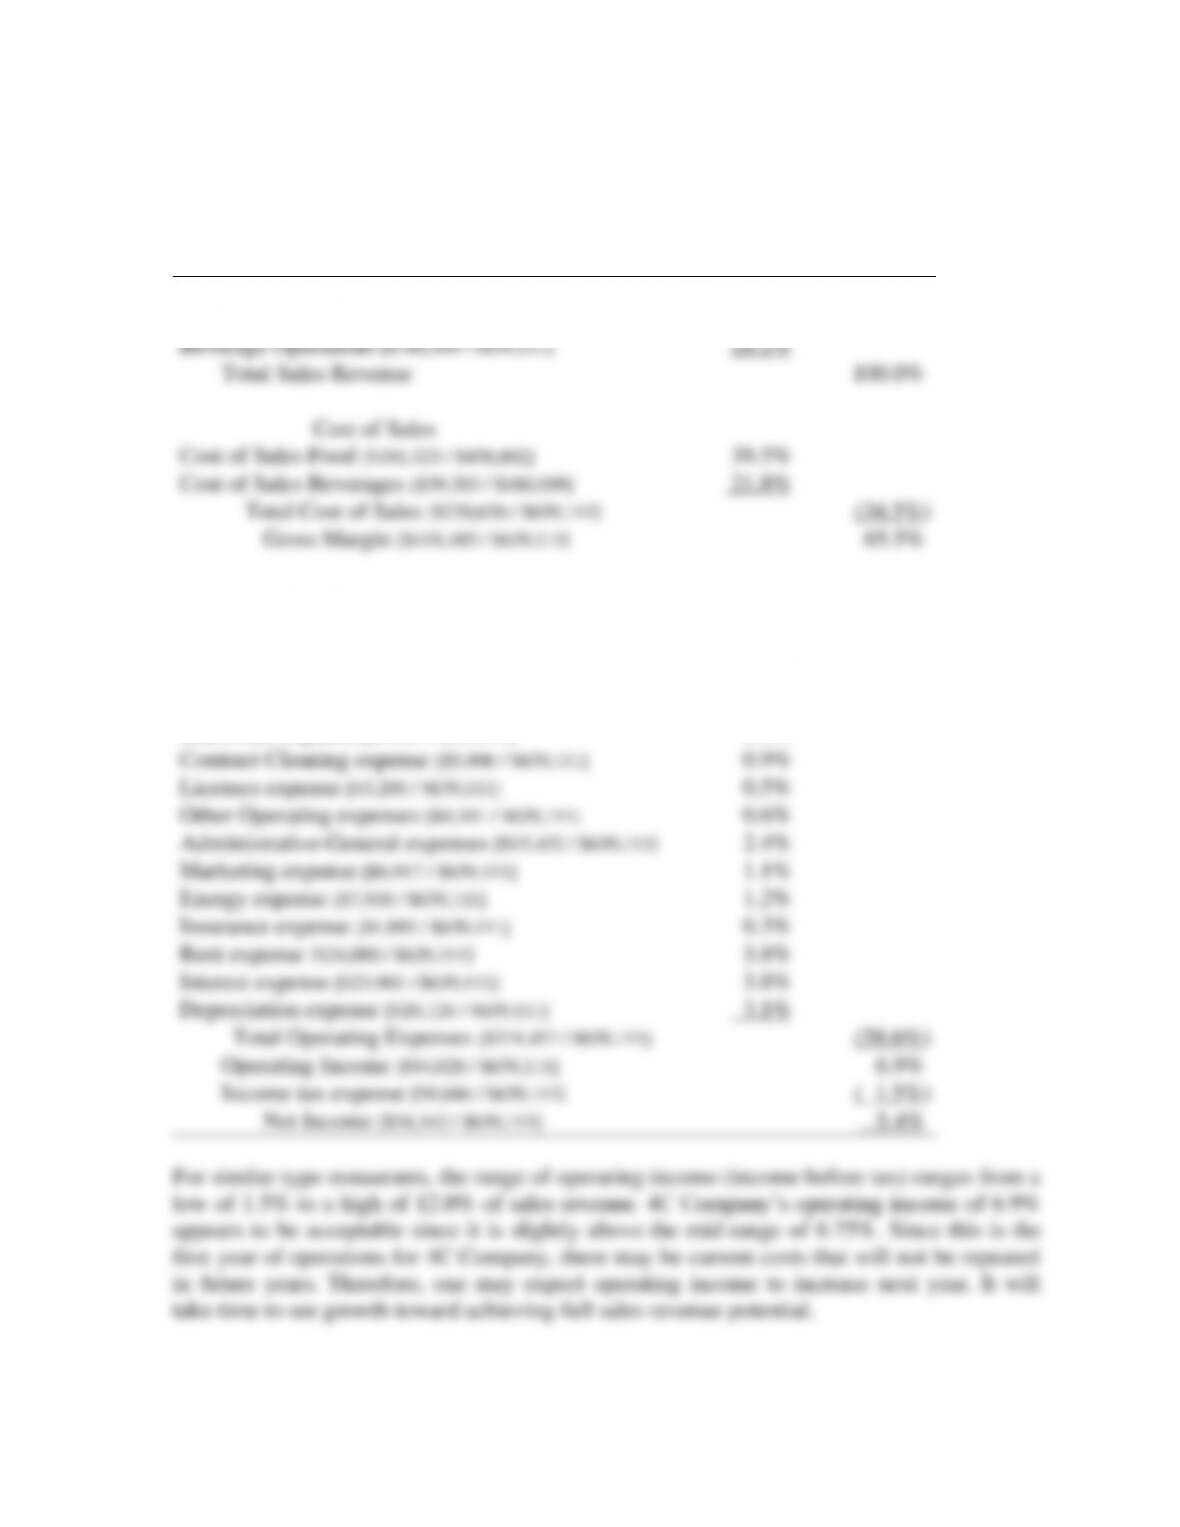
a. 4 C Company
Common-Size (Vertical) Income Statement
For the Year Ended December 31, 2007
Sales Revenue
Food Operations [$458,602 / $639,111]
71.8%
Beverage Operations [$180,509 / $639,111]
28.2%
Total Sales Revenue
100.0%
Cost of Sales
Cost of Sales Food [$181,323 / $458,602]
39.5%
Cost of Sales Beverages [$39,303 / $180,509]
21.8%
Total Cost of Sales [$220,626 / $639,111]
(34.5%)
Gross Margin [$418,485 / $639,111]
65.5%
Operating Expenses
Salaries and Wages expense [$223,543 / $639,111]
35.0%
Laundry expense [$16,609 / $639,111]
2.6%
Kitchen Fuel expense [$7,007 / $639,111]
1.1%
China and tableware expenses [$12,214 / $639,111]
1.9%
Glassware expense [$1,605 / $639,111]
0.3%
Contract Cleaning expense [$5,906 / $639,111]
0.9%
Licenses expense [$3,205 / $639,111]
0.5%
Other Operating expenses [$4,101 / $639,111]
0.6%
Administrative-General expenses [$15,432 / $639,111]
2.4%
Marketing expense [$6,917 / $639,111]
1.1%
Energy expense [$7,918 / $639,111]
1.2%
Insurance expense [$1,895 / $639,111]
0.3%
Rent expense [$24,000 / $639,111]
3.8%
Interest expense [$23,981 / $639,111]
3.8%
Depreciation expense [$20,124 / $639,111]
3.1%
Total Operating Expenses [$374,457 / $639,111]
(58.6%)
Operating Income [$44,028 / $639,111]
6.9%
Income tax expense [$9,686 / $639,111]
( 1.5%)
Net Income [$34,342 / $639,111]
5.4%
For similar type restaurants, the range of operating income (income before tax) ranges from a
low of 1.5% to a high of 12.0% of sales revenue. 4C Company’s operating income of 6.9%
appears to be acceptable since it is slightly above the mid range of 6.75%. Since this is the
first year of operations for 4C Company, there may be current costs that will not be repeated
in future years. Therefore, one may expect operating income to increase next year. It will
take time to see growth toward achieving full sales revenue potential.
56
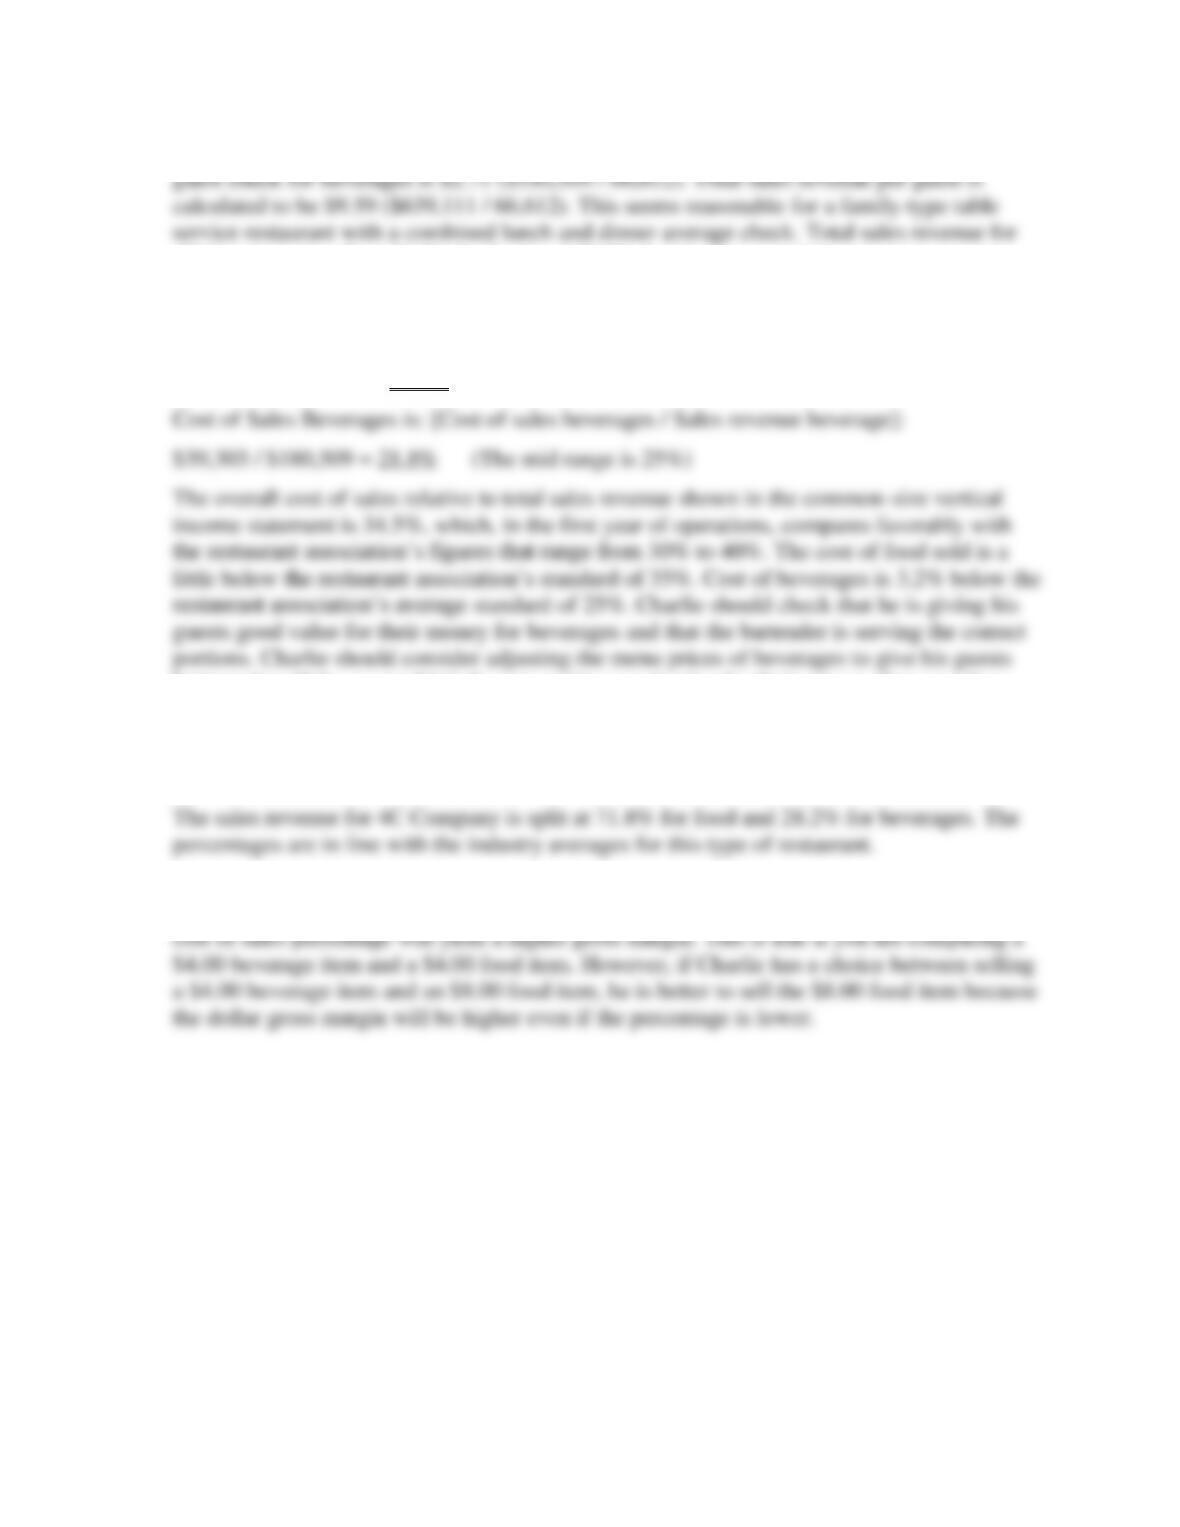
b. The average check for food is $6.88 ($458,602 / 66,612) and average total sales revenue per
4C Company is split at 71.8% for food and 28.2% for beverages and the percentages are in
line with industry averages for this type of restaurant.
c. Cost of Sales Food is [Cost of sales food / Total sales revenue food]:
$181,323 / $458,602 = 39.5% (The mid range is 35%)
better value. If the guests think they are getting good value for their money, they may buy
more beverages and thus, increase total gross margin. Since beverages take very little labor to
produce, he is unlikely to increase labor costs. If Charlie can increase average check, he will
increase his gross margin and, therefore, his operating income.
d. It is generally preferred to have a higher percentage of beverage sales revenue to food sales
revenue, since beverage cost of sales is lower per dollar of sales revenue generated. A lower