19
CHAPTER 2
UNDERSTANDING FINANCIAL STATEMENTS
INTRODUCTION
For students who have recently completed an introductory accounting course most of this chapter
will be review material. However, the chapter explains financial statements in the specific terms
used by hospitality industry enterprises; terms that may not be learned in a general business
accounting course. Departmental income statements are discussed with emphasis on the
calculation of cost of sales for food and beverages as well as the sales revenue mix. Changes in
sales revenue mix between departments may affect the overall net income of the business
enterprise. If course time does not permit complete coverage of the material in this chapter, it
should at least be assigned for self-study. This chapter, along with Chapter 1, provides the
foundation for most of the remaining chapters in the textbook.
TRUE OR FALSE QUESTIONS
(Correct answer indicated by T for True answers and F for False answers)
1. Financial statements provide information useful to management for decision-making.
T
2. The uniform system of accounts ensures that the financial statement figures of an
individual establishment are the same as national average figures.
F
3. The income statement gives a picture of the financial position of a business at a point
in time.
F
4. Departmental income statements are typical of the hotel industry.
T
5. Direct expenses are generally the responsibility of, and controllable by the department
head concerned.
T
6. The term FIFO stands for first-in, first-ordered.
F
7. When a hotel practices responsibility accounting, departments can be identified as
either cost centers or production centers.
F
8. Contributory income is the income for a department, after indirect expenses have
been deducted.
F
9. Indirect expenses should be allocated to the various departments only on a ratio of
departmental sales revenue to total sales revenue basis.
F
10. Indirect expenses are usually controllable by department managers.
F
11. A department with a high contributory income percent will, with an increase in sales
revenue, yield more net income to the overall establishment, than would a department
with a lower contributory income percentage having the same sales revenue increase.
T
12. The balance sheet shows the operating results of a business over a specific period.
F
20
13. Marketable and short-term securities are current assets.
T
14. A hotel’s inventory of china, glass, and silver is usually shown as a current asset.
F
15. The two common methods of balance sheet presentation are known as the account
form and the T form.
F
16. Accumulated depreciation, like the allowance for uncollectible accounts, is a form of
contra accounts shown on the balance sheet.
T
17. The unexpired portion of a long-term lease paid in advance should be shown as an
asset.
T
18. Credit balances on guests’ accounts receivable should be shown on the balance sheet
as a reduction of accounts receivable.
F
19. A mortgage is a type of long-term liability.
T
20. Paid in capital, excess of par is the amount by which the present value of a fixed asset
exceeds its original purchase price.
F
21. The only type of stock issued by hotel companies is common stock.
F
22. Retained earnings represent the accumulation of net incomes, less losses, and
dividends, since a company started.
T
23. Retained earnings are part of the income statement.
F
24. Retained earnings are the link between the income statement and the balance sheet.
T
25. The liability and equity sections of a balance sheet show how the company’s assets
are currently financed.
T
26. Ownership withdraws and dividends to stockholders’ are contra accounts.
T
27. A trial balance that is not in balance always indicates an error exists.
T
MULTIPLE CHOICE QUESTIONS
(Correct answer indicated by asterisk)
1. A direct expense is:
(a) controllable by the accountant employed by the business
(b) deducted from a department’s contributory income
2. Contributory incomes are:
(c) sales revenues less indirect expenses
(d) income before income tax
21
3. Net cost of sales food is calculated by adjusting cost of sales food by:
(c) adding opening and closing inventory to purchases
(d) adding transfers in, adding employee meals, and deducting transfers out
4. Gross margin is:
(a) income before income tax
(b) sales revenue less indirect expenses
5. Which of the following is not an inventory valuation method?
(a) Specific item cost
(b) FIFO
6. A decentralized departmental operation where managers are made accountable for their
performance and the performance of employees in their department is known as:
(c) performance accounting
(d) accounting decentralization
7. indirect expenses:
(a) should be allocated to the operating departments on a square foot basis
(b) should be allocated to the operating departments based on sales revenue
8. departmental sales revenue mix refers to the:
(c) ratio of direct expenses allocated to departments based on sales revenue
(d) deduction of indirect expenses from a department’s sales revenue to arrive at contributory
income
9. Which of the following is not normally considered a current asset in a hotel?
(c) Prepaid expense
(d) Marketable securities
(c) not shown as an expense if the company has a loss
(d) not shown as an expense until the company is liquidated
22
11. Deposits sent in by hotel room guests to hold rooms for some future period are shown on the
balance sheet as a (an):
(a) asset
(b) reduction of accounts receivable
12. paid in capital, excess of par or stated value (capital surplus) is:
(c) net income less net losses of the business since it began
(d) the difference between current market value of fixed or capital assets and the original cost
price
13. retained earnings are:
(c) reduced by any deficits before being recorded on the balance sheet
(d) represented by an equivalent amount of cash in the bank
14. Beginning retained earnings were $86,300. During the year, the company had a net loss of
$10,200 and paid dividends of $16,800. Ending retained earnings are:
(a) $92,900
15. The two basic formats of balance sheet presentation are the:
(a) “T” account form and report form
16. Catering equipment was purchased at a cost of $24,400 that has an estimated life of 10 years
and a residual value of $1,400. Using double-declining balance, calculate the depreciation
(c) $3,680
(d) $4,600
EXERCISE SOLUTIONS
E2.1 To be classified as a current asset account, inventories must be purchased for resale.
E2.2 The key word is Traceable. Direct costs are said to be directly traceable, and indirect
costs are considered non-traceable to a specific operating department.
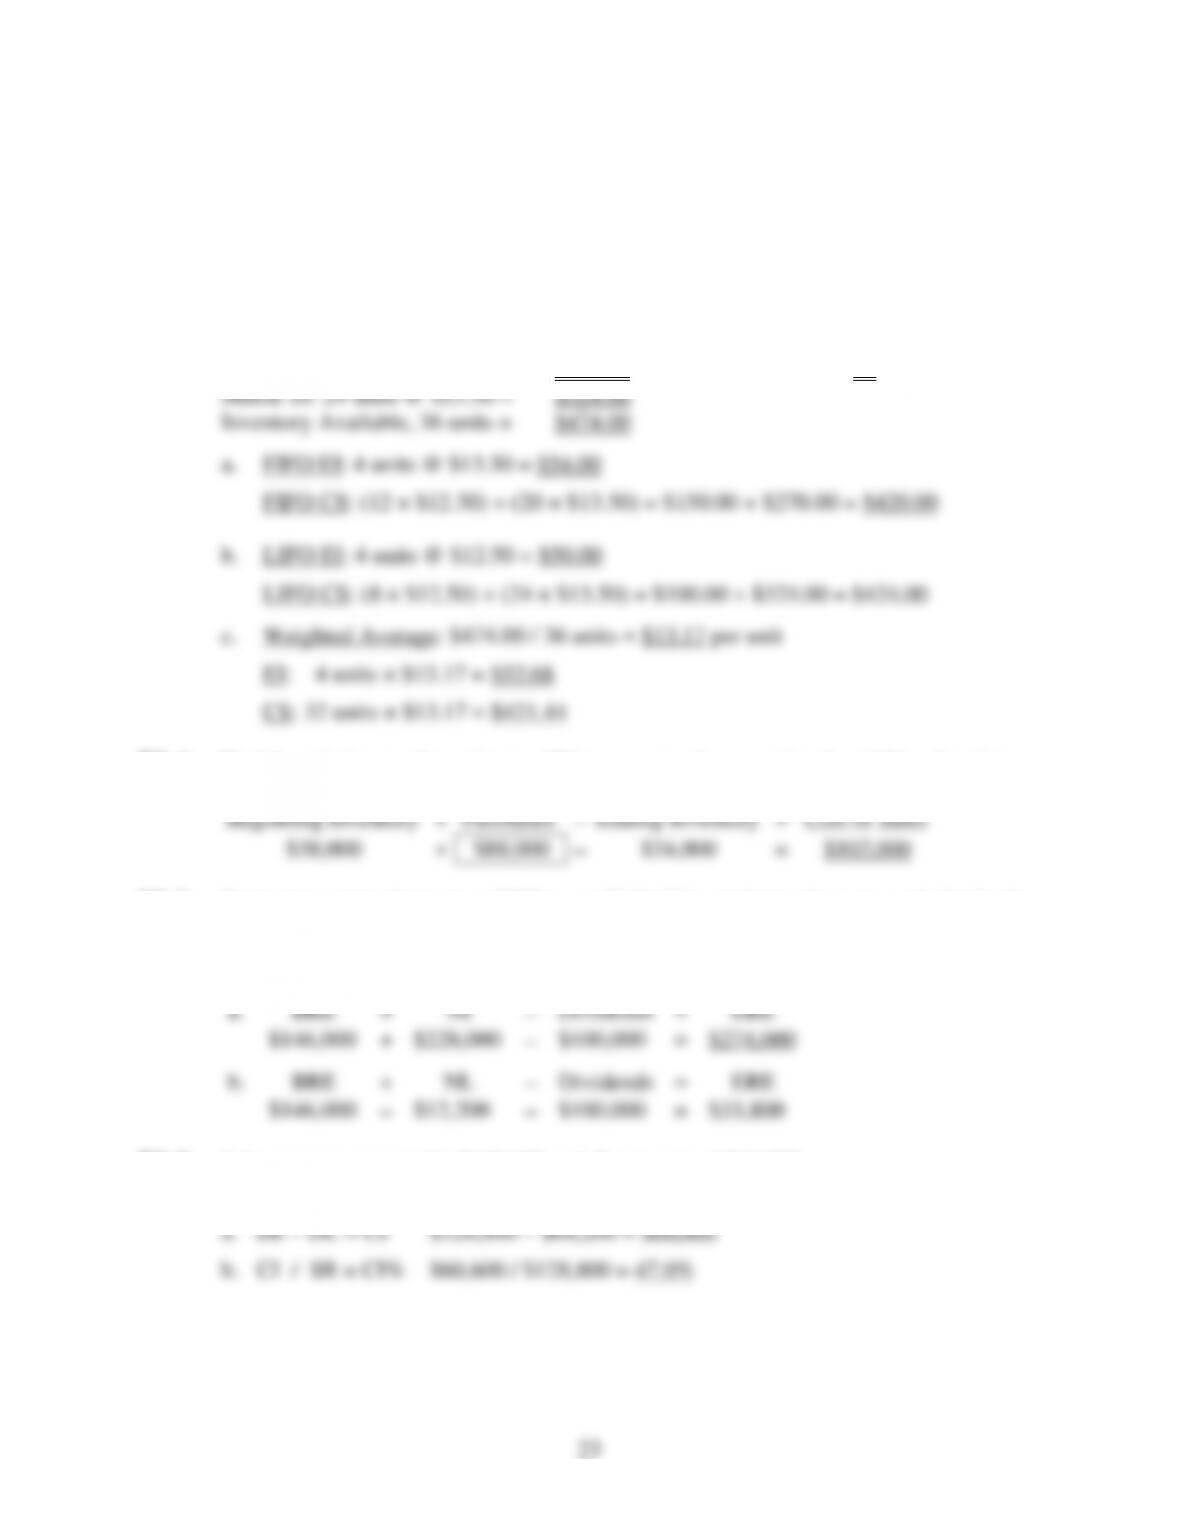
E2.3 Determine the value of the ending inventory and cost of sales for M & B for March
using: a. FIFO, b. LIFO, and c. Weighted average methods.
March 02: 12 units @ $12.50 = $150.00 March sales were: 32 units sold
E2.4 Find the missing purchases in an additive sequence by reversing the additive function:
Beginning Inventory
+
Purchases
−
Ending Inventory
=
Cost of Sales
$38,000
+
$88,000
−
$24,000
=
$102,000
E2.5 Beginning retained earnings (BRE) were $146,000 and during the year, cash dividends
of $100,000 were paid to the owners. NI for the year was $228,000. Determine the
ending retained earnings (ERE) using NI and NL.
a.
BRE
+
NI
−
Dividends
=
ERE
$146,000
+
$228,000
−
$100,000
=
$274,000
b.
BRE
+
NL
−
Dividends
=
ERE
$146,000
−
$12,200
−
$100,000
=
$33,800
E2.6 Sales revenue reported is $128,800 and direct costs of $68,200.
Determine: a. contributory income and b. contributory income percentage.
24
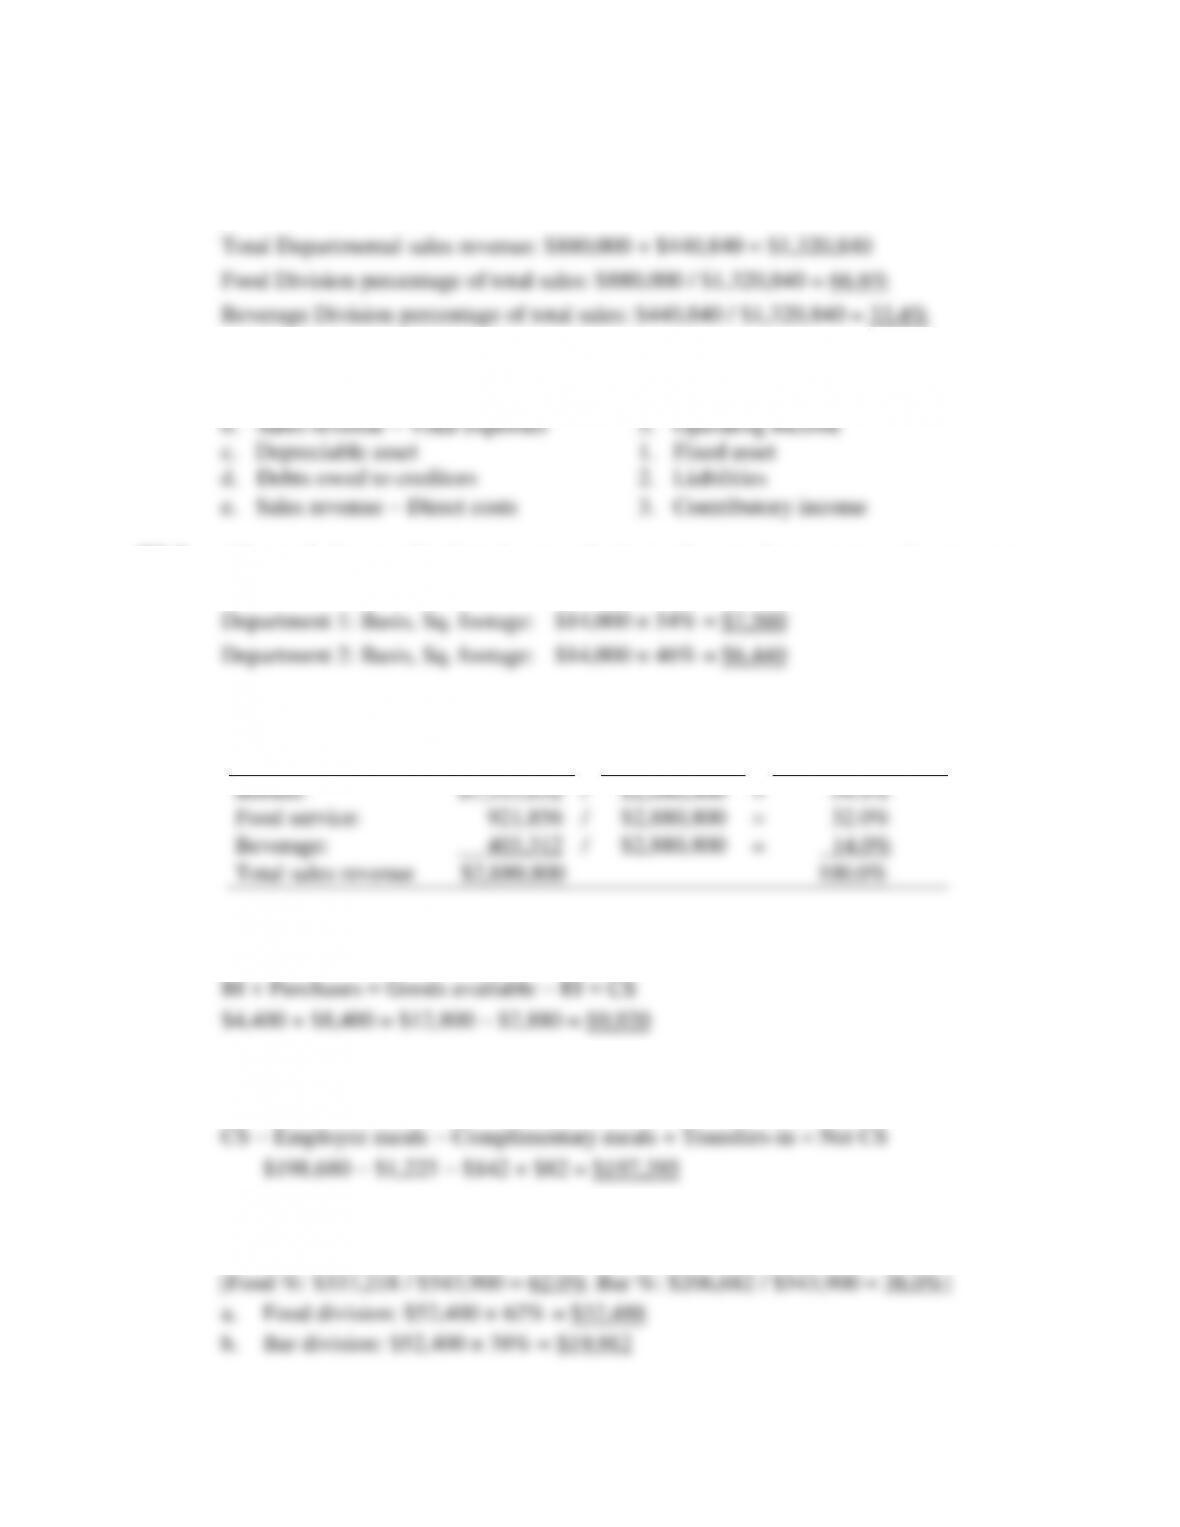
E2.7 A department has two operating divisions: Food service with sales revenue of $880,000
and a bar-lounge with sales revenue of $440,840. Calculate the sales revenue of each
division as a percentage of total departmental sales revenue.
E2.8 Match each of the terms to account categories.
a. Total assets − Total liabilities 4. Owners’ equity (Net assets)
E2.9 Allocate Indirect undistributed cost on the basis of square footage to two departments.
(Cost / Allocation % = the amount allocated)
Department 1: Basis, Sq. footage: $14,000 × 54% = $7,560
E2.10 Find the sales revenue percentage of four different divisions of a department based on
total sales revenue.
Departmental Sales Revenue
/
Total SR
=
SR Percentages
Rooms:
$1,555,632
/
$2,880,800
=
54.0%
Food service:
921,856
/
$2,880,800
=
32.0%
Beverage:
403,312
/
$2,880,800
=
14.0%
Total sales revenue $2,880,800
100.0%
E2.11 A food division had beginning inventory of $4,400, purchases of $8,400 and ending
inventory of $2,880. Determine the cost of goods available and cost of sales (CS):
BI + Purchases = Goods available − EI = CS
E2.12 Cost of sales (CS) is $198,680. Employee meals were $1,225 and complimentary meals
$142. Transfers-in was $82. Determine net cost of sales.
CS − Employee meals − Complimentary meals + Transfers-in = Net CS
E2.13 Sales revenue food division was $337,218 and the sales revenue for the bar lounge was
$206,682. Allocate $52,400 of indirect to each division on the basis of sales revenue.
[Food %: $337,218 / $543,900 = 62.0% Bar %: $206,682 / $543,900 = 38.0%]
25
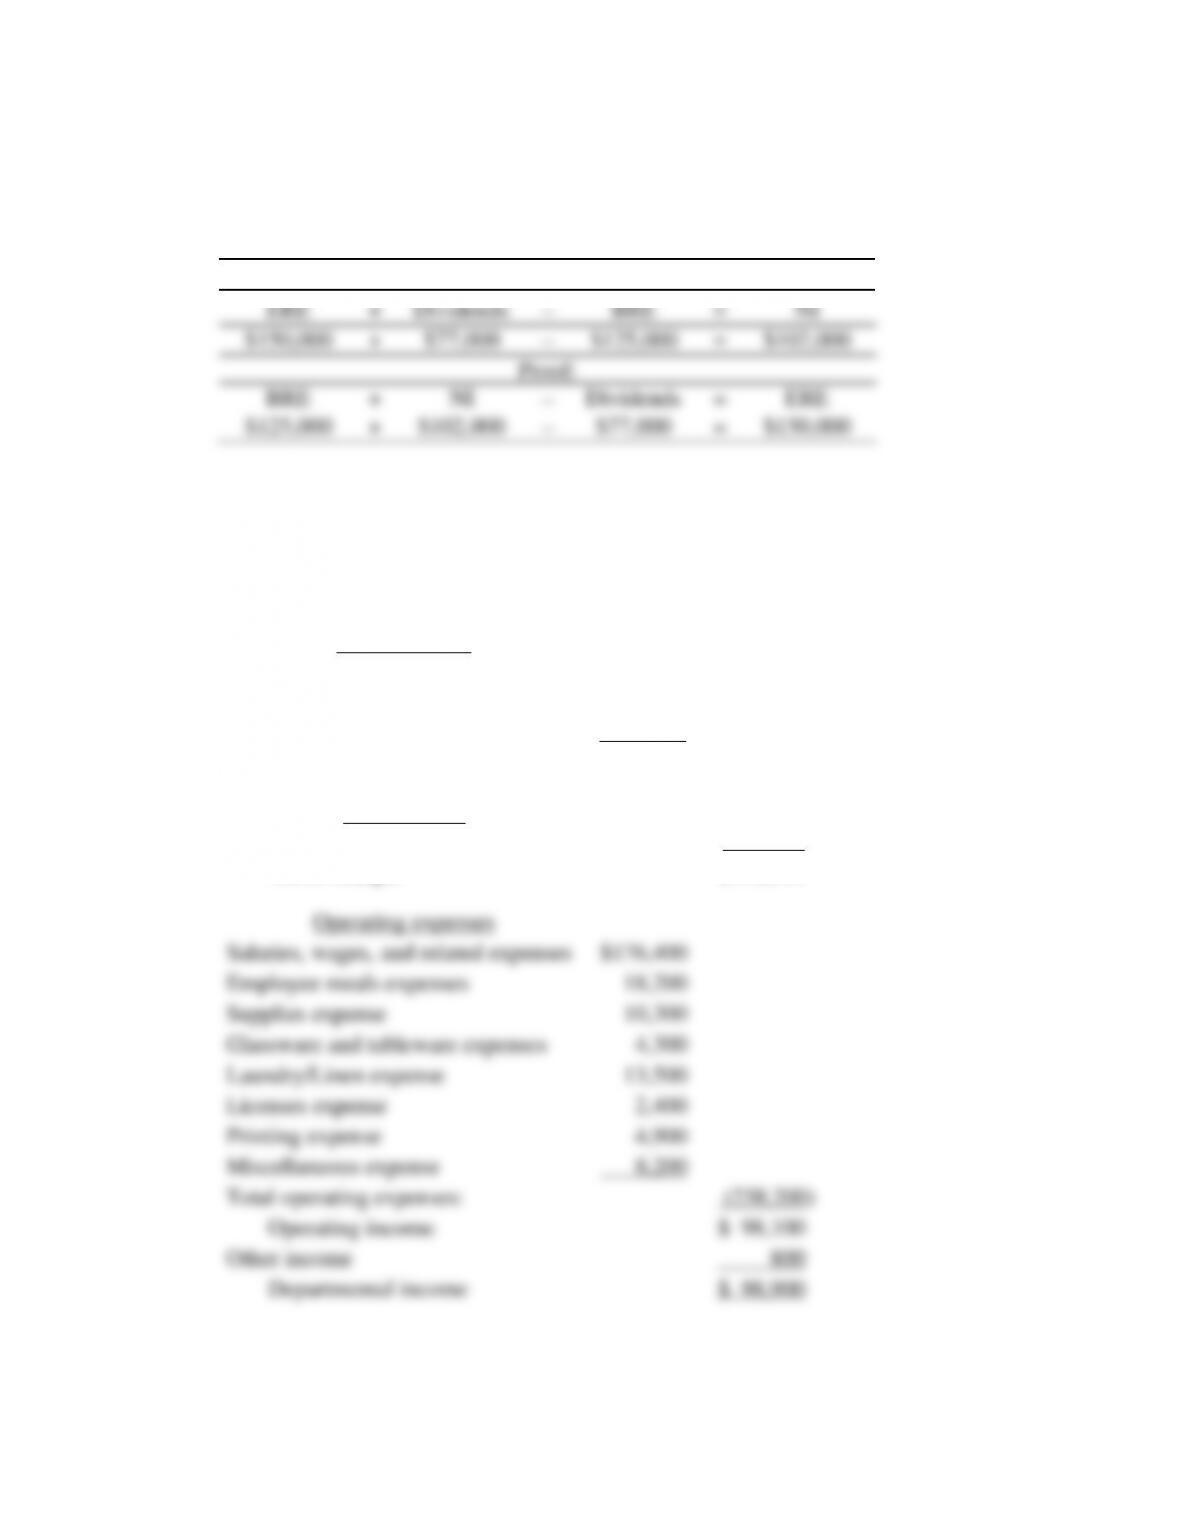
E2.14 Assume the following: Beginning retained earnings (BRE) were $125,000, ending
retained earnings (ERE) were $150,000, and cash dividends of $77,000 were paid
during the year. What was net income for the year?
BRE
+
NI
−
Dividends
=
ERE
$125,000
+
?
−
$77,000
=
$150,000
ERE
+
Dividends
−
BRE
=
NI
$150,000
+
$77,000
−
$125,000
=
$102,000
Proof:
BRE
+
NI
−
Dividends
=
ERE
$125,000
+
$102,000
−
$77,000
=
$150,000
PROBLEM SOLUTIONS
P2.1 Food Department
Income Statement
For the first Quarter ended March 31, 0007
Sales Revenue
Grill Room
$183,200
Coffee Garden
82,900
Banquets
294,400
Total Sales Revenue:
$560,500
Cost of Sales
Net food costs:
224,200)
Gross Margin
$336,300
Operating expenses
Salaries, wages, and related expenses
$176,400
Employee meals expenses
18,200
Supplies expense
10,300
Glassware and tableware expenses
4,300
Laundry/Linen expense
13,500
Licenses expense
2,400
Printing expense
4,900
Miscellaneous expense
8,200
Total operating expenses:
(238,200)
Operating income
$ 98,100
Other income
800
Departmental income
$ 98,900
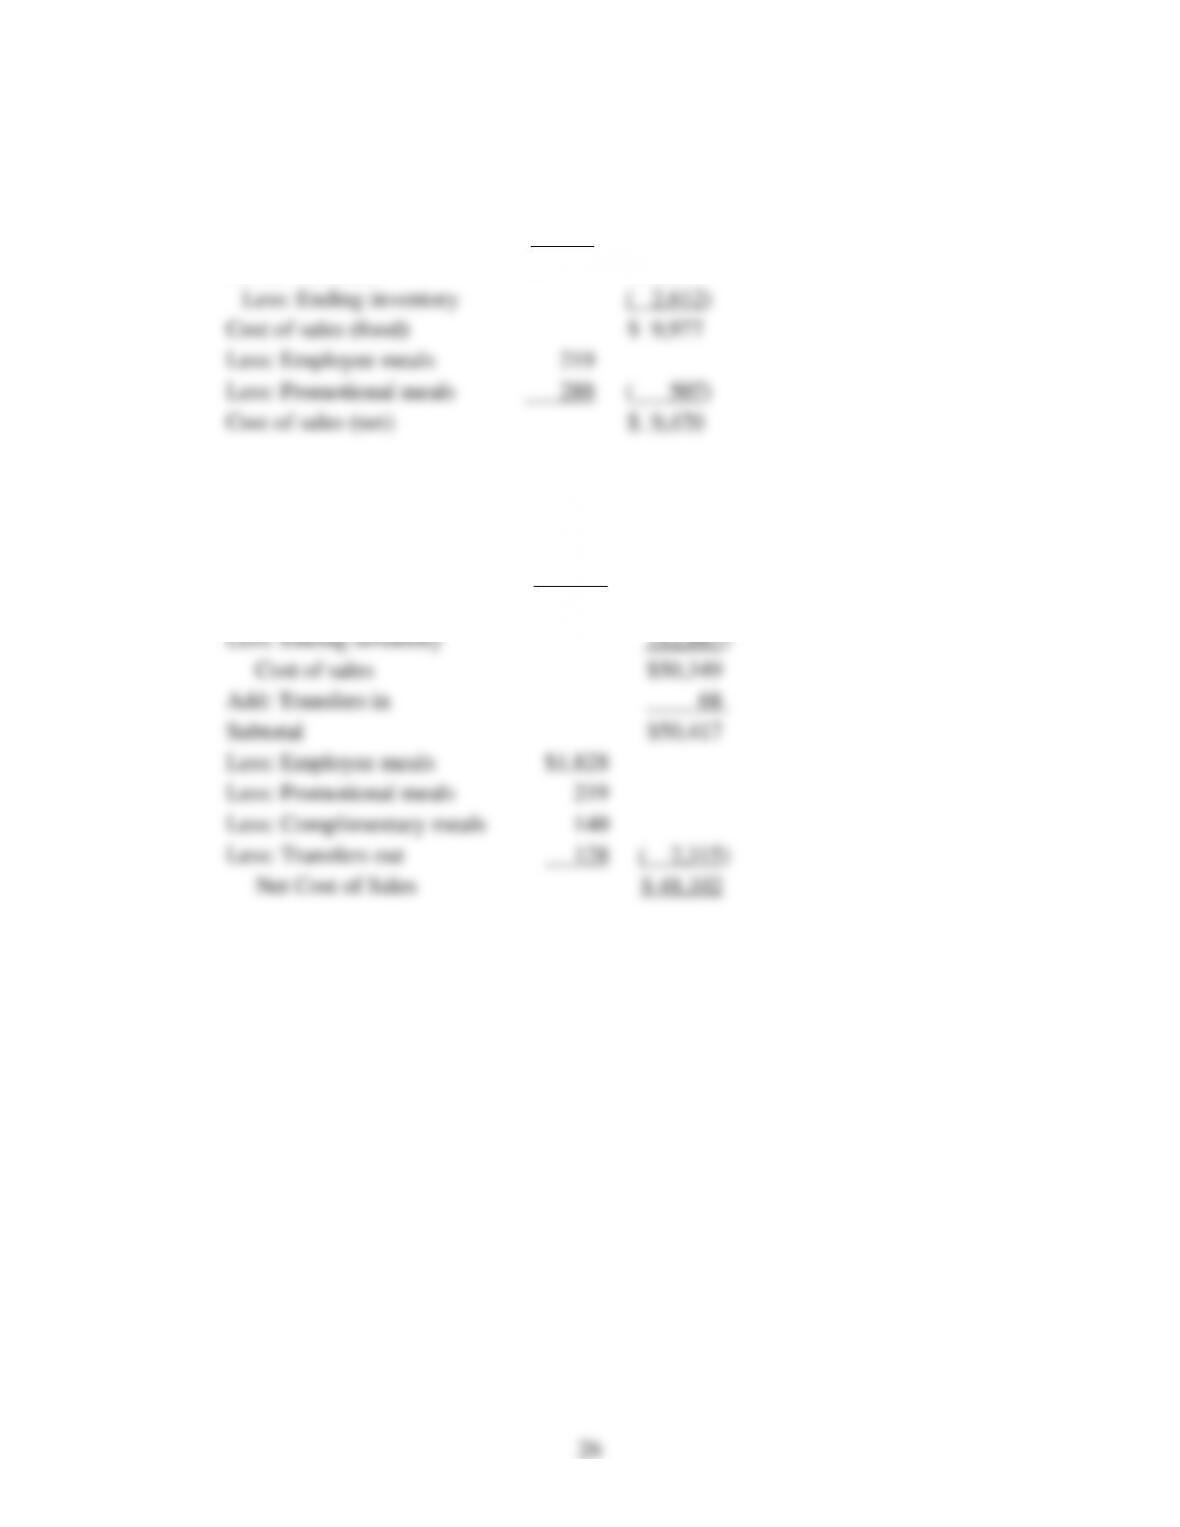
P2.2 Calculate cost of sales food, and net cost of sales.
Beginning inventory
$2,782
Purchases
9,807
Goods available
$12,589
Less: Ending inventory
( 2,612)
Cost of sales (food)
$ 9,977
Less: Employee meals
219
Less: Promotional meals
288
( 507)
Cost of sales (net)
$ 9,470
P2.3 Calculate cost of sales food and net cost of sales.
Beginning inventory
$15,357
Purchases
47,879
Goods available
$63,236
Less: Ending inventory
(12,887)
Cost of sales
$50,349
Add: Transfers in
68
Subtotal
$50,417
Less: Employee meals
$1,828
Less: Promotional meals
219
Less: Complimentary meals
140
Less: Transfers out
128
( 2,315)
Net Cost of Sales
$ 48,102
27
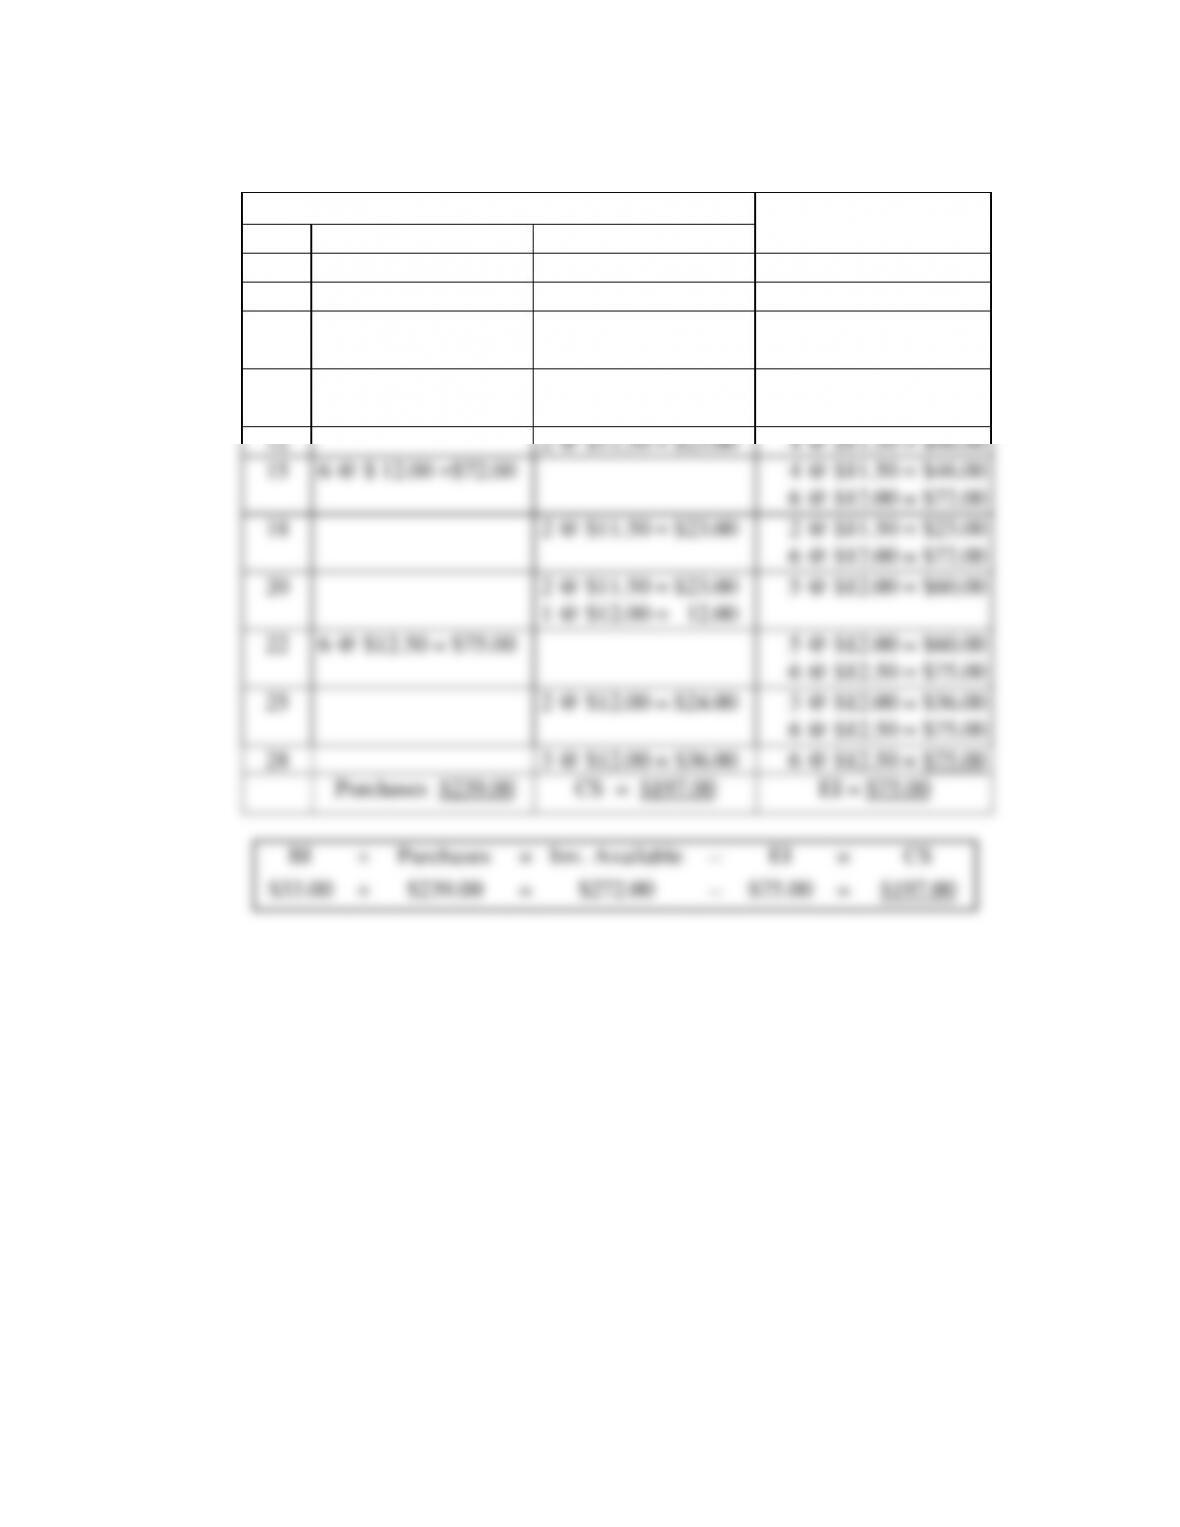
P2.4 a. FIFO perpetual inventory control record:
Item Description: M & B Supreme
Balance Available
June
Purchase-Received
Issued-Sales
Units × Cost = Total
Cost
01
Bal. Fwd.
3 @ $11.00 = $33.00
04
2 @ $11.00 = $22.00
1 @ $11.00 = $11.00
06
8 @ $11.50 = $92.00
1 @ $11.00 = $11.00
8 @ $11.50 = $92.00
09
1 @ $11.00 = $11.00
6 @ $11.50 = $69.00
2 @ $11.50 = 23.00
12
2 @ $11.50 = $23.00
4 @ $11.50 = $46.00
15
6 @ $ 12.00 =$72.00
4 @ $11.50 = $46.00
6 @ $12.00 = $72.00
18
2 @ $11.50 = $23.00
2 @ $11.50 = $23.00
6 @ $12.00 = $72.00
20
2 @ $11.50 = $23.00
5 @ $12.00 = $60.00
1 @ $12.00 = 12.00
22
6 @ $12.50 = $75.00
5 @ $12.00 = $60.00
6 @ $12.50 = $75.00
25
2 @ $12.00 = $24.00
3 @ $12.00 = $36.00
6 @ $12.50 = $75.00
28
3 @ $12.00 = $36.00
6 @ $12.50 = $75.00
E
n
d
Purchases $239.00
CS = $197.00
EI = $75.00
BI
+
Purchases
=
Inv. Available
−
EI
=
CS
$33.00
+
$239.00
=
$272.00
−
$75.00
=
$197.00
28
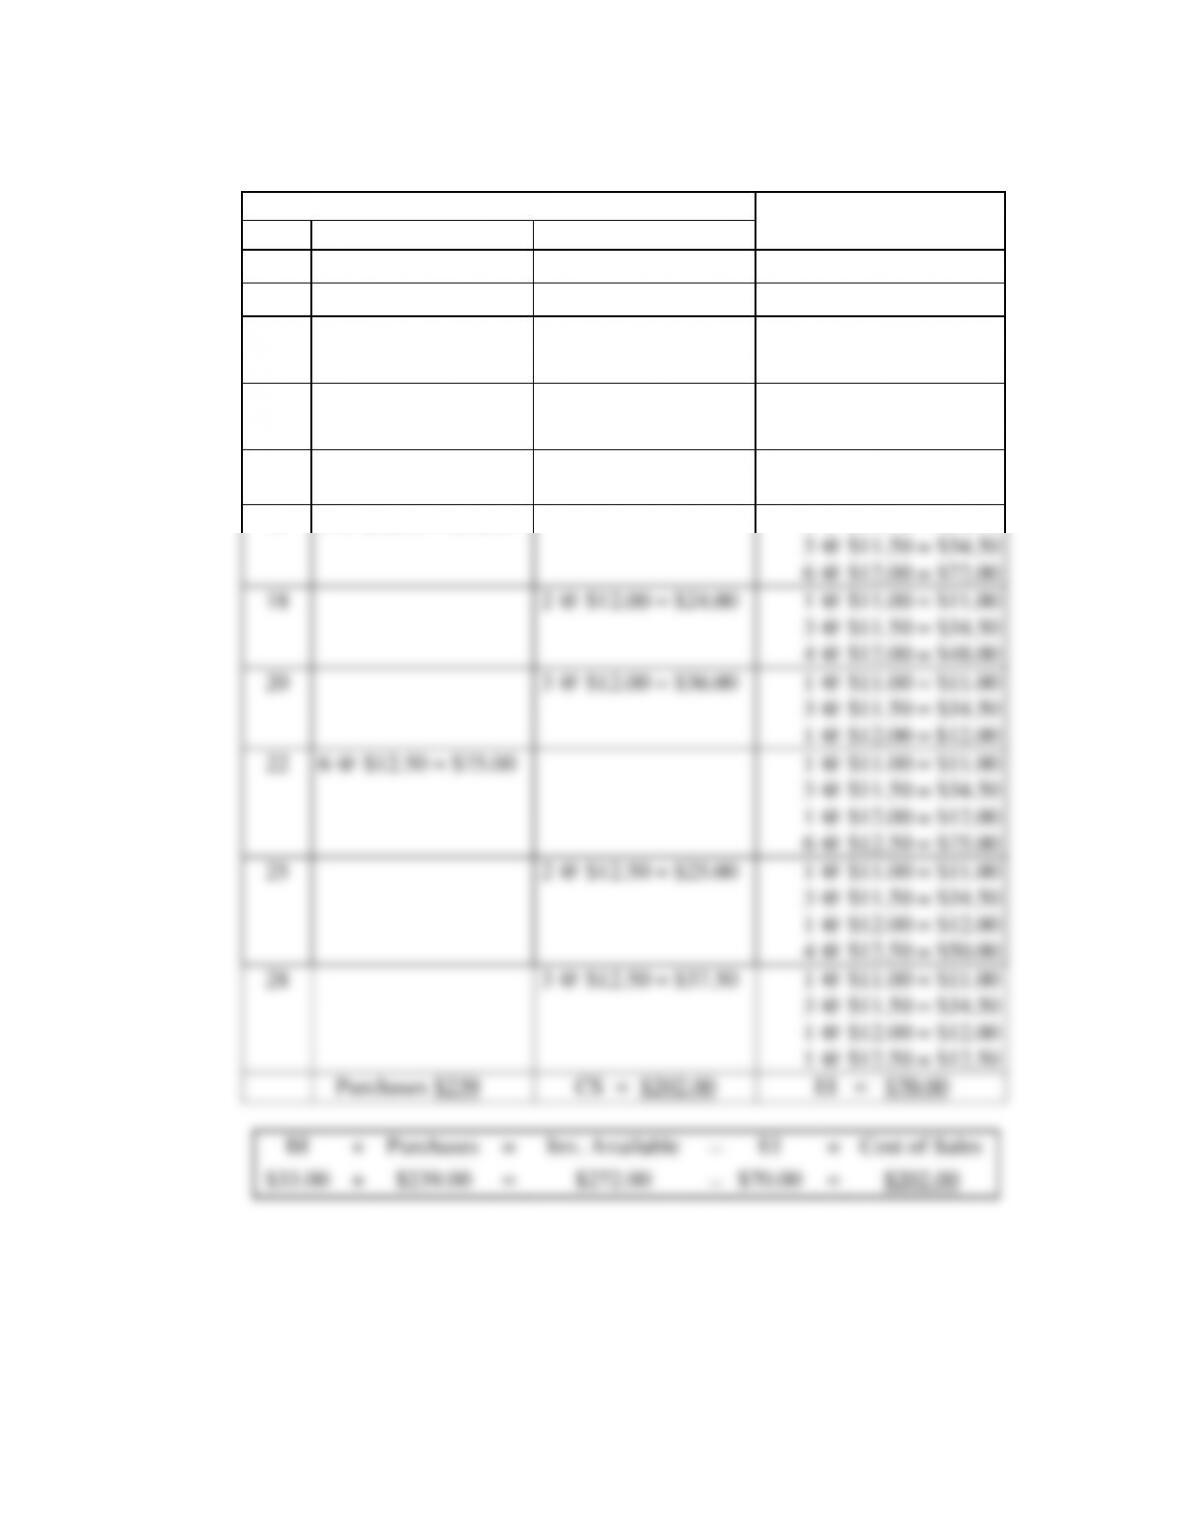
b. LIFO perpetual inventory control record:
Item Description: M & B Supreme
Balance Available
June
Purchase-Received
Issued-Sales
Units × Cost = Total
01
Bal. Fwd.
3 @ $11.00 = $33.00
04
2 @ $11.00 = $22.00
1 @ $11.00 = $11.00
06
8 @ $11.50 = $92.00
1 @ $11.00 = $11.00
8 @ $11.50 = $92.00
09
3 @ $11.50 = $34.50
1 @ $11.00 = $11.00
5 @ $11.50 = $57.50
12
2 @ $11.50 = $23.00
1 @ $11.00 = $11.00
3 @ $11.50 = $34.50
15
6 @ $12.00 = $72.00
1 @ $11.00 = $11.00
3 @ $11.50 = $34.50
6 @ $12.00 = $72.00
18
2 @ $12.00 = $24.00
1 @ $11.00 = $11.00
3 @ $11.50 = $34.50
4 @ $12.00 = $48.00
20
3 @ $12.00 = $36.00
1 @ $11.00 = $11.00
3 @ $11.50 = $34.50
1 @ $12.00 = $12.00
22
6 @ $12.50 = $75.00
1 @ $11.00 = $11.00
3 @ $11.50 = $34.50
1 @ $12.00 = $12.00
6 @ $12.50 = $75.00
25
2 @ $12.50 = $25.00
1 @ $11.00 = $11.00
3 @ $11.50 = $34.50
1 @ $12.00 = $12.00
4 @ $12.50 = $50.00
28
3 @ $12.50 = $37.50
1 @ $11.00 = $11.00
3 @ $11.50 = $34.50
1 @ $12.00 = $12.00
1 @ $12.50 = $12.50
E
n
d
Purchases $239
$239.00
CS = $202.00
EI = $70.00
BI
+
Purchases
=
Inv. Available
−
EI
=
Cost of Sales
$33.00
+
$239.00
=
$272.00
−
$70.00
=
$202.00
29
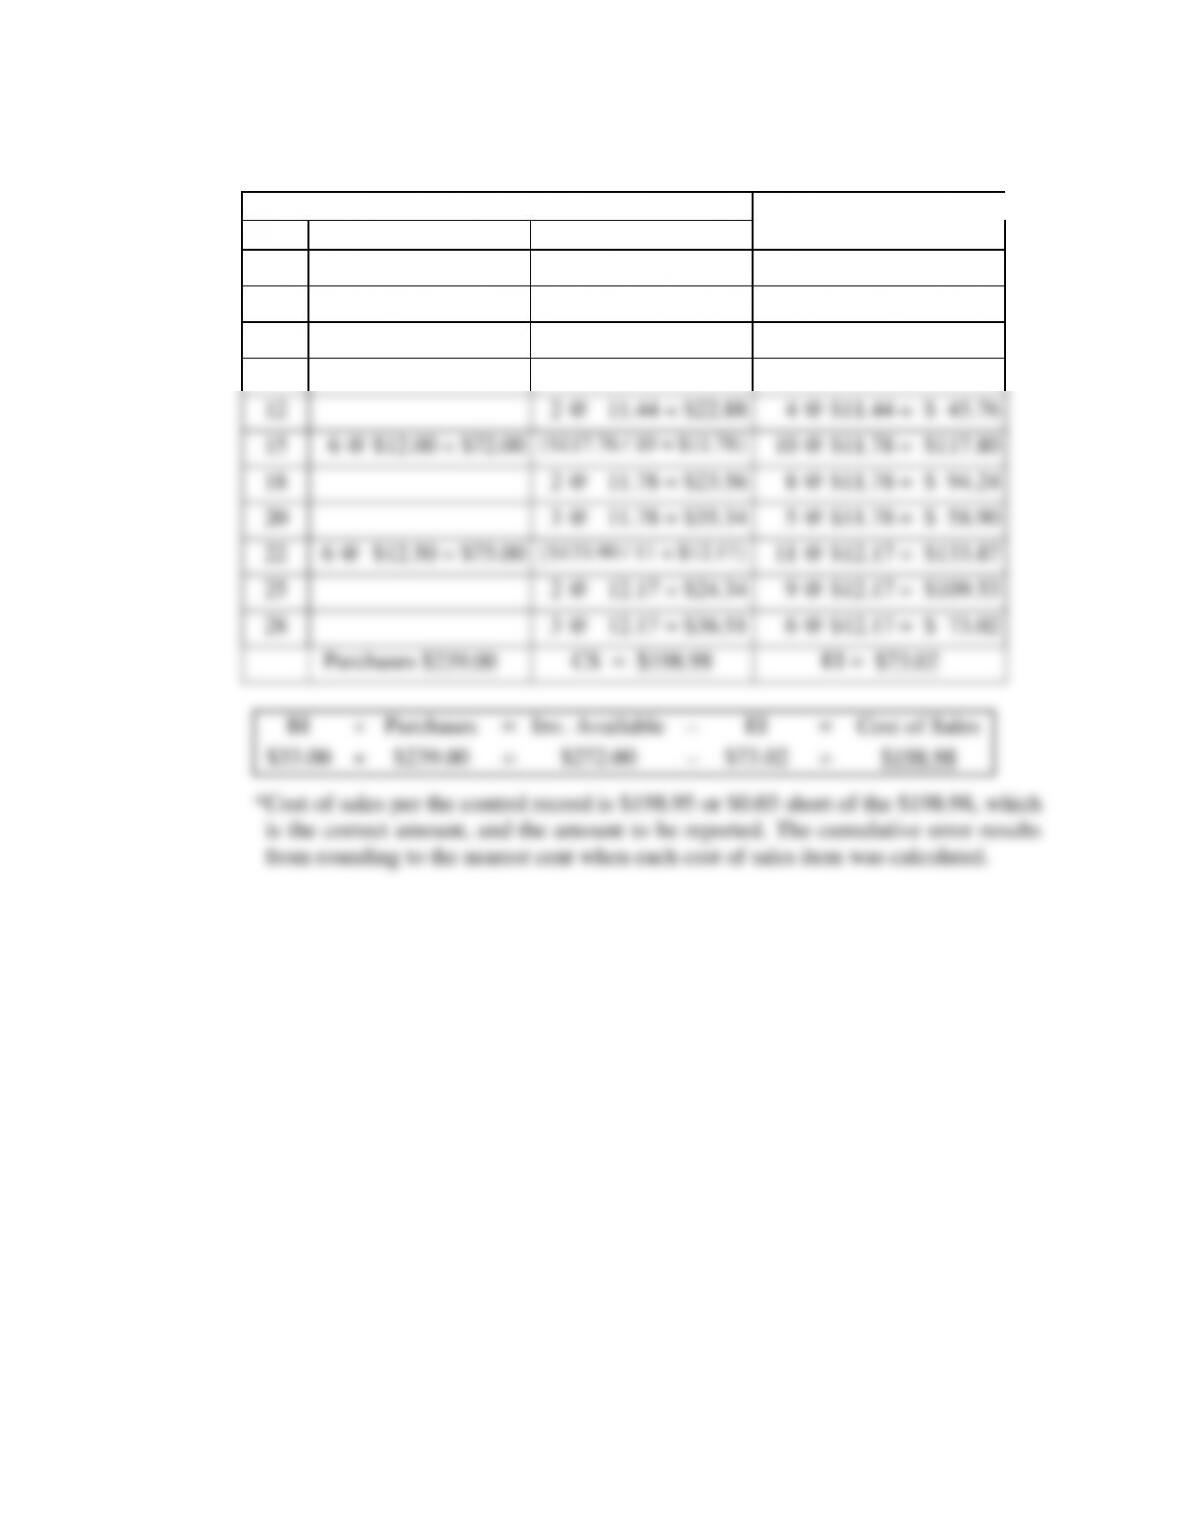
c. Weighted average perpetual inventory control record:
Item Description: M & B Supreme
Balance available
June
Purchase-Received
Issued-Sales
Units × Cost = Total
01
Bal. Fwd.
3 @ $11.00 = $ 33.00
04
2 @ $11.00 = $22.00
1 @ $11.00 = $ 11.00
06
8 @ $11.50 = $92.00
{$103.00 / 9 = 11.44}
9 @ $11.44 = $102.96
09
3 @ $11.44 = $34.32
6 @ $11.44 = $ 68.64
12
2 @ 11.44 = $22.88
4 @ $11.44 = $ 45.76
15
6 @ $12.00 = $72.00
{$117.76 / 10 = $11.78}
10 @ $11.78 = $117.80
18
2 @ 11.78 = $23.56
8 @ $11.78 = $ 94.24
20
3 @ 11.78 = $35.34
5 @ $11.78 = $ 58.90
22
6 @ $12.50 = $75.00
{$133.90 / 11 = $12.17}
11 @ $12.17 = $133.87
25
2 @ 12.17 = $24.34
9 @ $12.17 = $109.53
28
3 @ 12.17 = $36.51
6 @ $12.17 = $ 73.02
E
n
d
Purchases $239.00
CS = $198.98
EI = $73.02
BI
+
Purchases
=
Inv. Available
−
EI
=
Cost of Sales
$33.00
+
$239.00
=
$272.00
−
$73.02
=
$198.98
*Cost of sales per the control record is $198.95 or $0.03 short of the $198.98, which
is the correct amount, and the amount to be reported. The cumulative error results
from rounding to the nearest cent when each cost of sales item was calculated.
/
=
/
=
Total %
5,020
2,710
2,270
10,000
4,848
6,060
1,212
12,120
5,600
7,000
1,400
14,000
1,600
2,000
Less: Indirect Costs
( 25,092)
+
( 23,522)
+
( 8,506)
=
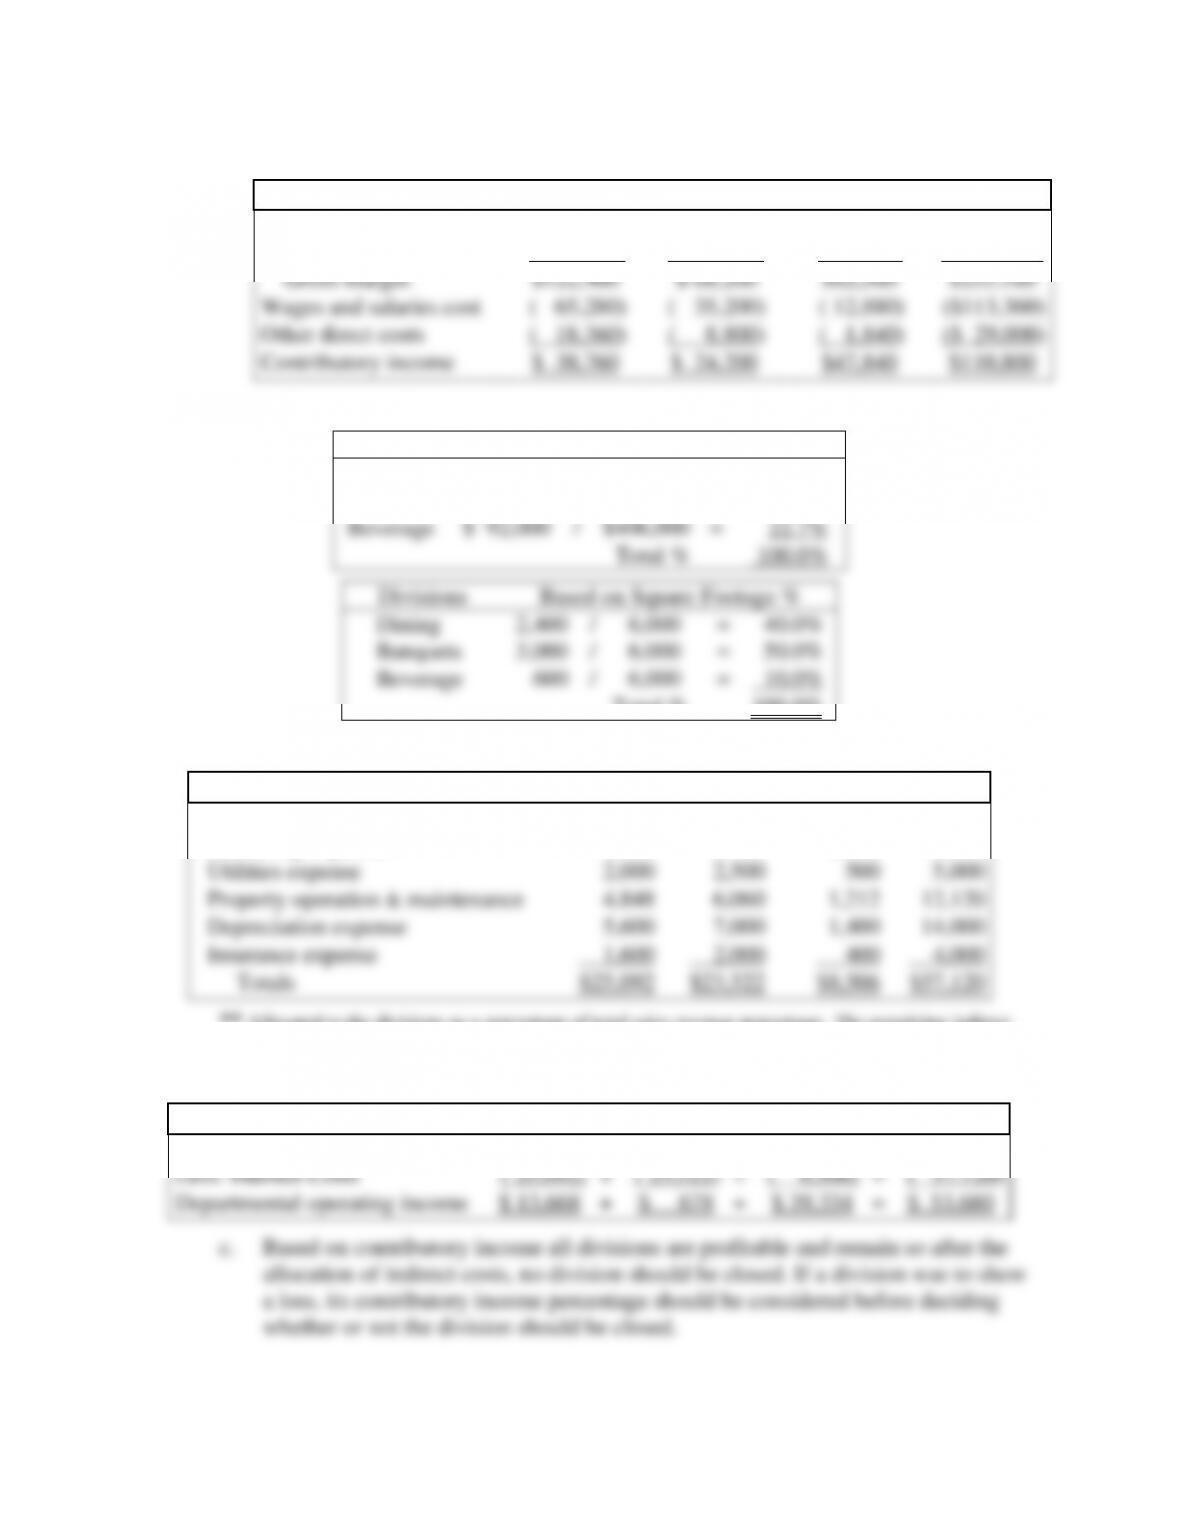
P2.5 a. Consolidated Departmental Contributory Income Statement.
Department
a.
Dinning
Room
Banquets
Beverages
Totals
Sales revenue
$204,000
$110,000
$92,000
$406,000
Cost of sales
( 81,600)
( 41,800)
( 29,440)
($152,840)
Gross margin
$122,400
$ 68,200
$62,560
$253,160
Wages and salaries cost
( 65,280)
( 35,200)
( 12,880)
($113,360)
Other direct costs
( 18,360)
( 8,800)
( 1,840)
($ 29,000)
Contributory income
$ 38,760
$ 24,200
$47,840
$110,800
b. Indirect costs allocation percentages on the basis of SR and sq. footage.
Divisions
Basis: Sales Revenue %
Dining
$204,000
/
$406,000
=
50.2%
Banquets
$110,000
/
$406,000
=
27.1%
Beverage
$ 92,000
/
$406,000
=
22.7%
Total %
100.0%
31
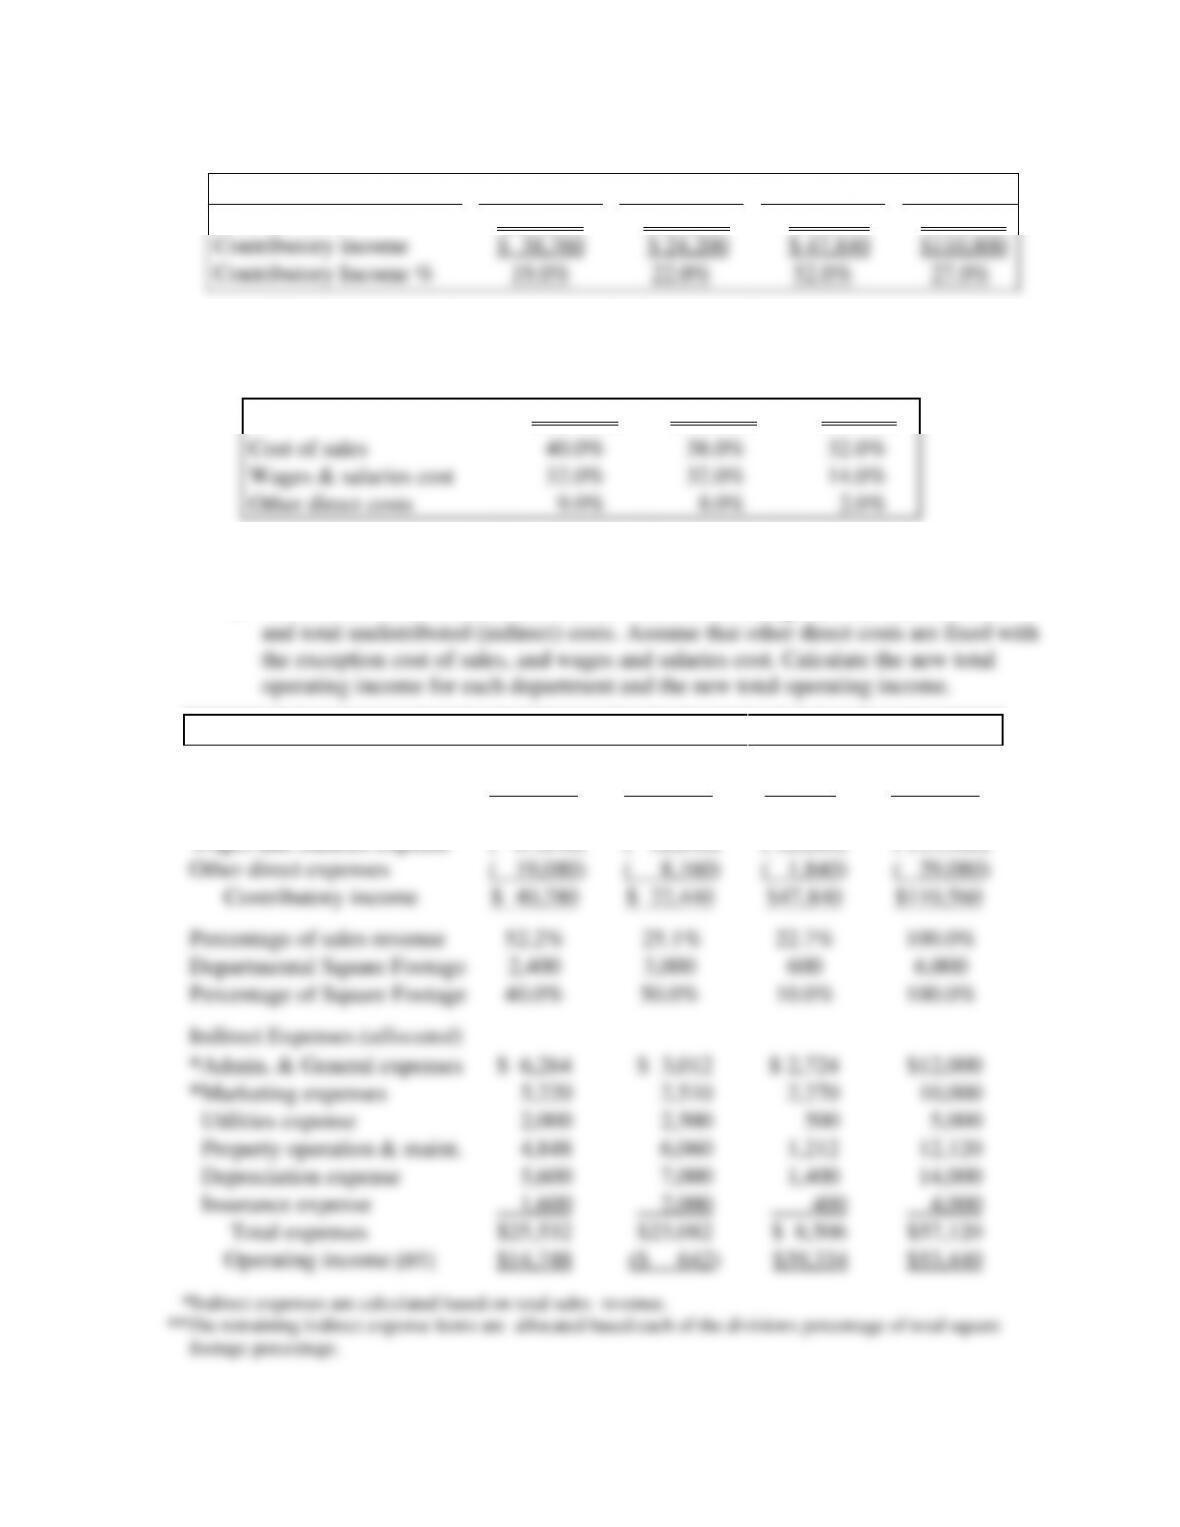
P2.6 a. Calculate each division and the department’s contributory income percentages.
Departmental Divisions
c.
Dining
Banquets
Beverages
Totals
Sales revenue
$204,000
$110,000
$ 92,000
$406,000
Contributory income
$ 38,760
$ 24,200
$ 47,840
$110,800
Contributory Income %
19.0%
22.0%
52.0%
27.0%
b. Calculate the cost of sales, wages and salaries, and direct costs as a percentage on
the basis of sales revenue for each division of the department.
Departmental Divisions
d.
Dinning
Banquet
Beverages
Sales revenue
$204,000
$110,000
$92,000
Cost of sales
40.0%
38.0%
32.0%
Wages & salaries cost
32.0%
32.0%
14.0%
Other direct costs
9.0%
8.0%
2.0%
c. The overall operating income would decrease because the contributory income
from the dining room as a percentage of sales revenue is lower than from banquets.
d. Assume the shift of $8,000 does occur. There is no change in total sales revenue
Department
Dining
Banquets
Beverages
Totals
Sales revenue
$212,000
$102,000
$92,000
$406,000
Cost of Sales
( 84,800)
( 38,760)
(29,440)
( 153,000)
Gross Margin
$127,200
$ 63,240
$62,560
$253,000
Wages and Salaries expense
( 67,840)
( 32,640)
( 12,880)
( 113,360)
Other direct expenses
( 19,080)
( 8,160)
( 1,840)
( 29,080)
Contributory income
$ 40,280
$ 22,440
$47,840
$110,560
Percentage of sales revenue
52.2%
25.1%
22.7%
100.0%
Departmental Square Footage
2,400
3,000
600
6,000
Percentage of Square Footage
40.0%
50.0%
10.0%
100.0%
Indirect Expenses (allocated)
*Admin. & General expenses
$ 6,264
$ 3,012
$ 2,724
$12,000
*Marketing expenses
5,220
2,510
2,270
10,000
Utilities expense
2,000
2,500
500
5,000
Property operation & maint.
4,848
6,060
1,212
12,120
Depreciation expense
5,600
7,000
1,400
14,000
Insurance expense
1,600
2,000
400
4,000
Total expenses
$25,532
$23,082
$ 8,506
$57,120
Operating income [BT]
$14,748
($ 642)
$39,334
$53,440
*Indirect expenses are calculated based on total sales revenue.
**The remaining indirect expense items are allocated based each of the divisions percentage of total square
footage percentage.
32
e. Do not close any department. Each department is making positive contributory income.
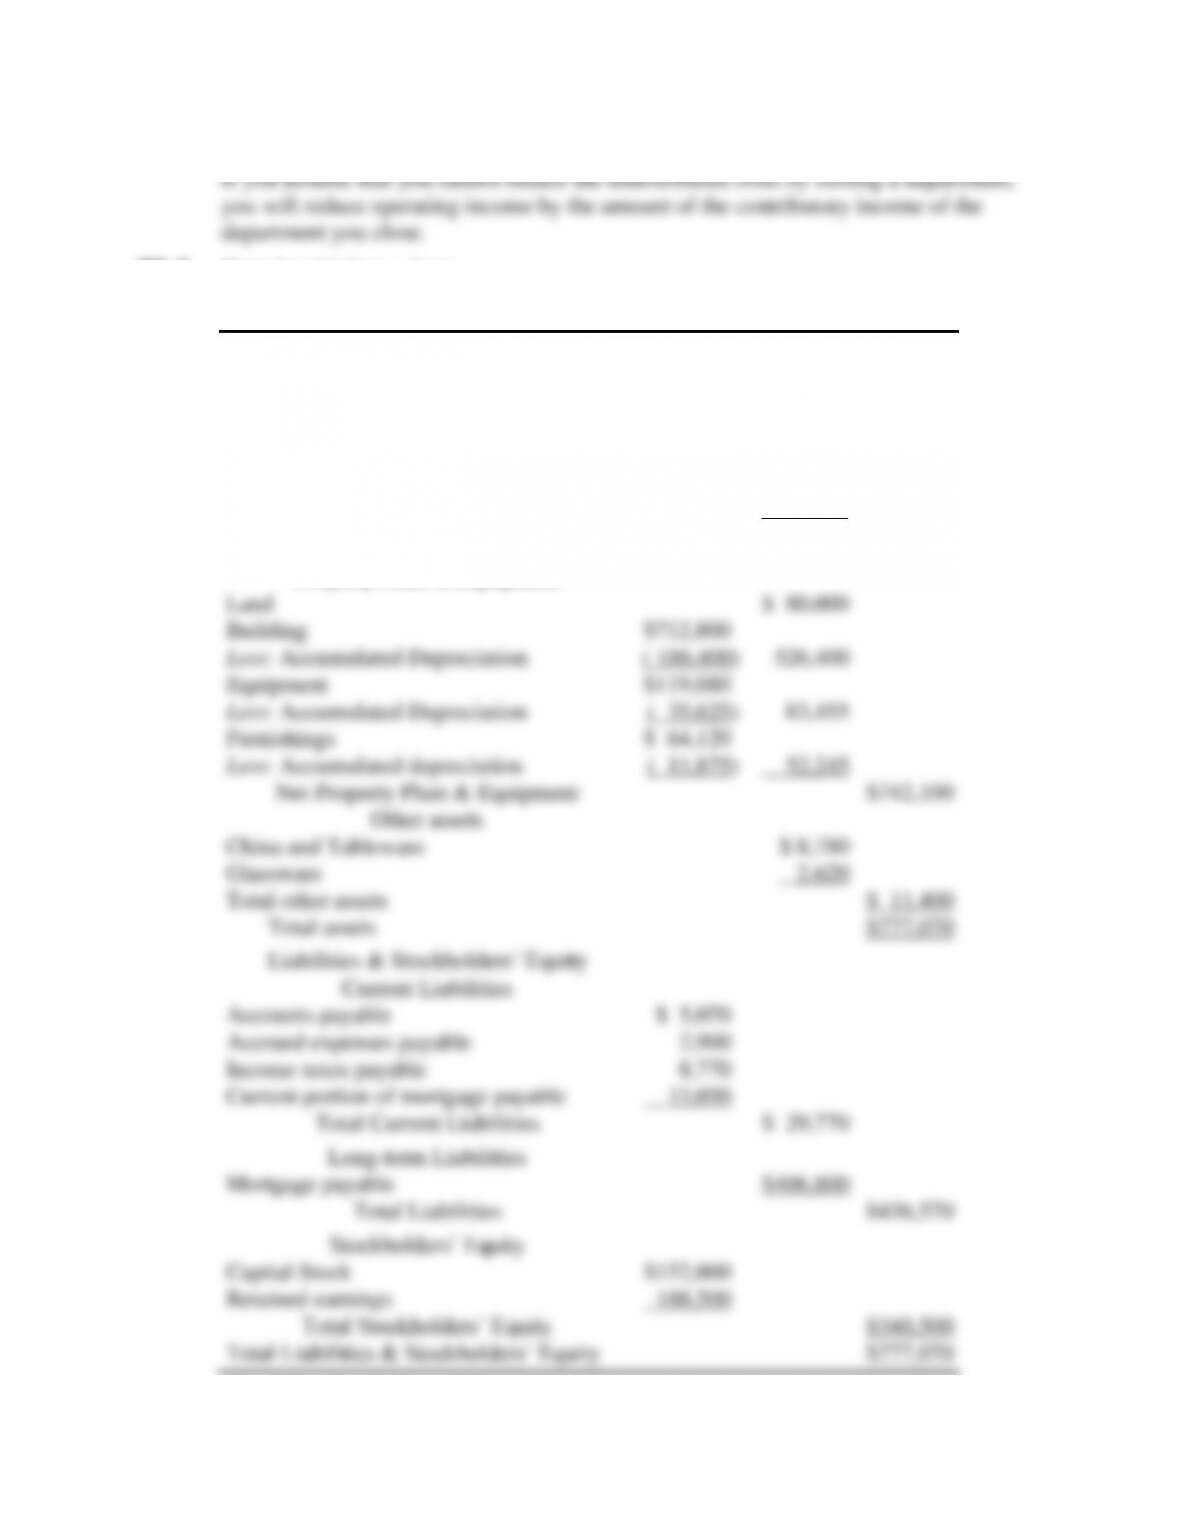
P2.7 Completed balance sheet.
Balance Sheet
For the First Quarter Ended March 31, 0007
ASSETS
Current Assets
Cash
$ 10,109
Credit card receivables
1,554
Accounts receivable
1,882
Inventories
7,225
Prepaid expenses
2,800
Total Current Assets
$ 23,570
Property Plant & Equipment
Land
$ 80,000
Building
$712,800
Less: Accumulated Depreciation
( 186,400)
526,400
Equipment
$119,080
Less: Accumulated Depreciation
( 35,625)
83,455
Furnishings
$ 64,120
Less: Accumulated depreciation
( 11,875)
52,245
Net Property Plant & Equipment
$742,100
Other assets
China and Tableware
$ 8,780
Glassware
2,620
Total other assets
$ 11,400
Total assets
$777,070
Liabilities & Stockholders’ Equity
Current Liabilities
Accounts payable
$ 5,070
Accrued expenses payable
2,900
Income taxes payable
8,770
Current portion of mortgage payable
13,030
Total Current Liabilities
$ 29,770
Long-term Liabilities
Mortgage payable
$406,800
Total Liabilities
$436,570
Stockholders’ Equity
Capital Stock
$152,000
Retained earnings
188,500
Total Stockholders’ Equity
$340,500
Total Liabilities & Stockholders’ Equity
$777,070
33
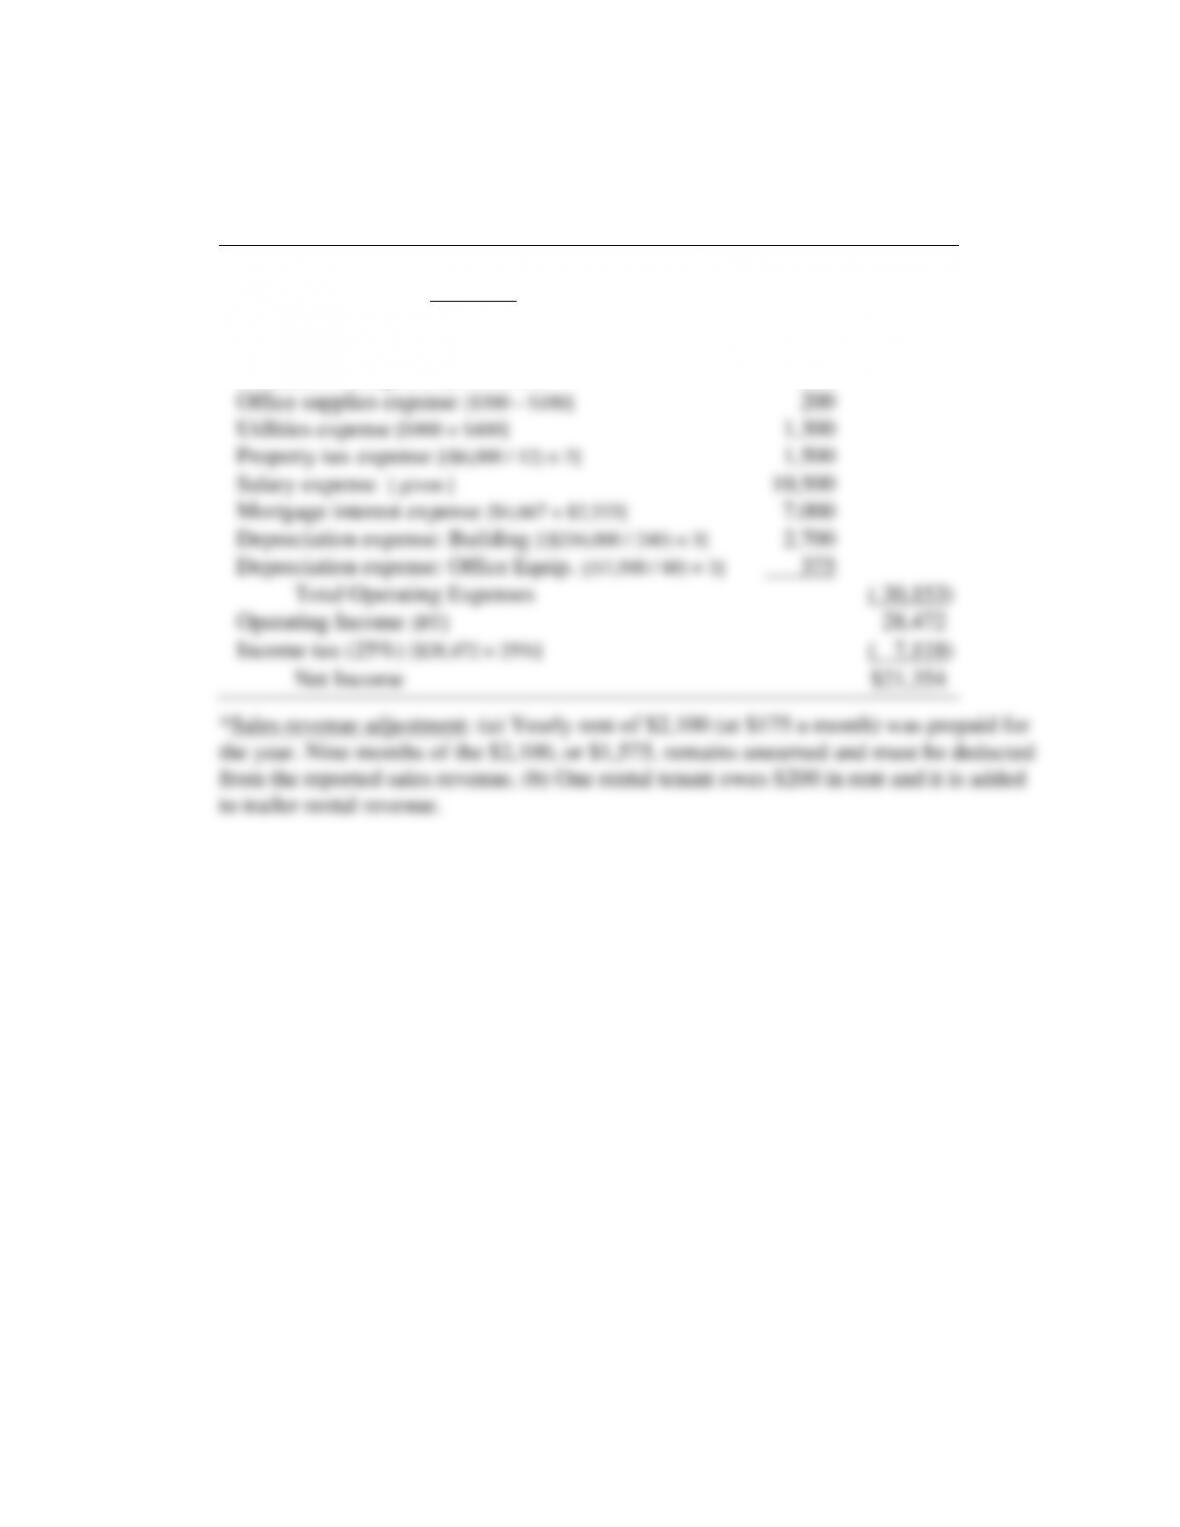
P2.8 Prepare a quarterly income statement.
Jarvis Trailer Park Income Statement
For the First Quarter Ended March 31, 0007
Trailer rental revenue [$60,000 + $200 – $1,575]*
$58,625
Expenses
Insurance expense [ $4,800 × 3/12 ]
$ 1,200
Wages expense [(5 × $9.95 × 8) + $4,500]
4,898
Maintenance expense [$80 + $400]
480
Office supplies expense [$300 – $100]
200
Utilities expense [$900 + $400]
1,300
Property tax expense [($6,000 / 12) × 3]
1,500
Salary expense [ given ]
10,500
Mortgage interest expense [$4,667 + $2,333]
7,000
Depreciation expense: Building [($216,000 / 240) × 3]
2,700
Depreciation expense: Office Equip. [($7,500 / 60) × 3]
375
Total Operating Expenses
( 30,153)
Operating Income [BT]
28,472
Income tax (25%) [$28,472 × 25%]
( 7,118)
Net Income
$21,354
*Sales revenue adjustment: (a) Yearly rent of $2,100 (at $175 a month) was prepaid for
the year. Nine months of the $2,100, or $1,575, remains unearned and must be deducted
from the reported sales revenue. (b) One rental tenant owes $200 in rent and it is added
to trailer rental revenue.
34
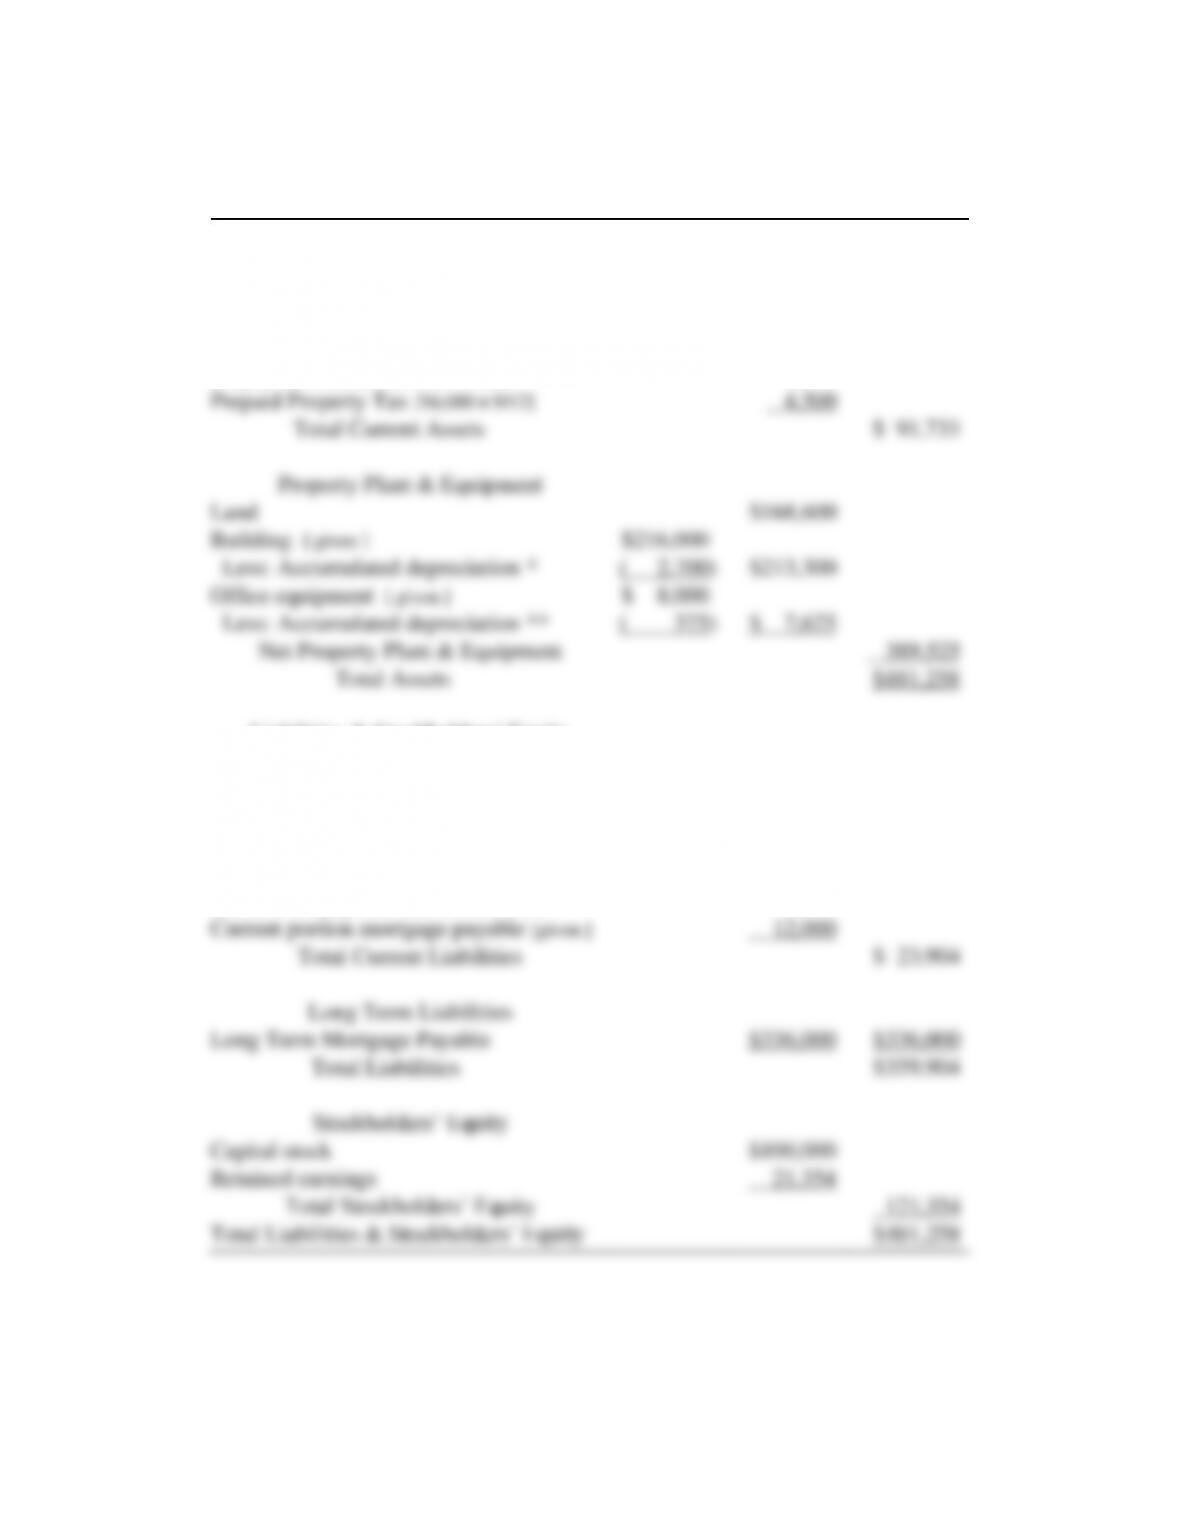
P2.8 (Continued) Jarvis Trailer Park
Balance Sheet
For the Quarter Ending March 31, 0007
Assets
Current Assets
Cash [$510,000 – $426,667]
$ 83,333
Accounts Receivable [ given ]
200
Office Supplies [$200 – $100 ]
100
Prepaid Insurance [$4,800 x 9/12]
3,600
Prepaid Property Tax [$6,000 x 9/12]
4,500
Total Current Assets
$ 91,733
Property Plant & Equipment
Land
$168,600
Building [ given ]
$216,000
Less: Accumulated depreciation *
( 2,700)
$213,300
Office equipment [ given ]
$ 8,000
Less: Accumulated depreciation **
( 375)
$ 7,625
Net Property Plant & Equipment
389,525
Total Assets
$481,258
Liabilities & Stockholders’ Equity
Current Liabilities
Accounts payable [ $80 + $400 ]
$ 480
Wages payable [ $9.95 x 8 hrs x 5 days ]
398
Interest payable [ given ]
2,333
Unearned rental revenue [ $175 x 9 ]
1,575
Income tax payable [ $28,472 x 25%]
7,118
Current portion mortgage payable [given ]
12,000
Total Current Liabilities
$ 23,904
Long Term Liabilities
Long Term Mortgage Payable
$336,000
$336,000
Total Liabilities
$359,904
Stockholders’ Equity
Capital stock
$100,000
Retained earnings
21,354
Total Stockholders’ Equity
121,354
Total Liabilities & Stockholders’ Equity
$481,258
35
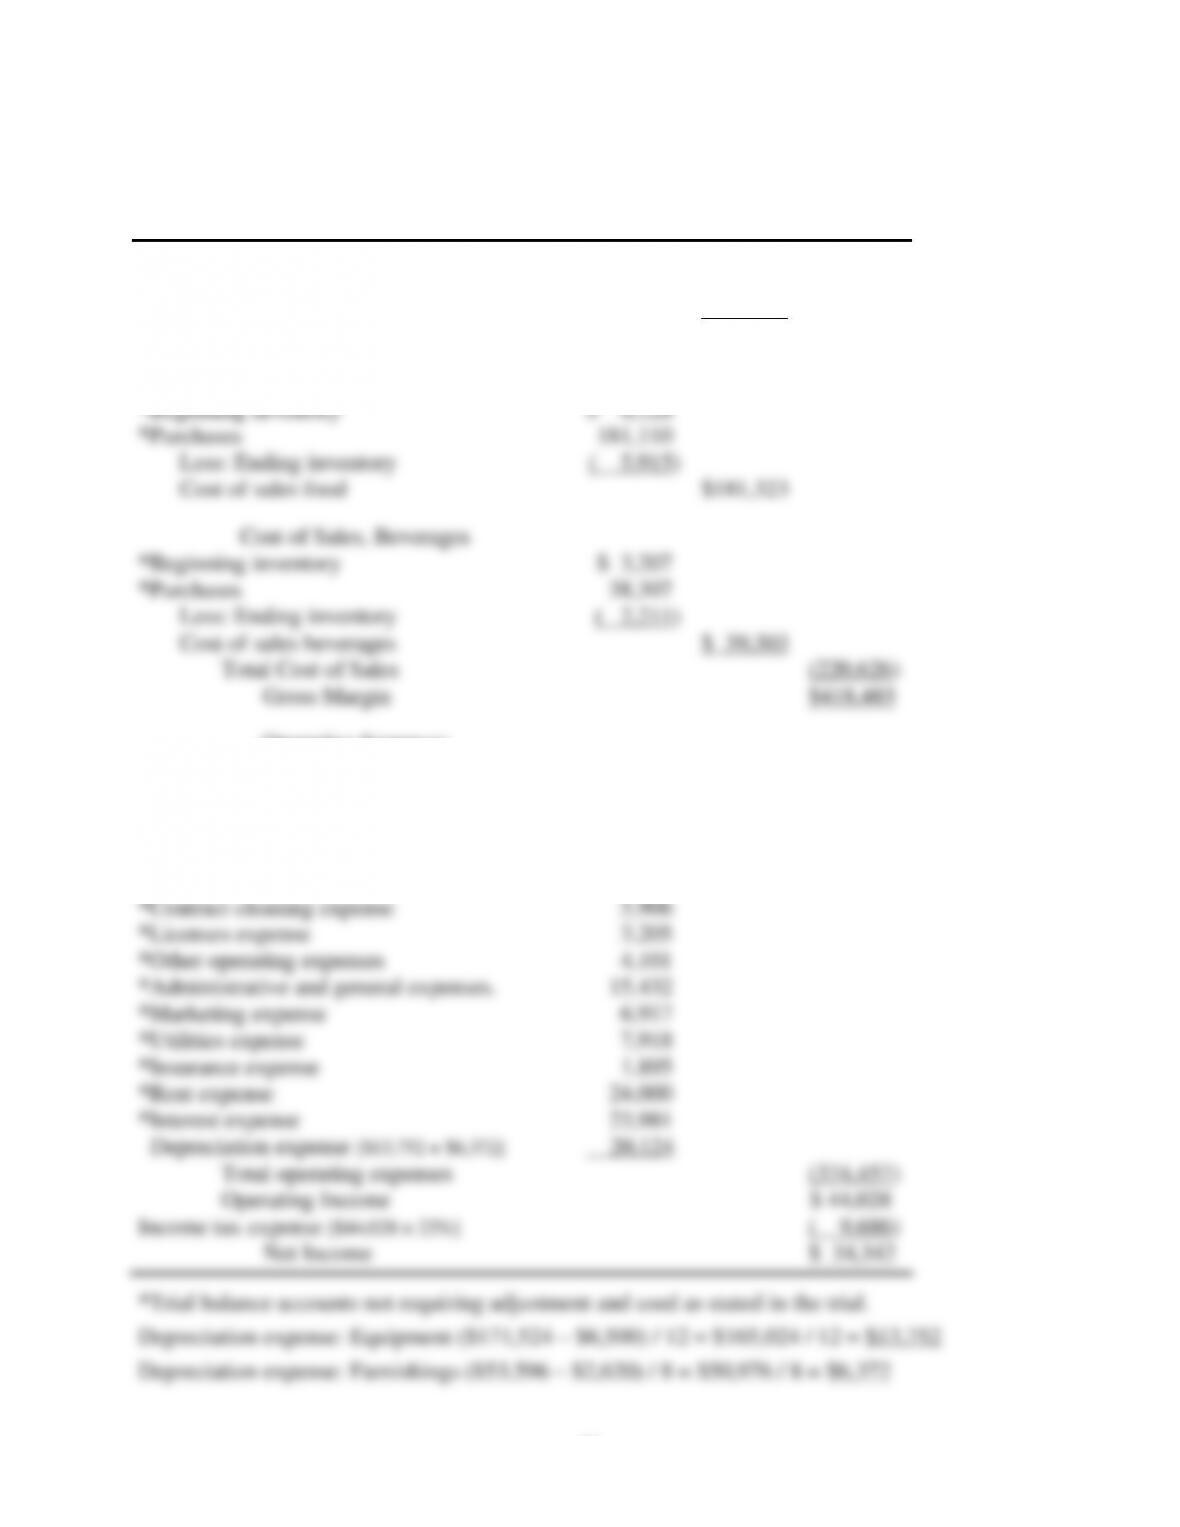
CASE 2 SOLUTION
Part (1) 4C Company Income Statement
For the year ended December 31, 2007
Sales Revenue
*Food operations
$458,602
*Beverage operations
180,509
Total sales revenue
$639,111
Cost of Sales, Food
*Beginning inventory
$ 6,128
*Purchases
181,110
Less: Ending inventory
( 5,915)
Cost of sales food
$181,323
Cost of Sales, Beverages
*Beginning inventory
$ 3,207
*Purchases
38,307
Less: Ending inventory
( 2,211)
Cost of sales beverages
$ 39,303
Total Cost of Sales
(220,626)
Gross Margin
$418,485
Operating Expenses
Salaries and wages expense [$221,328 + $2,215]
$223,543
*Laundry expense
16,609
*Kitchen fuel expense
7,007
*China and tableware expenses
12,214
*Glassware expense
1,605
*Contract cleaning expense
5,906
*Licenses expense
3,205
*Other operating expenses
4,101
*Administrative and general expenses.
15,432
*Marketing expense
6,917
*Utilities expense
7,918
*Insurance expense
1,895
*Rent expense
24,000
*Interest expense
23,981
Depreciation expense [$13,752 + $6,372]
20,124
Total operating expenses
(374,457)
Operating Income
$ 44,028
Income tax expense [$44,028 × 22%]
( 9,686)
Net Income
$ 34,342
*Trial balance accounts not requiring adjustment and used as stated in the trial.
Depreciation expense: Equipment ($171,524 – $6,500) / 12 = $165,024 / 12 = $13,752
Depreciation expense: Furnishings ($53,596 – $2,620) / 8 = $50,976 / 8 = $6,372
36
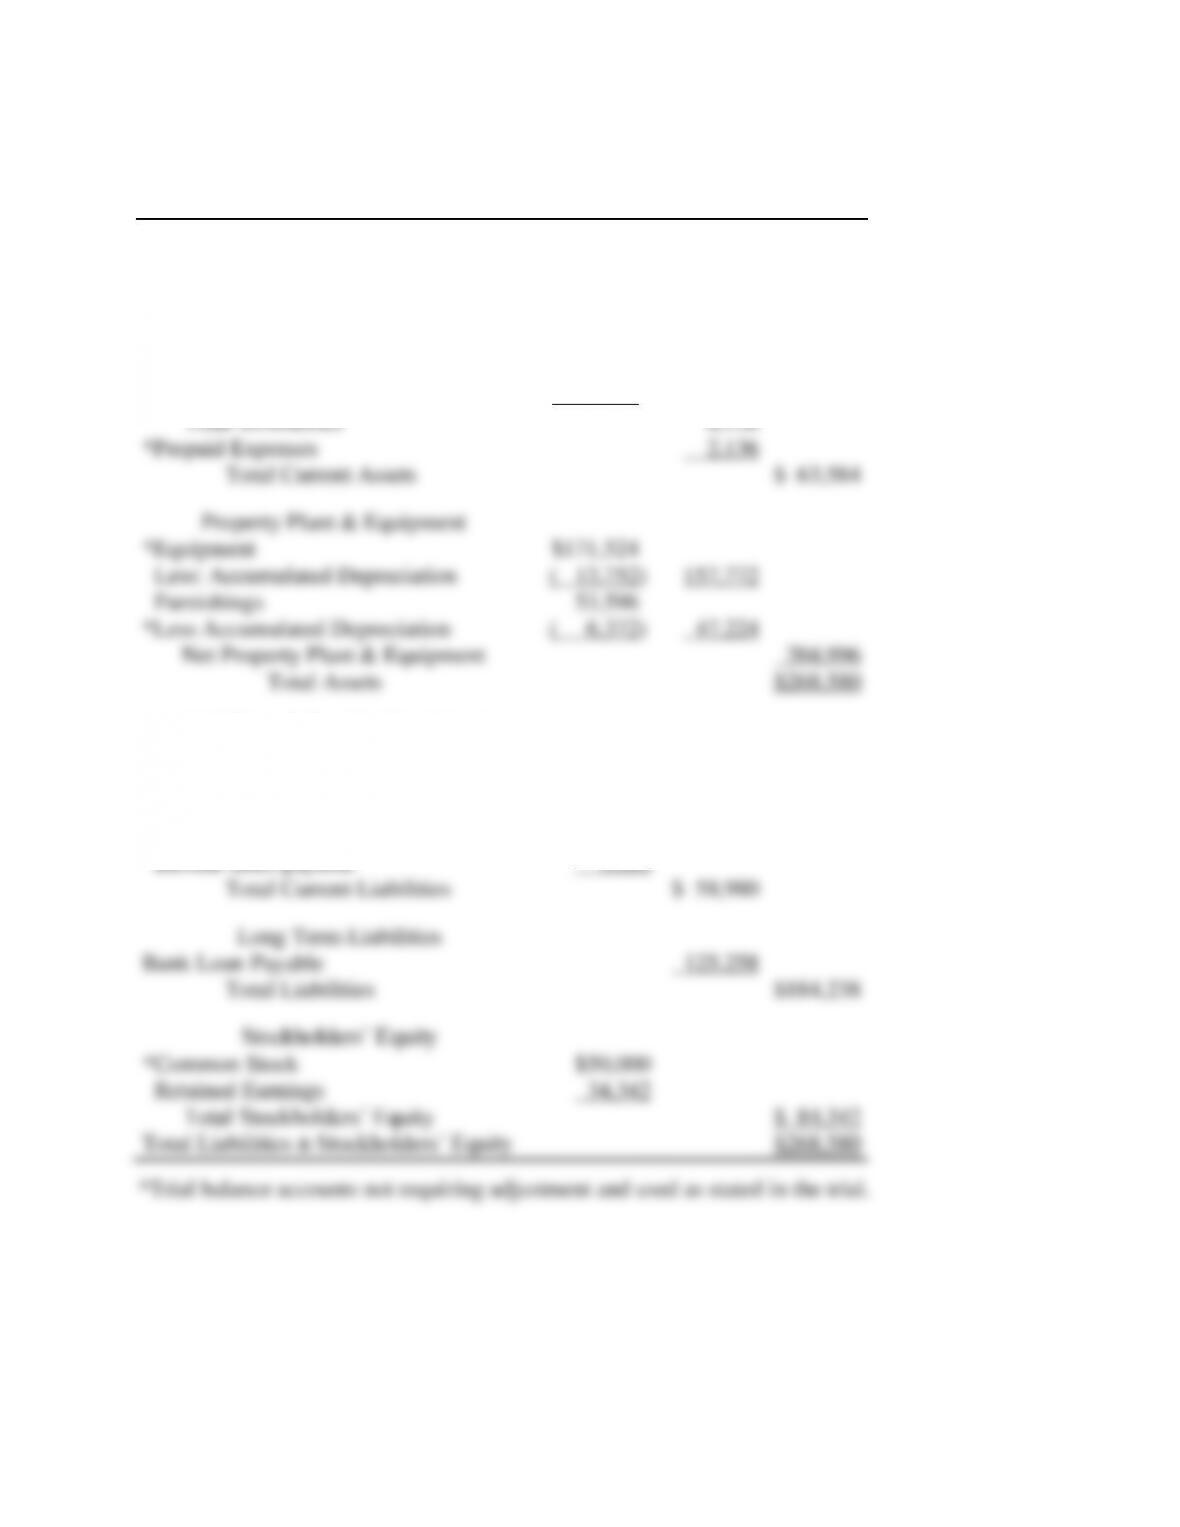
Part (2) 4C Company
Balance Sheet
For the Year Ended December 31, 2007
Assets
Current Assets
*Cash
$ 36,218
*Credit Card Receivables
13,683
*Accounts Receivable
3,421
Inventories Food
$ 5,915
Inventories, Beverages
2,211
Total Inventories
8,126
*Prepaid Expenses
2,136
Total Current Assets
$ 63,584
Property Plant & Equipment
*Equipment
$171,524
Less: Accumulated Depreciation
( 13,752)
157,772
Furnishings
53,596
*Less Accumulated Depreciation
( 6,372)
47,224
Net Property Plant & Equipment
204,996
Total Assets
$268,580
Liabilities & Stockholders’ Equity
Current Liabilities
*Accounts payable
$ 8,819
Accrued payroll payable
2,215
Current portion Bank Loan Payable
38,260
Income taxes payable
9,686
Total Current Liabilities
$ 58,980
Long Term Liabilities
Bank Loan Payable
125,258
Total Liabilities
$184,238
Stockholders’ Equity
*Common Stock
$50,000
Retained Earnings
34,342
Total Stockholders’ Equity
$ 84,342
Total Liabilities & Stockholders’ Equity
$268,580
*Trial balance accounts not requiring adjustment and used as stated in the trial.