205
CHAPTER 13
FEASIBILITY STUDIES — AN INTRODUCTION
INTRODUCTION
In many ways, this chapter can be considered a continuation of Chapter 12. While Chapter 12
covered various methods for evaluating investments in long-term assets for periods up to five or
so years, this chapter takes a look at what is required for very long-term investments in land and
buildings. The chapter describes what is included in a feasibility study for a proposed new hotel,
and in particular discusses the financial aspects of such a study.
TRUE OR FALSE QUESTIONS
(Correct answer indicated by T for True and F for False answers)
1. A feasibility study is designed to guarantee to a lender that a new hotel project will be
financially successful.
F
2. A feasibility study can have either a positive or a negative recommendation.
T
3. A feasibility study may reduce the risk of a particular investment but does not
eliminate the risk.
T
4. Most feasibility studies begin with a financial analysis of the proposal and conclude
with other matters such as site evaluation.
F
5. The general market characteristics section of a feasibility study covers matters such as
the proposed advertising budget.
F
6. The general market characteristics section of a feasibility study covers both
descriptive and statistical data where these are relevant.
T
7. Auto access routes are an important part of the site evaluation section of a feasibility
study for a downtown restaurant.
F
8. A hotel feasibility study should include in its supply and demand section local hotel
occupancy trends broken down by class of hotel.
T
9. The major source of demand for all downtown city hotels is the tourist.
F
10. Business travel growth can often be correlated to growth in local office space
occupancies.
T
11. The business traveler component of demand for hotel rooms in an area is 80% and has
been growing at 7% a year. Composite growth rate is 56%.
F
12. Business travel demand for hotel rooms in an area is 80% and vacation travel demand
20%. Annual compound business travel growth is 7% and vacation travel 10%. Total
composite growth rate is 7.6%.
T
13. Current average nightly demand for hotel rooms in an area is 1,796 and composite
growth rate of demand is 5.5%. Next year’s (year 1) demand for rooms will be 1,895
(to the nearest whole number).
T
14. Current average nightly demand for hotel rooms in an area is 1,796 and composite
growth rate of demand is 5.5%. Two years from now (year 2) demand for rooms will
be 2,095.
F
15. Average nightly demand for hotel rooms is 1,796 in a particular area and hotels in that
area are averaging 75% occupancy. Total number of rooms presently available in that
area is 2,395.
T
16. Average nightly demand for rooms in an area is 3,598 and hotels are averaging
75% occupancy. Total number of rooms presently available in that area is 4,568.
F
17. Average nightly demand for rooms in an area is 3,598 and area hotels are averaging
an occupancy rate of 75%. A new hotel is to be built that will cause all hotels
(including the new one) to operate at a 70% occupancy in the first year. The new
hotel will have 496 rooms.
F
18. Interim financing is temporary financing while a property is being built, whereas
bridge financing is used for post-opening working capital.
F
19. A long-term mortgage on a building is also referred to as a permanent mortgage.
T
20. A permanent mortgage is one on which interest only has to be paid.
F
21. A chattel mortgage is a mortgage taken out to finance chattels such as food and
beverage inventories.
F
22. A pro-forma income statement is an income statement calculated on a cash basis.
F
23. Feasibility study sales revenue projections are usually prepared for one possible level
of sales revenue only.
F
24. The best way to evaluate feasibility study financial projections is to convert the
projected cash flow figures using net present value (NPV) or internal rate of return
(IRR).
T
MULTIPLE CHOICE QUESTIONS
(Correct answer indicated by asterisk)
1. One of the following statements is not correct. A feasibility study:
(c) Can indicate either a positive or a negative outcome of an investment
(d) Should be independently prepared by an impartial third party
207
2. Which of the following items would not be included in the general market characteristics
section of a feasibility study?
(a) Industrial growth trends
(b) Employment and economic trends
3. Which of the following would not be part of the site evaluation section of a feasibility study?
(c) Transportation routes to and from the site
(d) Site dimensions
4. Which of the following would not be part of the supply and demand information section of a
hotel feasibility study?
(a) Hotel occupancy trends in the local area for the past five years
(b) A list of competitive hotels currently serving that market
5. Business travel demand is estimated to comprise 80% and convention delegate demand 20%
for a proposed new hotel. The annual average growth rate in business travel is 4% and
convention delegates 5%. Composite overall average growth rate of demand is:
(c) 1.0%
(d) 4.8%
6. In a particular area, demand for hotel rooms is 60% from business travel, 30% from
convention delegate travel, and 10% from vacation travel. These three markets have been
growing at 8%, 6%, and 5%, respectively. Composite growth rate of demand is:
(c) 1.8%
(d) 0.5%
7. Current average nightly demand for hotel rooms in an area is 898 and composite total growth
rate of demand is 5.5%. Next year’s (Year 1) demand for rooms will be (to the nearest whole
number):
(a) 945
(b) 953
8. Current average nightly demand for hotel rooms in an area is 1,260 and composite total
growth rate of demand is 6%. The demand for rooms in each of the next 3 years (years 1, 2,
and 3), respectively, will be:
(a) 1,336 / 1,416 / 1,521
(b) 1,416 / 1,501 / 1,591
208
9. Average nightly demand for hotel rooms in an area is 2,635. The hotels in that area are
presently averaging 72% occupancy. The total number of rooms available is:
(c) 3,416
(d) 3,201
10. Average nightly demand for rooms in an area is 2,635. The hotels in that area are presently
averaging 72% percent occupancy. Assume a new hotel is to be built that will cause
occupancy for all hotels (including the new one) to drop to 65% in the first year (Year 1).
The number of rooms in that new hotel will be:
(c) 368
(d) 386
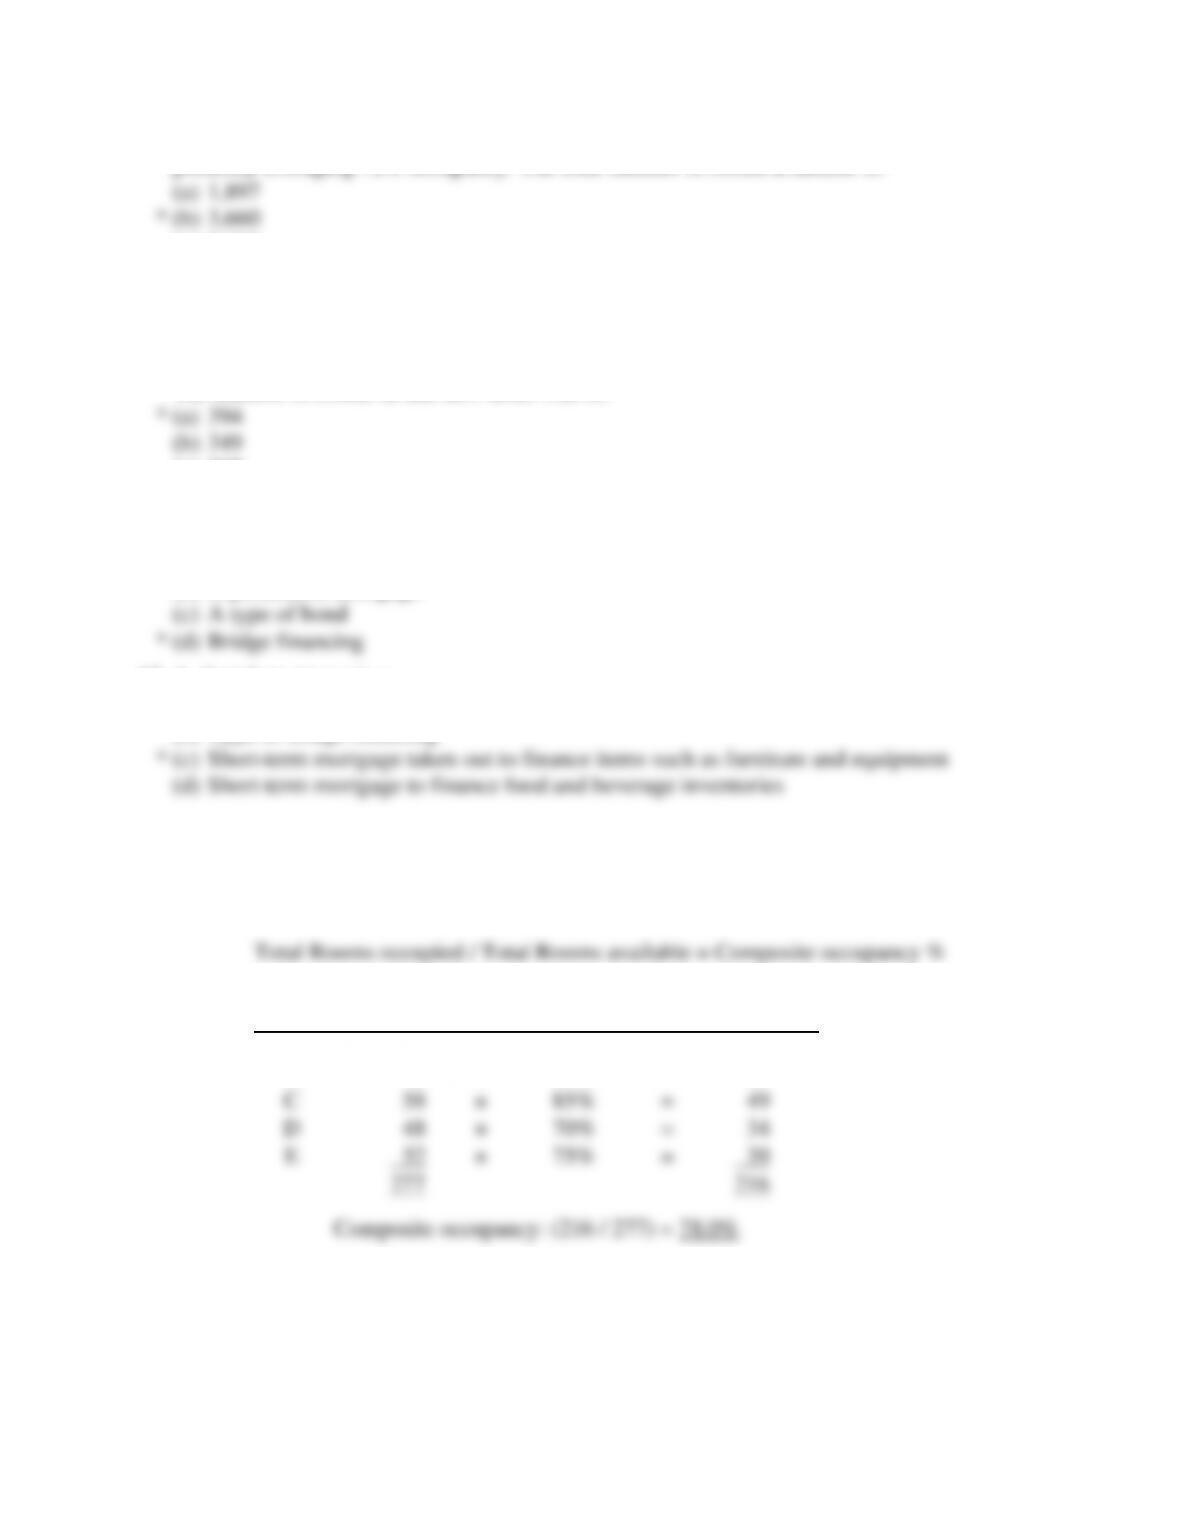
11. Interim financing is the same as:
(a) A bank loan for working capital
(b) A permanent mortgage
12. A chattel mortgage is a:
(a) Type of interim financing
(b) Type of bridge financing
PROBLEM SOLUTIONS
P13.1 a. Calculate the current average occupancy of 5 motels:
Motel
Rooms
Available
Occupancy %
Rooms
Occupied
A
74
×
82%
=
61
B
45
×
73%
=
33
C
58
×
85%
=
49
D
48
×
70%
=
34
E
52
×
75%
=
39
277
216
Composite occupancy: (216 / 277) = 78.0%
209
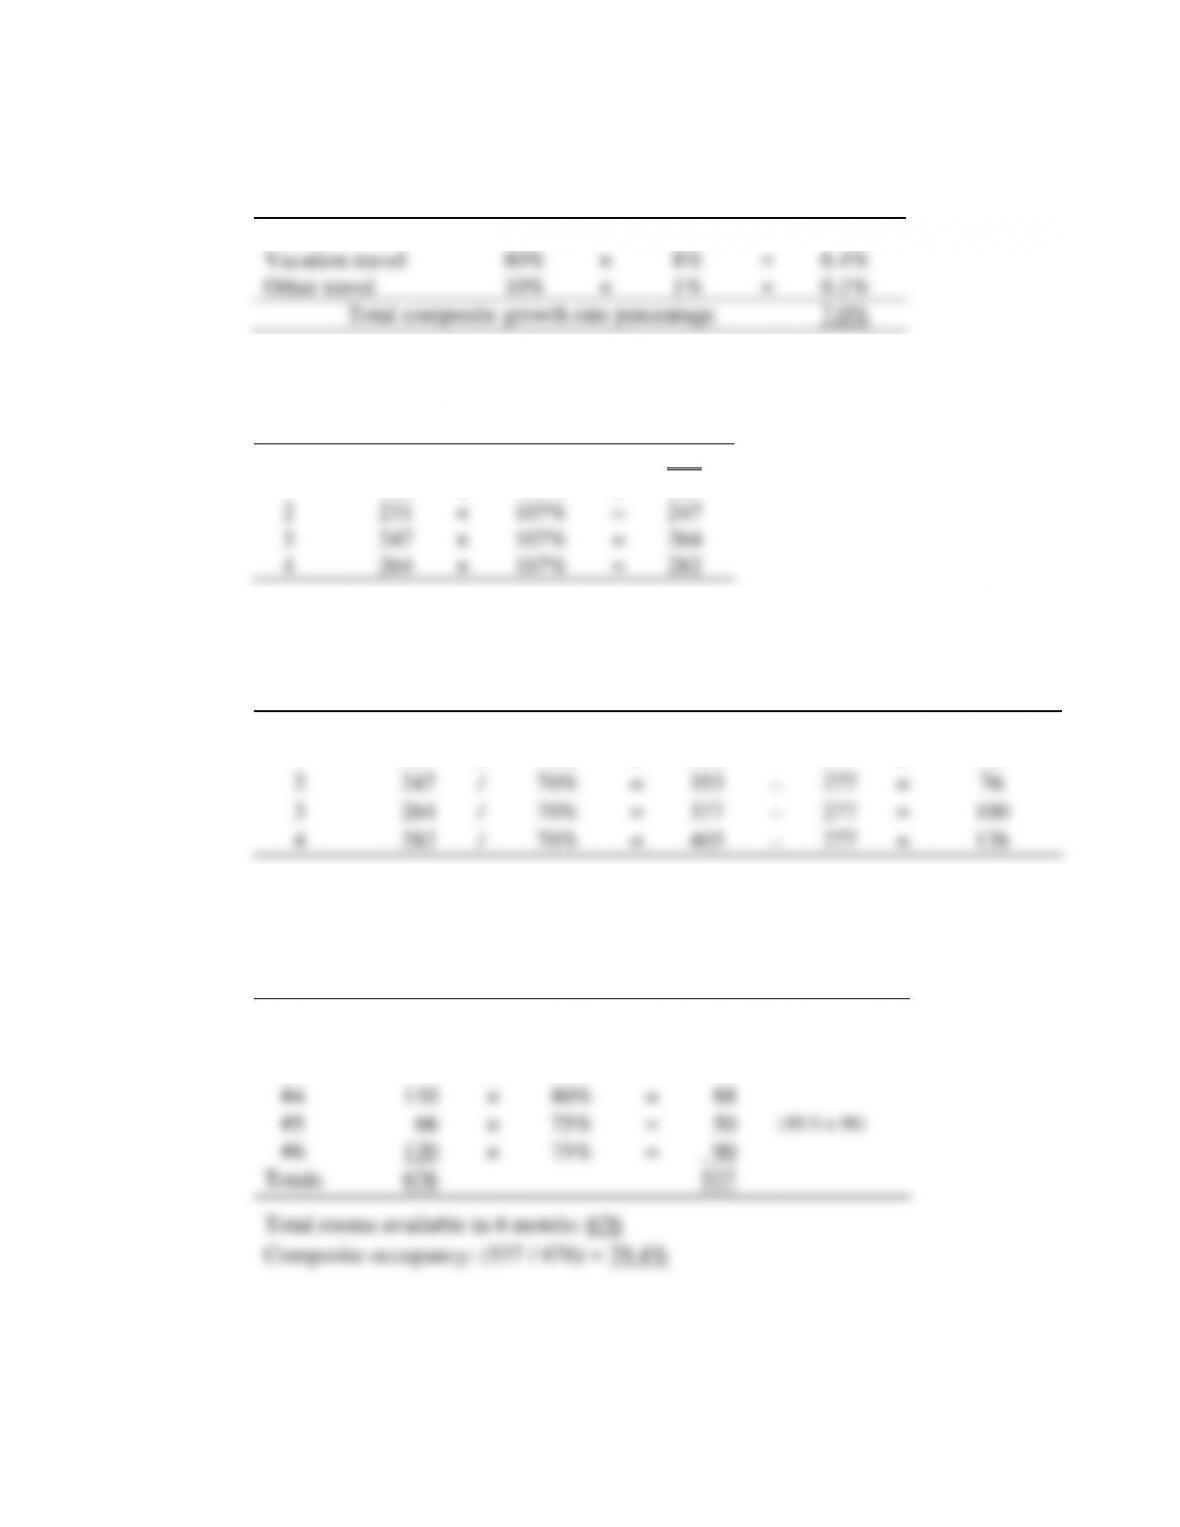
b. Composite growth rate:
c. Composite growth rate and projected demand for the next 4 years
Vacation travel
×
=
Other travel
10%
×
1%
=
0.1%
Rooms
Composite
Future
Year
Demand
Growth %
Demand
0
216
1
216
×
107%
=
231
2
231
×
107%
=
247
3
247
×
107%
=
264
4
264
×
107%
=
282
d. Assume a 70% occupancy and calculate the rooms that could be supplied for the
next 4 years:
Rooms
Occupancy
Supply
Current
New Rooms
Year
Demand
@ 70%
Required
Supply
Required
Current
216
/
70%
=
309
−
277
=
32
1
231
/
70%
=
330
−
277
=
53
2
247
/
70%
=
353
−
277
=
76
3
264
/
70%
=
377
−
277
=
100
4
282
/
70%
=
403
−
277
=
126
P13.2 a. Determination of rooms demand:
Motel
Rooms
Available
×
Occupancy
%
=
Rooms
Demand
#1
150
×
80%
=
120
#2
140
×
90%
=
126
#3
90
×
70%
=
63
#4
110
×
80%
=
88
#5
66
×
75%
=
50
(49.5 50)
#6
120
×
75%
=
90
Totals
676
537
Total rooms available in 6 motels: 676
Composite occupancy: (537 / 676) = 79.4%
Sources of
Demand
Sources of
Demand %
Growth
Rate %
Composite
Percentage
Business travel
10%
×
5%
=
0.5%
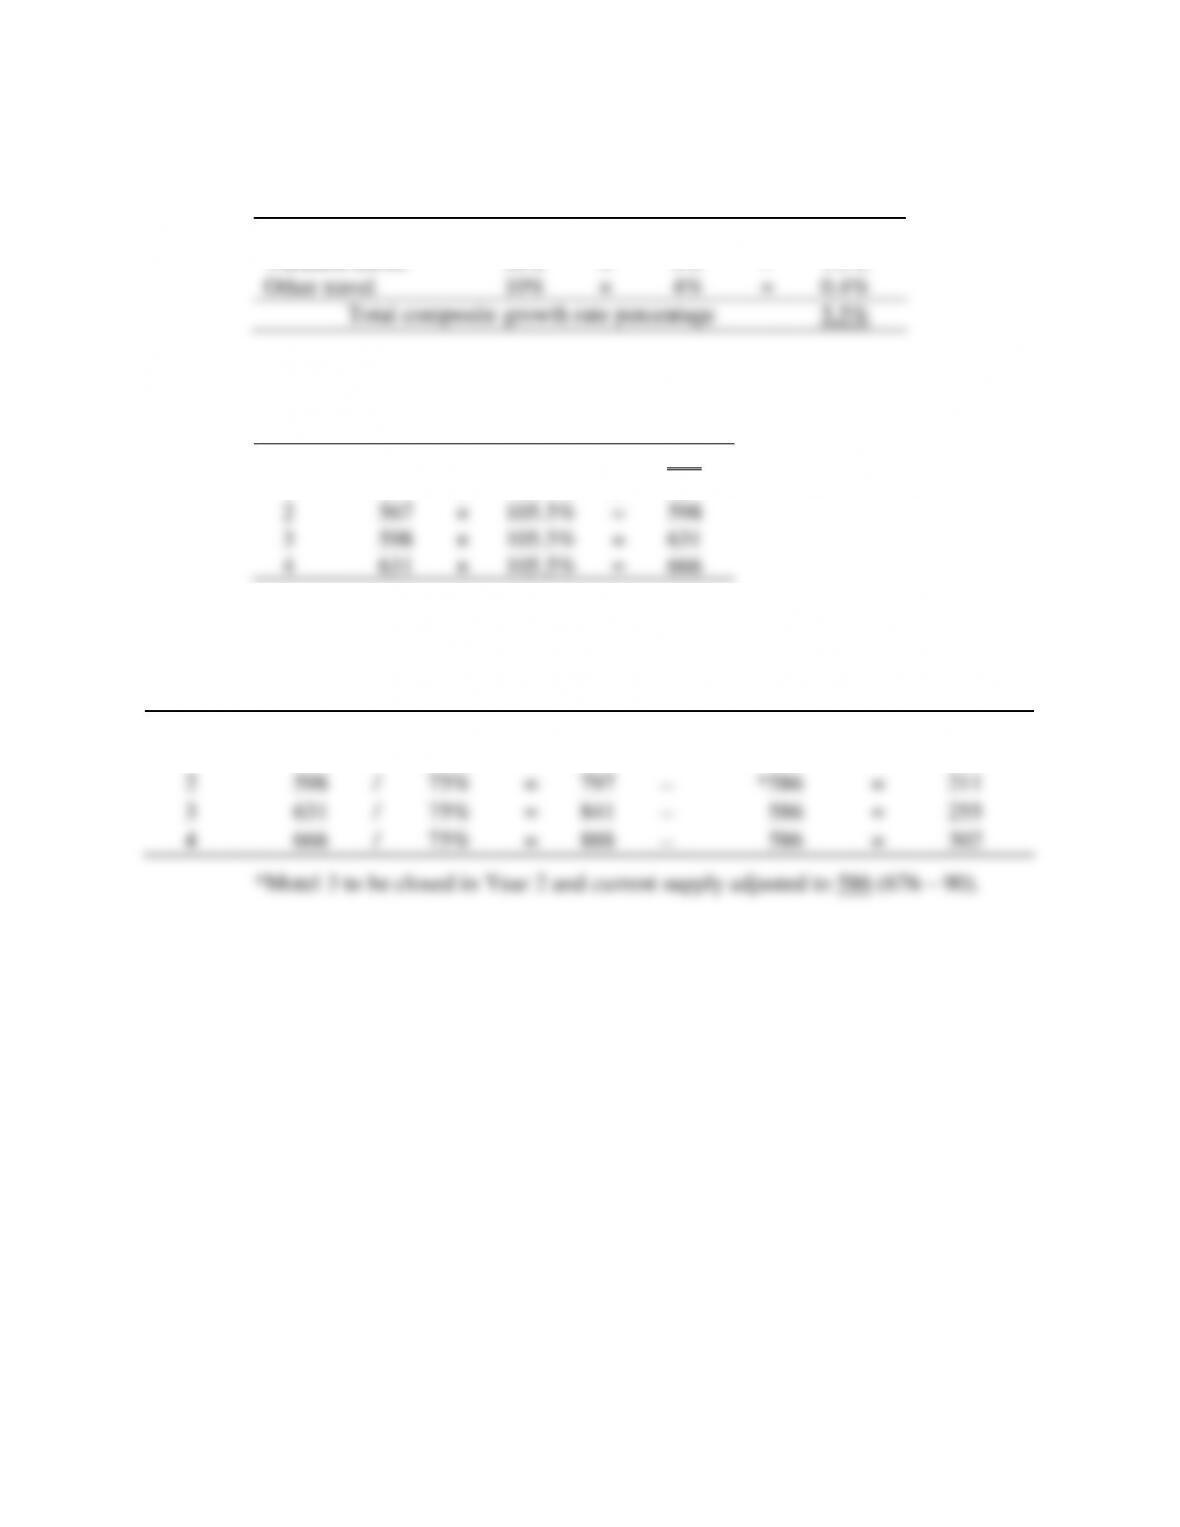
Total composite growth rate percentage
7.0%
210
b. Composite growth rate:
c. Composite growth rate and projected demand for the next 4 years:
Rooms
Composite
Future
Year
Demand
Growth %
Demand
0
537
1
537
×
105.5%
=
567
2
567
×
105.5%
=
598
3
598
×
105.5%
=
631
4
631
×
105.5%
=
666
d. Assume a 75% occupancy and calculate the rooms that could be supplied for the
next 4 years:
Rooms
Occupancy
Supply
Current
New Rooms
Year
Demand
@ 75%
Required
Supply
Required
Current
537
/
75%
=
716
−
676
=
40
1
567
/
75%
=
756
−
676
=
80
2
598
/
75%
=
797
−
*586
=
211
3
631
/
75%
=
841
−
586
=
255
4
666
/
75%
=
888
−
586
=
302
*Motel 3 to be closed in Year 2 and current supply adjusted to 586 (676 – 90).
Sources of
Demand
Sources of
Demand %
Growth
Rate %
Composite
Percentage
Business travel
60%
×
6%
=
3.6%
Vacation travel
30%
×
5%
=
1.5%
Other travel
10%
×
4%
=
0.4%
211
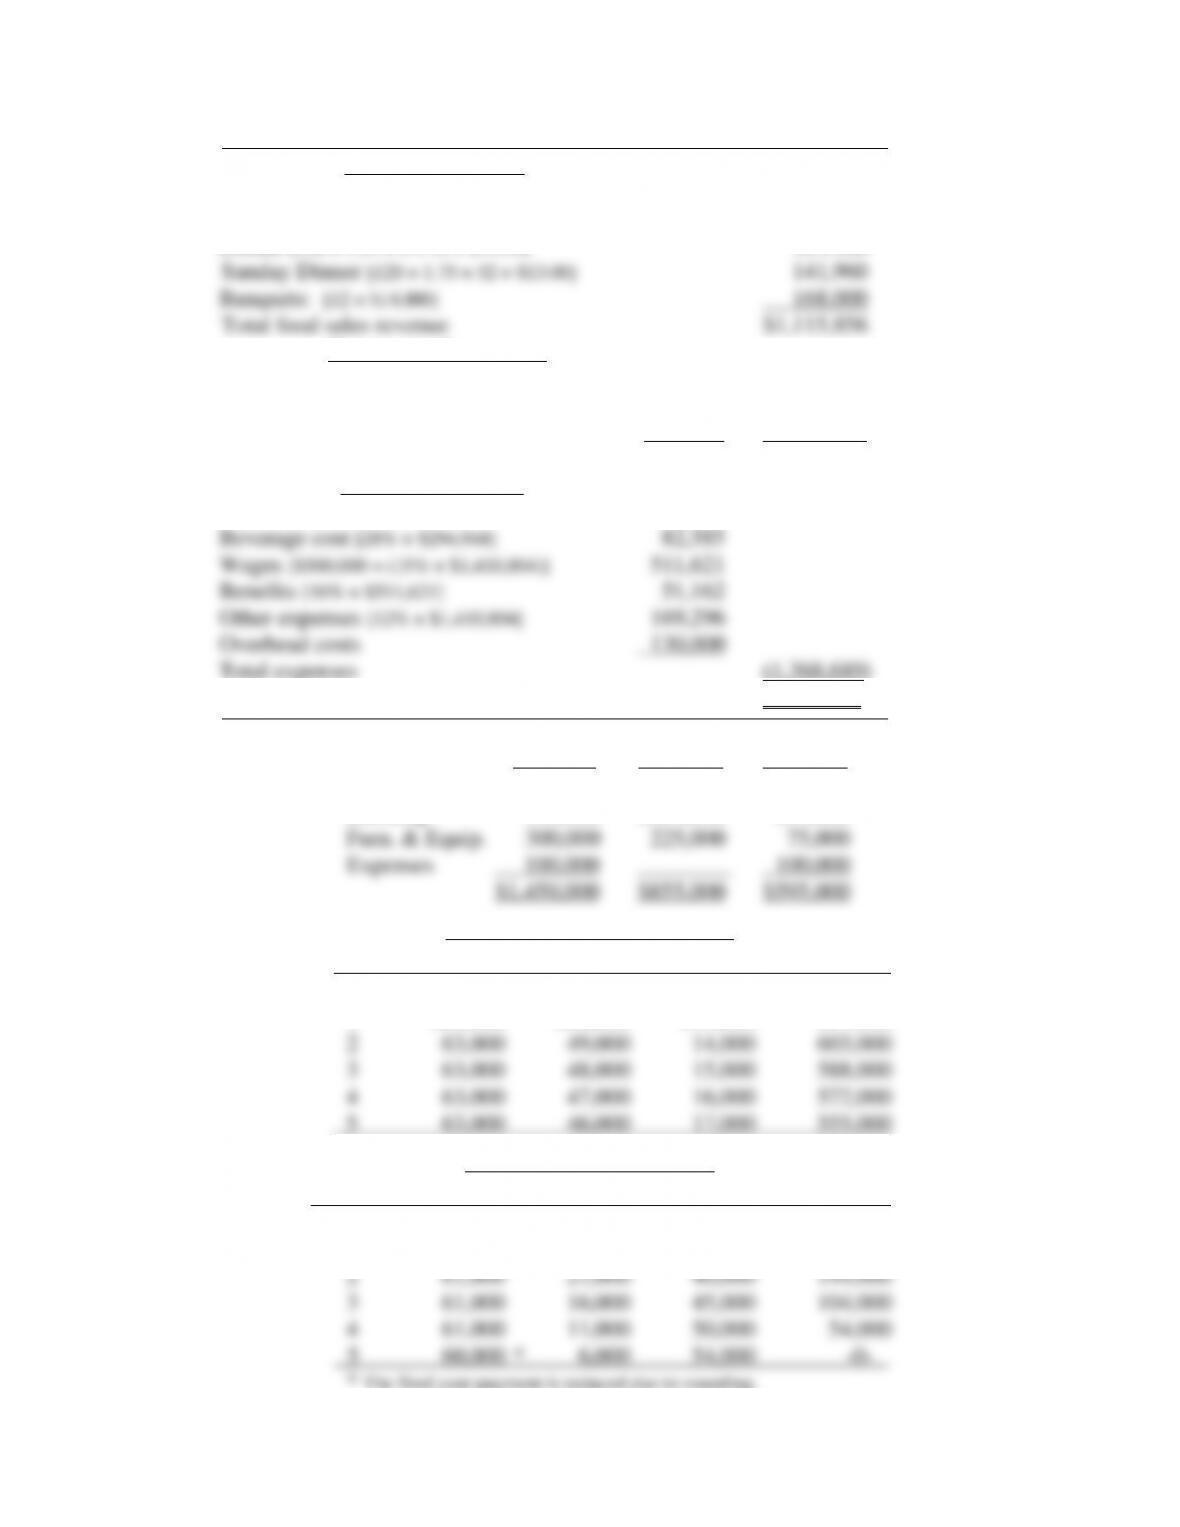
P13.3 Pro-forma Income Statement
Food sales revenue
Monday through Saturday:
Lunch [120 × 1.5 × 6 × 52 × $5.60] $ 314,496
Dinner [120 × 1.25 × 6 × 52 × $10.50] 491,400
Beverage sales revenue
Lunch [12% × $314,496] $ 37,740
Dinner [30% × ($491,400 + $141,960)] 190,008
Banquets [40% × $168,000] 67,200 294,948
Total Sales Revenue $1,410,804
Operating expenses
Food cost [38% × $1,115,856] $424,025
Total expenses (1,368,689)
Operating income [BT] $ 42,115
P13.4 a. Total Debt Equity
Land $150,000 $150,000
Building 900,000 $630,000 270,000
b. Building Mortgage Repayment
Year Total Interest Balance
0 $630,000
1 $63,000 $50,000 $13,000 617,000
c. Chattel Mortgage Payment
Year Total Interest Balance
0 $225,000
1 $61,000 $25,000 $36,000 189,000
* The final year payment is reduced due to rounding.
212
P13.5 Building Depreciation
Year Expense Balance
0 $900,000
1 $54,000 846,000
Furniture & Equipment Depreciation
Year Expense Balance
0 $300,000
1 $75,000 225,000
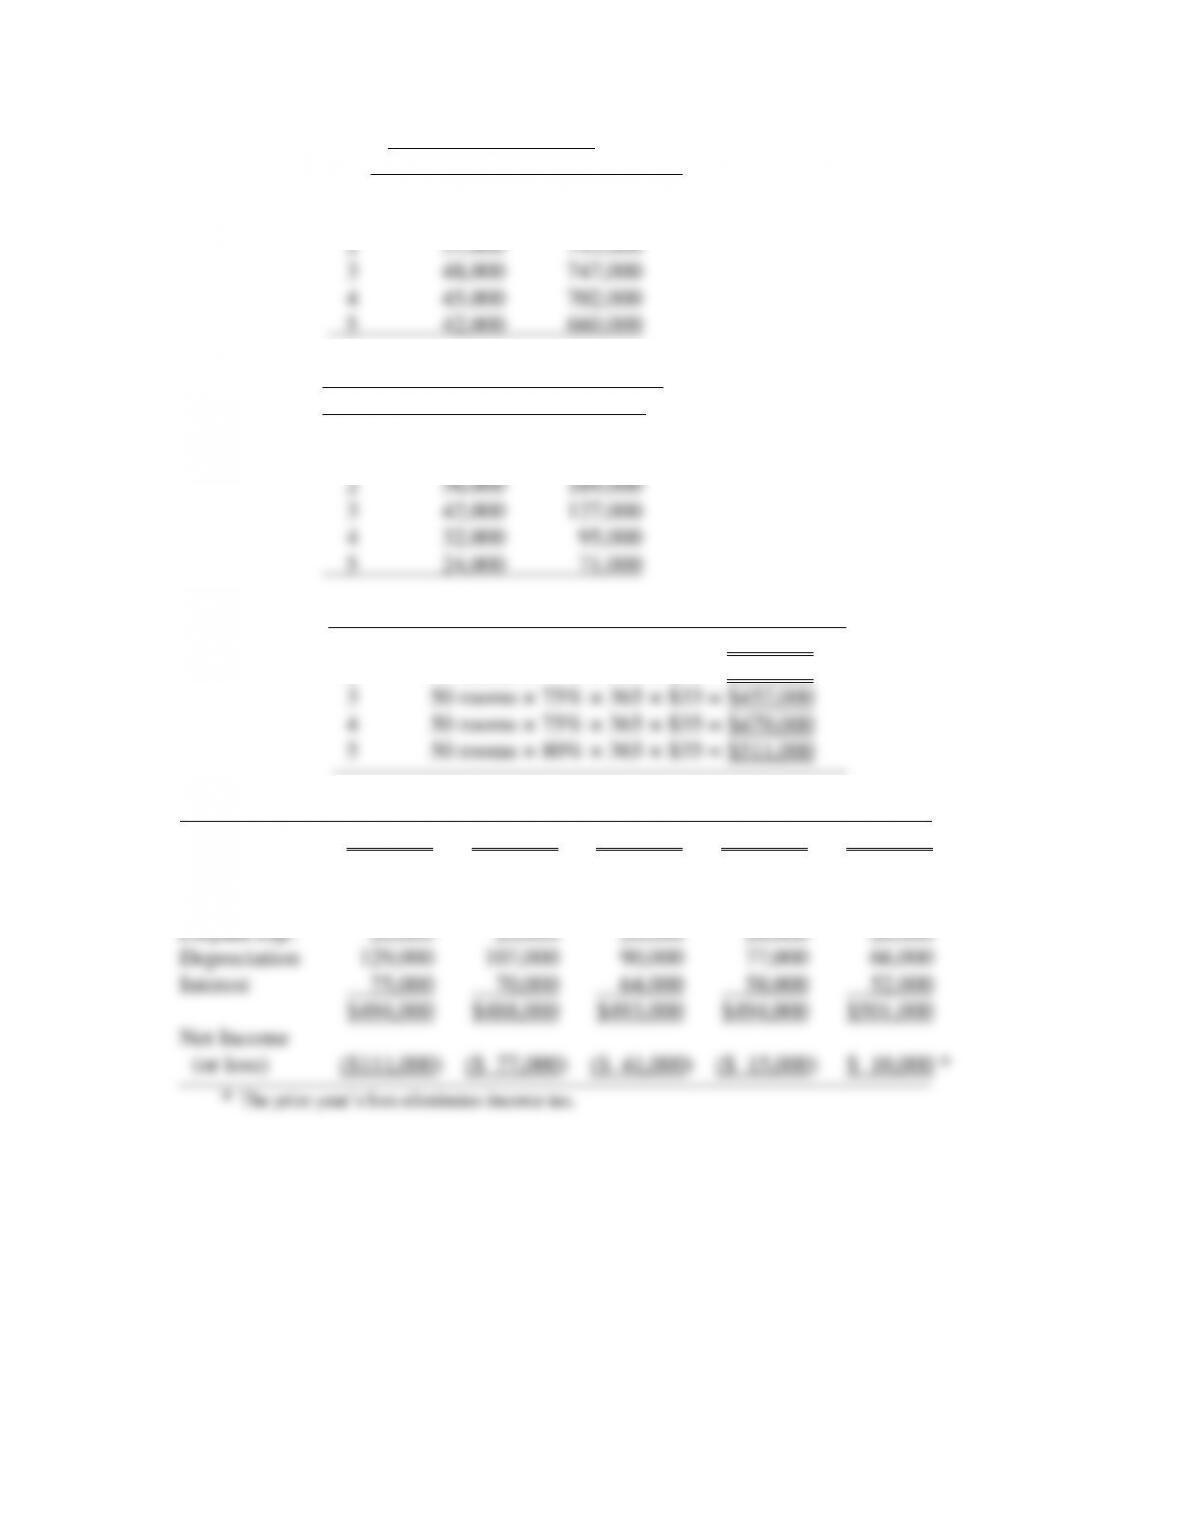
P13.6 Year Sales Revenue Calculation
1 50 rooms × 70% × 365 × $30 = $383,000
2 50 rooms × 75% × 365 × $30 = $411,000
Year 1 Year 2 Year 3 Year 4 Year 5
Sales revenue $383,000 $411,000 $452,000 $479,000 $511,000
Op. Costs 60% $230,000 $247,000 $271,000 $287,000 $307,000
Indirect exp. 40,000 44,000 48,000 52,000 56,000
213
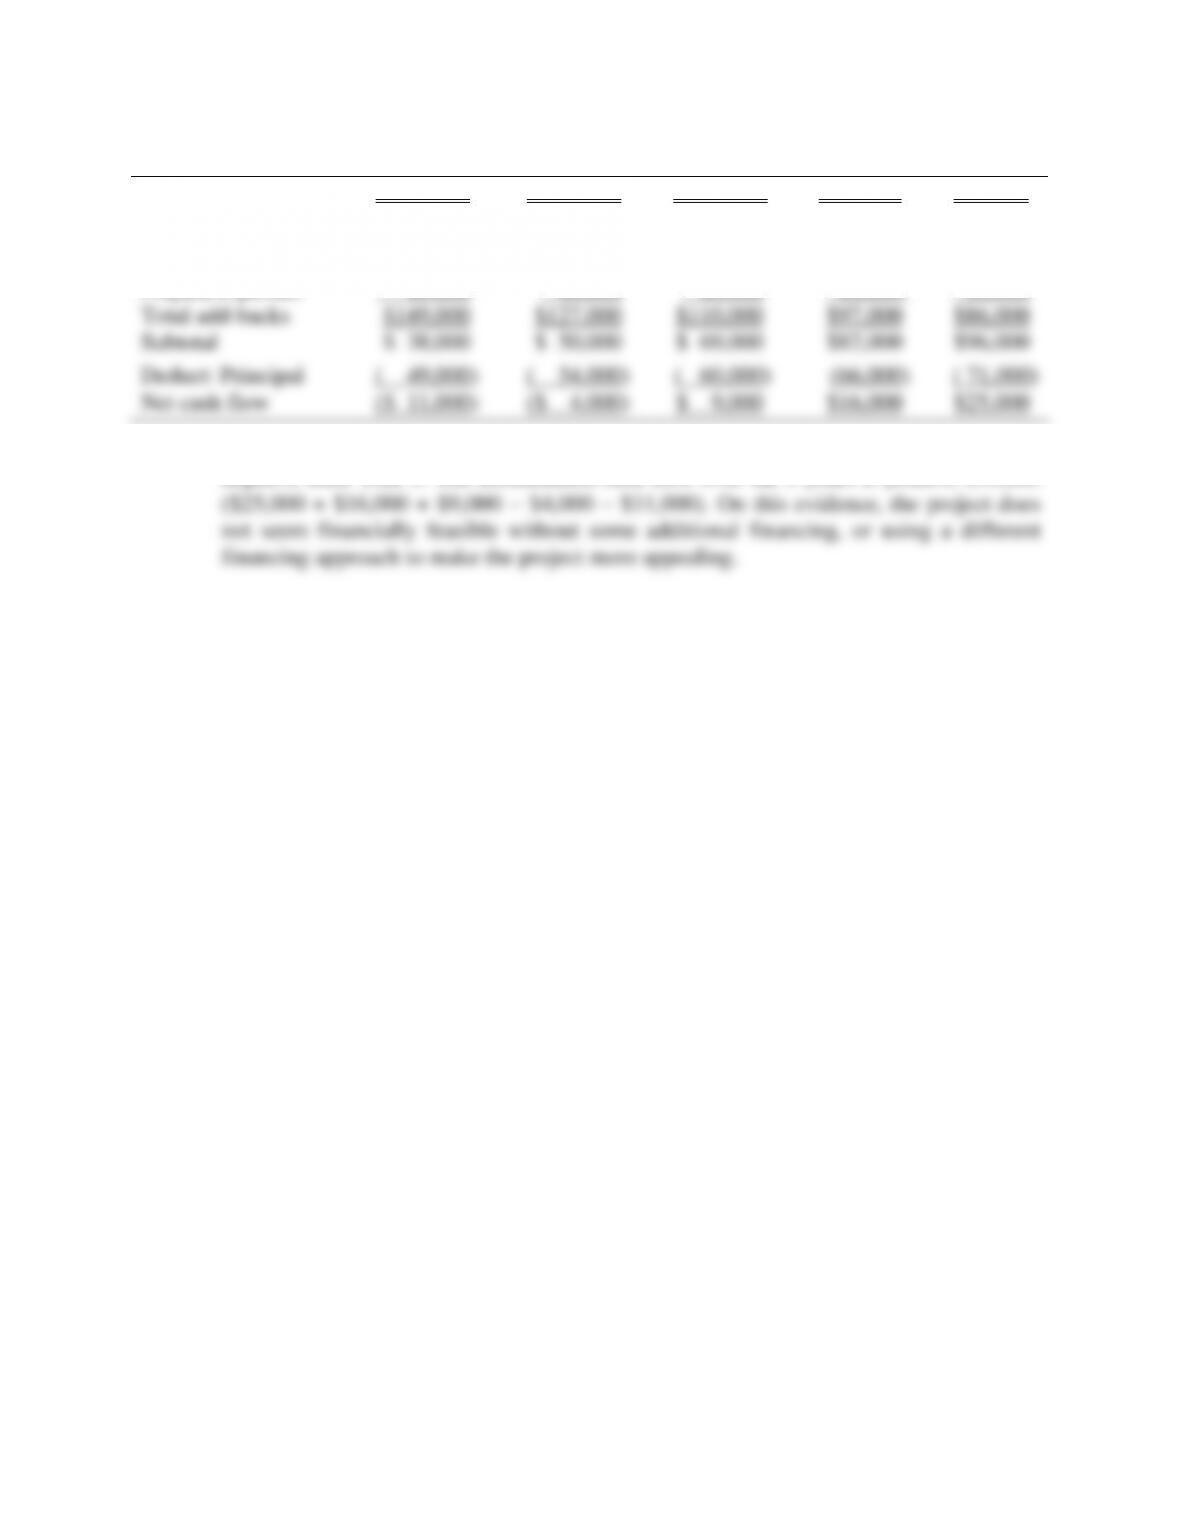
P13.7
Year 1
Year 2
Year 3
Year 4
Year 5
Net income (or loss)
($111,000)
($ 77,000)
($ 41,000)
($15,000)
$10,000
Add:
Depreciation
$129,000
$107,000
$ 90,000
$77,000
$66,000
Prepaid expenses
20,000
20,000
20,000
20,000
20,000
Total add-backs
$149,000
$127,000
$110,000
$97,000
$86,000
Subtotal
$ 38,000
$ 50,000
$ 69,000
$82,000
$96,000
Deduct: Principal
( 49,000)
( 54,000)
( 60,000)
(66,000)
( 71,000)
Net cash flow
($ 11,000)
($ 4,000)
$ 9,000
$16,000
$25,000
The above financial projections show no net income until Year 5 and cash flow is
negative until Year 3. The accumulated cash flow over the 5 years is positive $35,000
CASE 13 SOLUTION
No solution is offered because each student’s report will differ depending on the location chosen.