Chapter 6
Layout Planning Models and
6.1 Several important factors such as:
Product type,
6.2 The material handling decisions can have a significant impact on the effectiveness of a
layout. For example:
Centralized vs. decentralized storage of WIP, tooling, and supplies.
6.3a Fixed Product Layout: It should be used when the product is too large or cumbersome to
6.3c Group Layout: It is used when production volumes for individual products are not
6.3d Process Layout: It is used when there exist many low-volume, dissimilar products to be
planned.
6.4
Manufacturing Situation
Primary Layout Design
a.
Soda Bottler
Product Layout
b.
Printing Shop
Group Layout
c.
Meat-Process Plant
Fixed Product Layout
d.
Furniture Manufacturing Plant
Group Layout
e.
Computer Chip Maker
Product Layout
f.
Shipyard
Fixed Product Layout
g.
Refinery Plant
Product Layout
h.
College Campus
Group Layout
Answers to Problems at the End of Chapter 6 6-2
SECTION 6.3
6.5 The construction type of facility layout procedure involves developing a new layout from
6.6 All three layout procedures provide a systematic step-by-step methodology in designing a
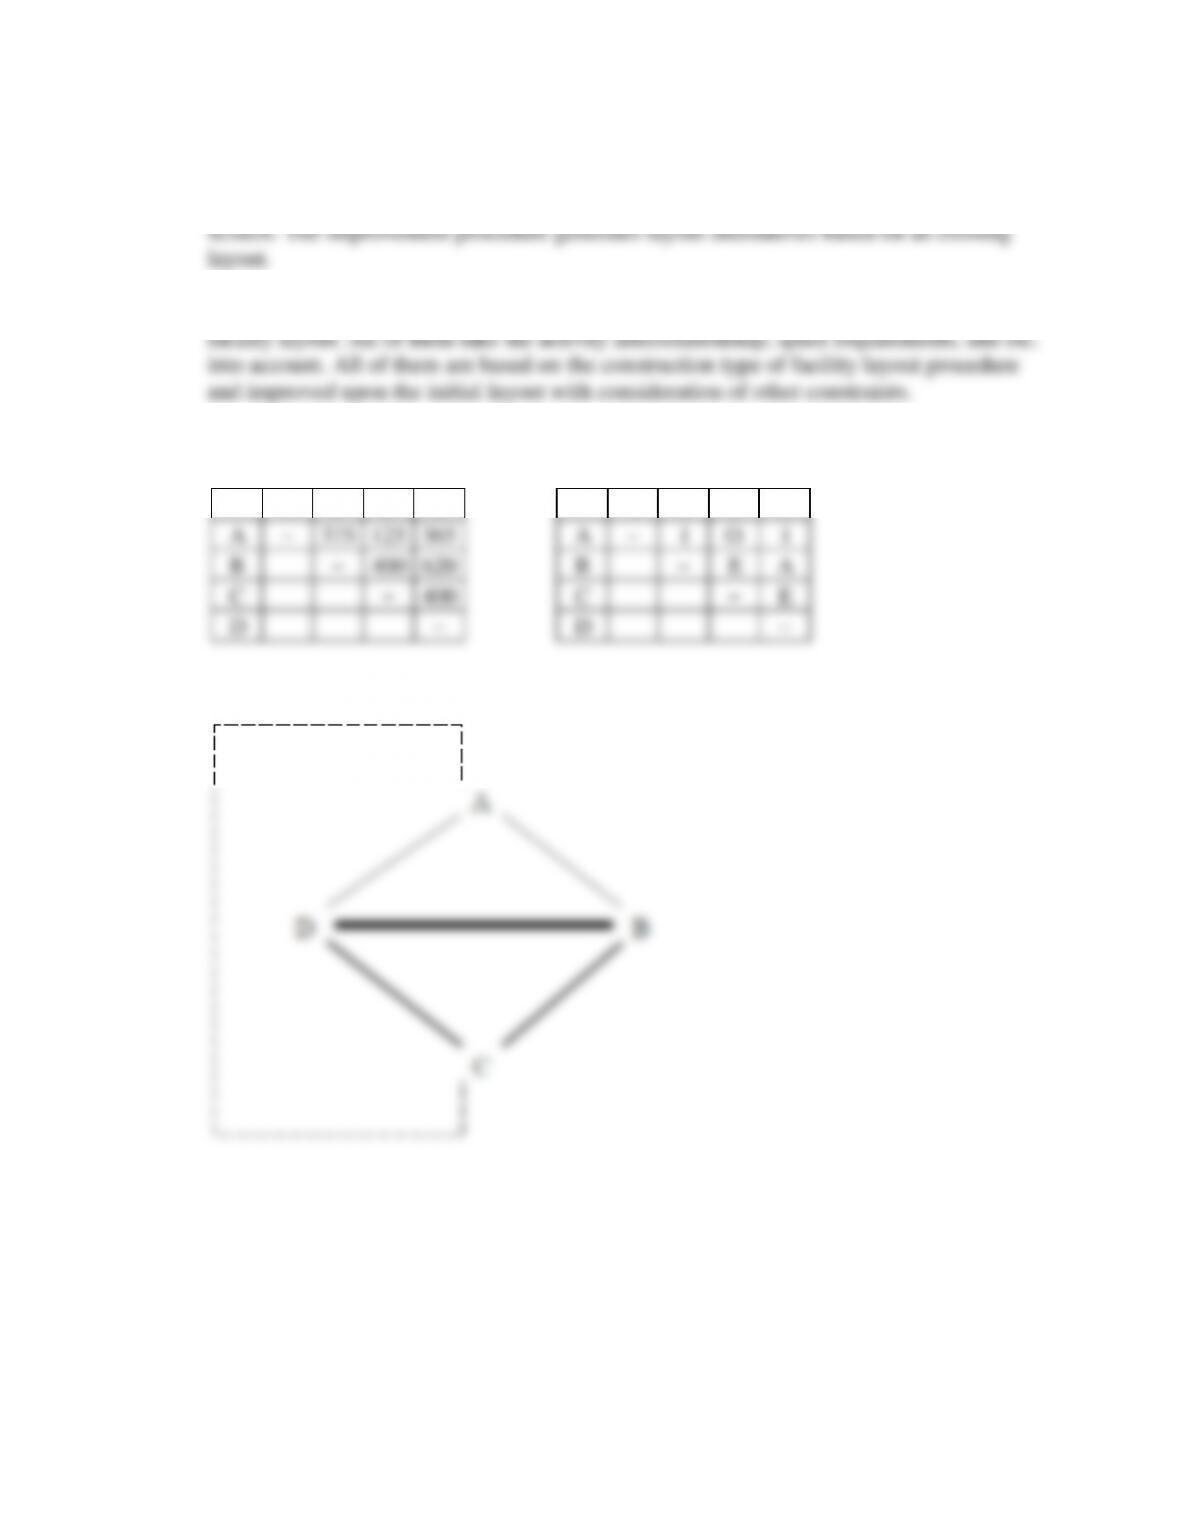
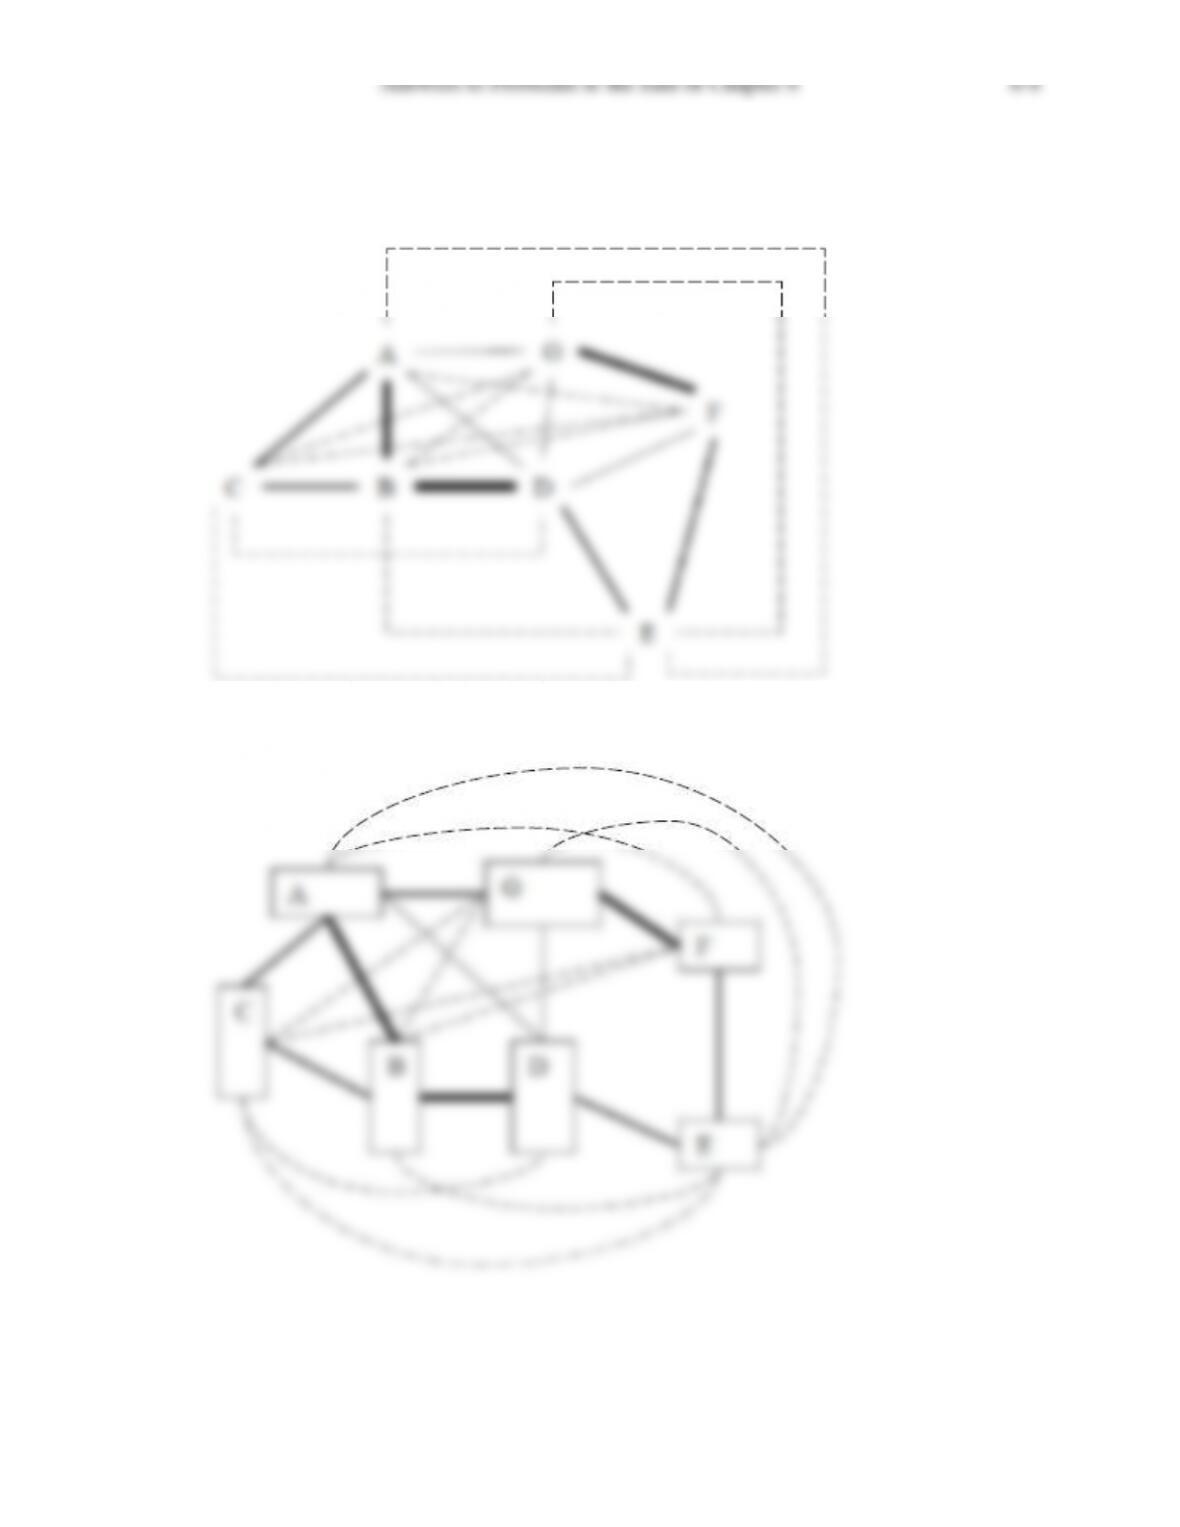
6.7
Relationship Diagram
Flow–Between Diagram Activity Relationship Chart
A B C D A B C D
A–375 125 365 A–I O I
B–400 620 B–E A
C–400 C–E
D–D–
Answers to Problems at the End of Chapter 6 6-3
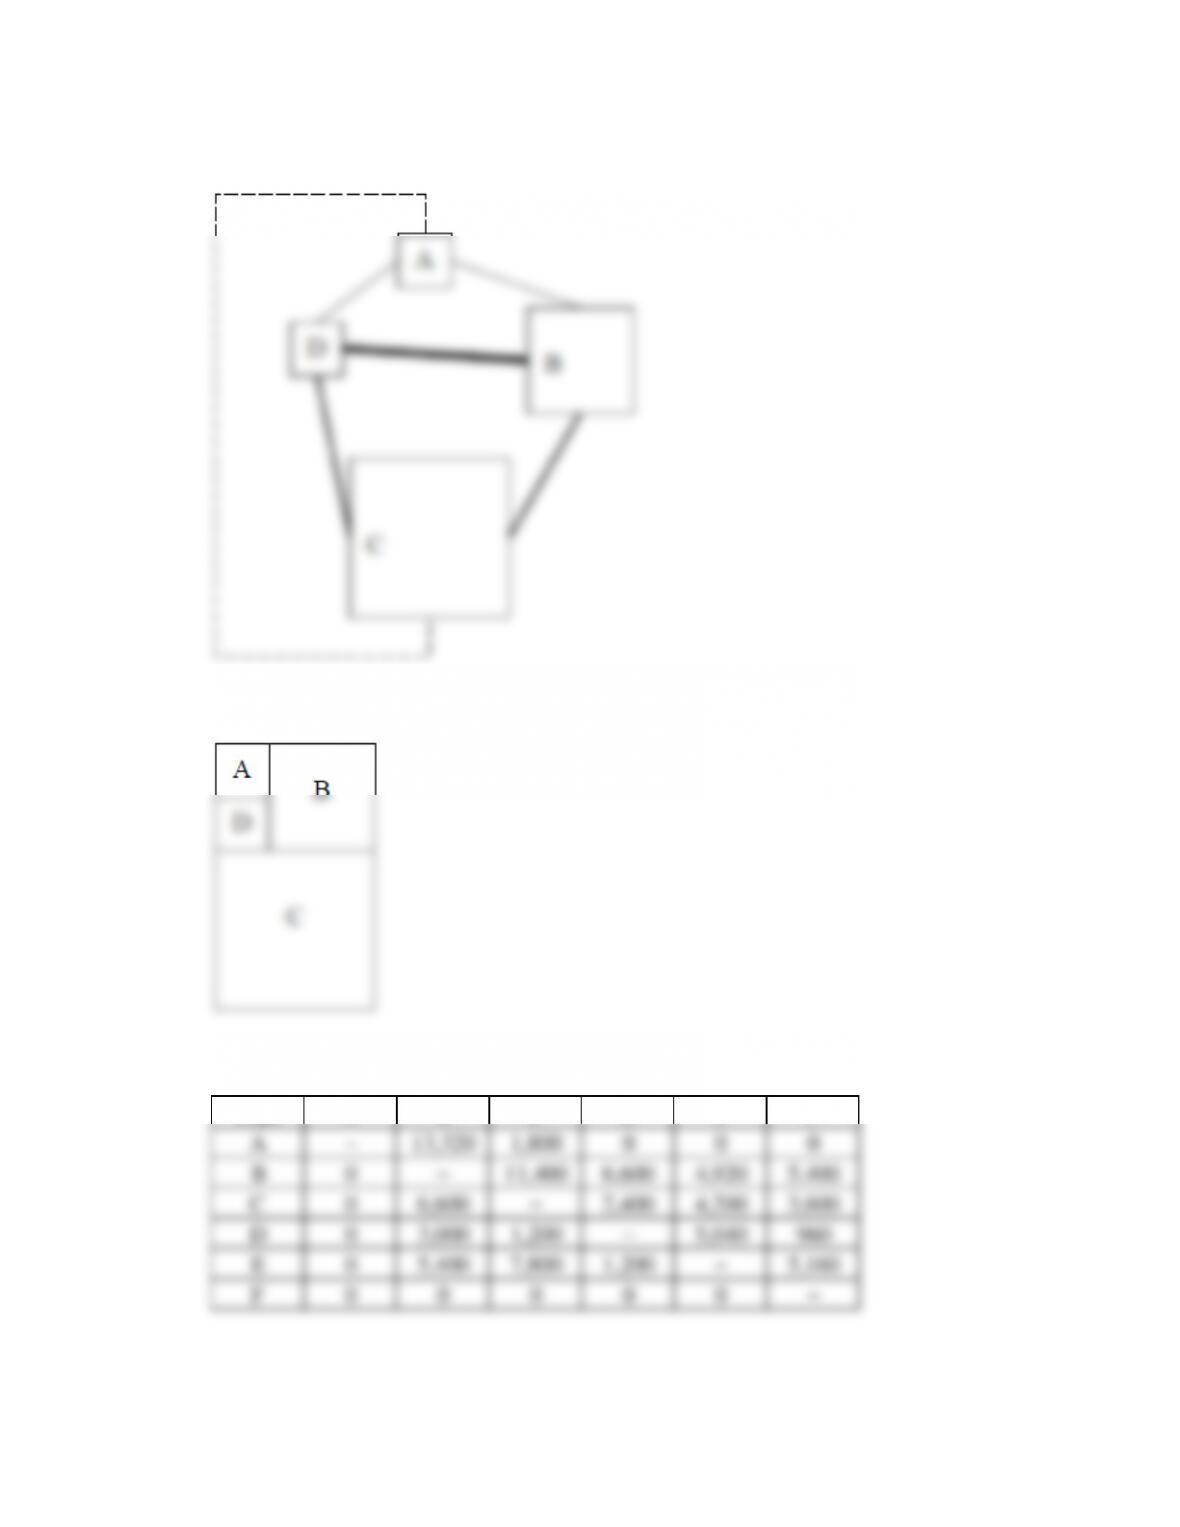
Space Relationship Diagram
Block Layout
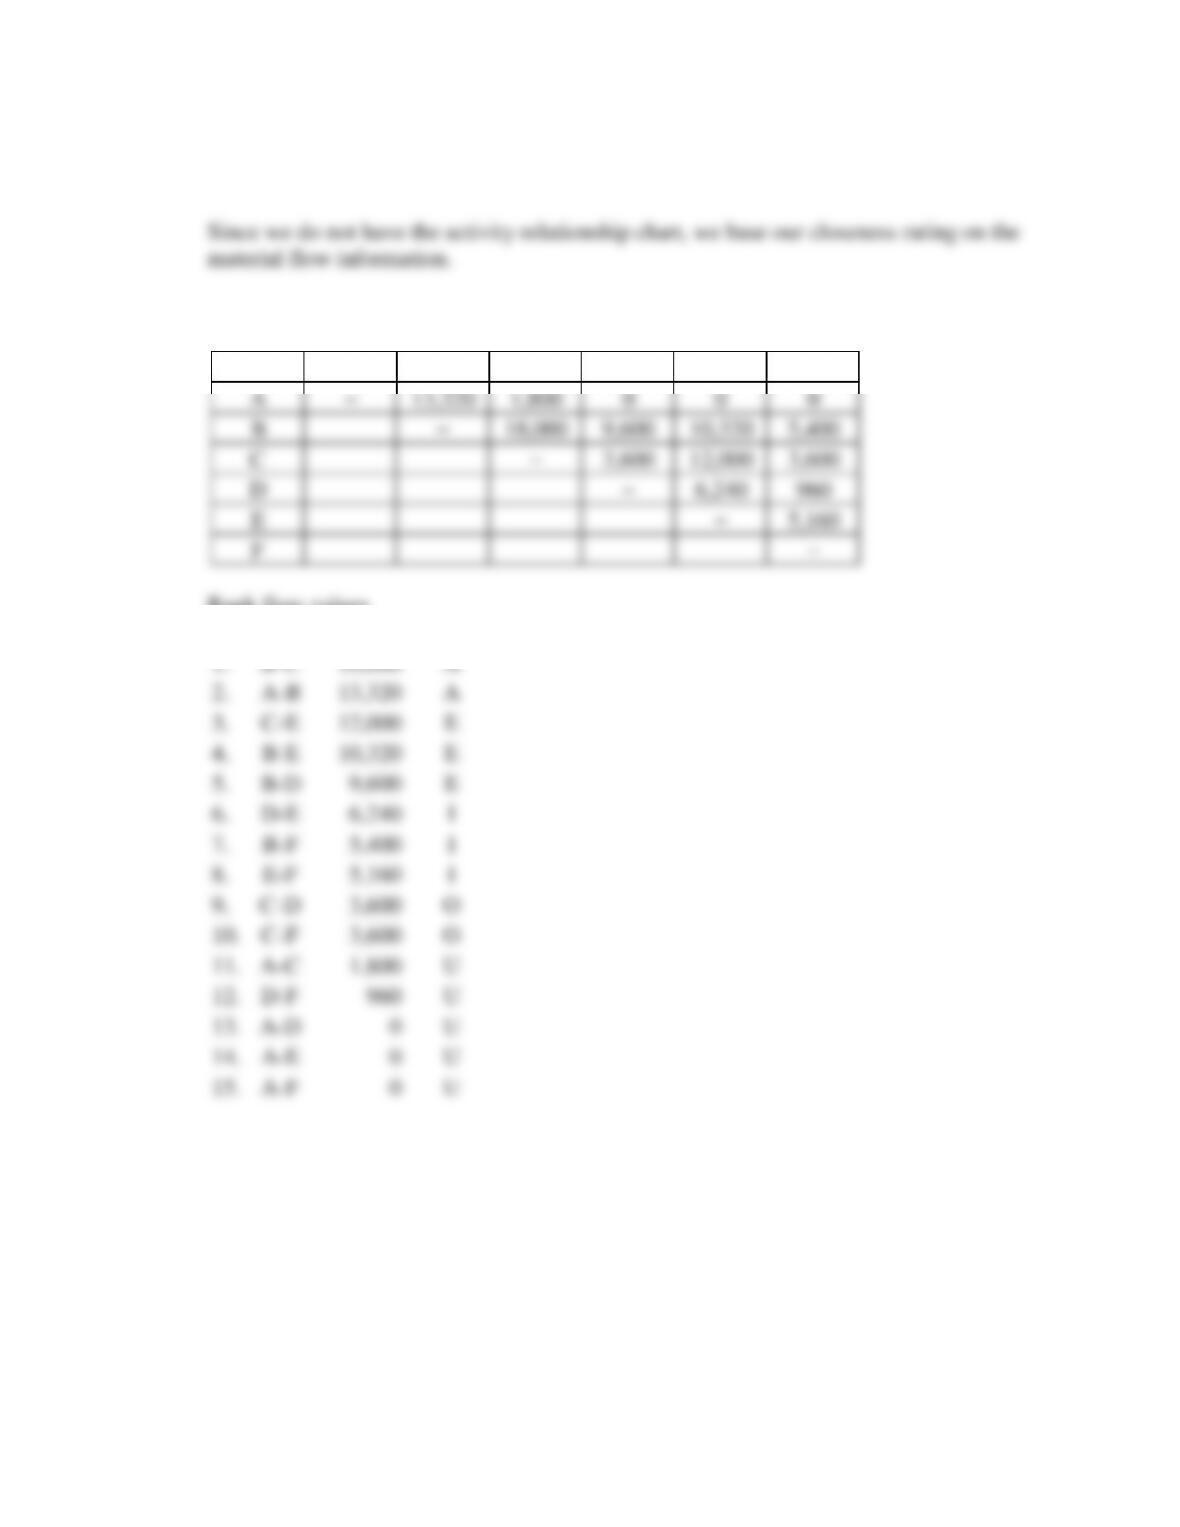
6.8a From-To Chart
Dept. A B C D E F
A–13,320 1,800 0 0 0
B 0 –11,400 6,600 4,920 5,400
C 0 6,600 –2,400 4,200 3,600
D 0 3,000 1,200 –5,040 960
E 0 5,400 7,800 1,200 –5,160
F 0 0 0 0 0 –
Answers to Problems at the End of Chapter 6 6-4
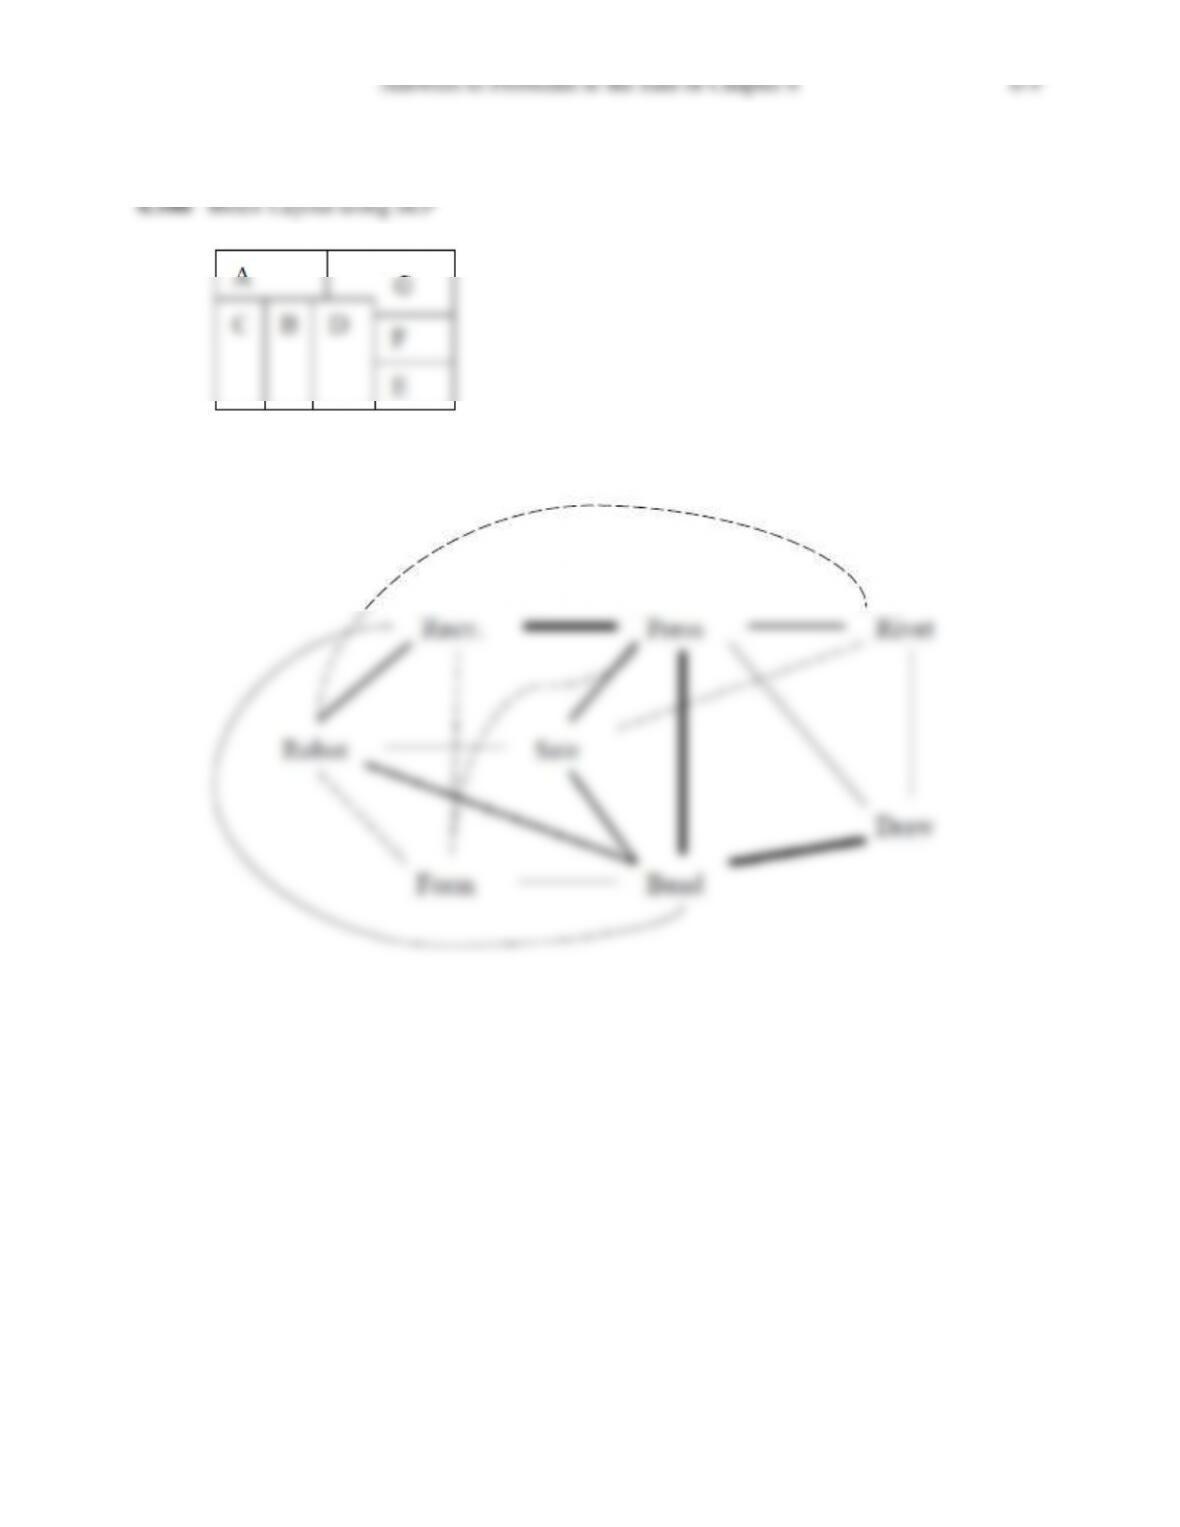
6.8b SLP Approach:
Flow-Between Chart
Rank flow values
Dept. A B C D E F
A–13,320 1,800 0 0 0
B–18,000 9,600 10,320 5,400
C–3,600 12,000 3,600
D–6,240 960
E–5,160
F–
1. B–C 18,000 A
2. A–B 13,320 A
3. C–E 12,000 E
4. B–E 10,320 E
5. B–D 9,600 E
6. D–E 6,240 I
7. B–F 5,400 I
8. E–F 5,160 I
9. C–D 3,600 O
10. C–F 3,600 O
11. A–C 1,800 U
12. D–F 960 U
13. A–D 0 U
14. A–E 0 U
15. A–F 0 U
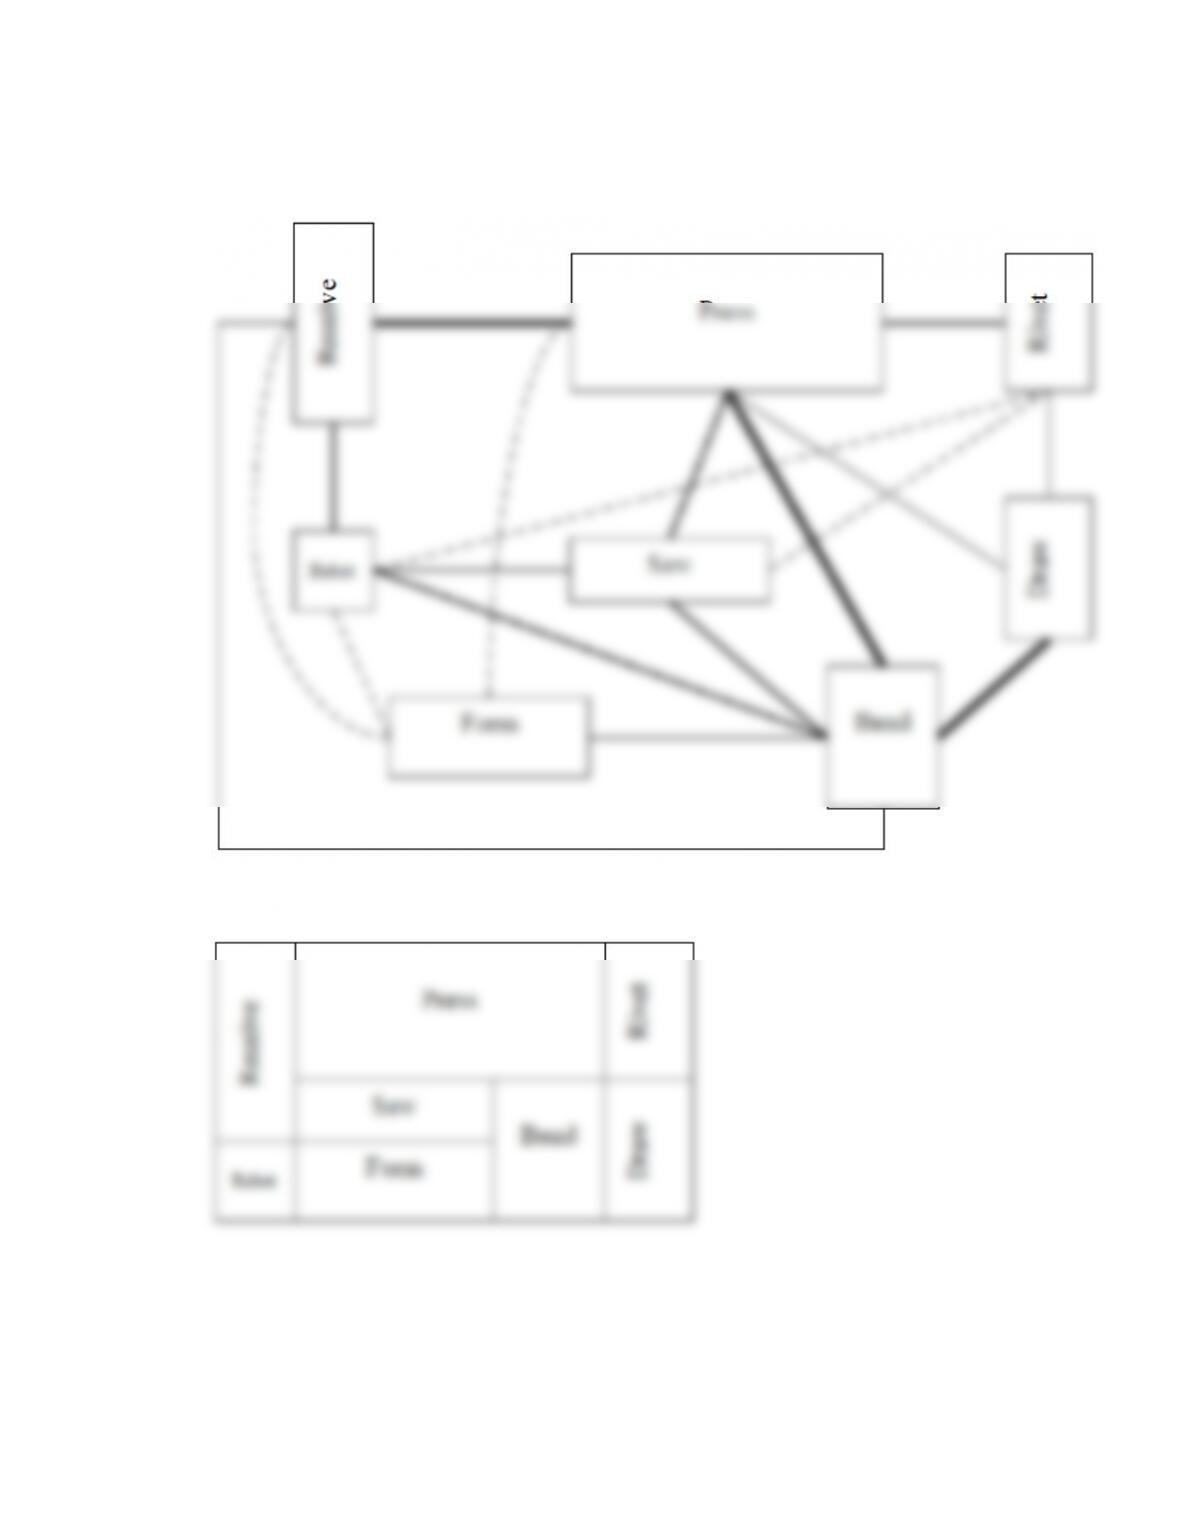
Answers to Problems at the End of Chapter 6 6-5
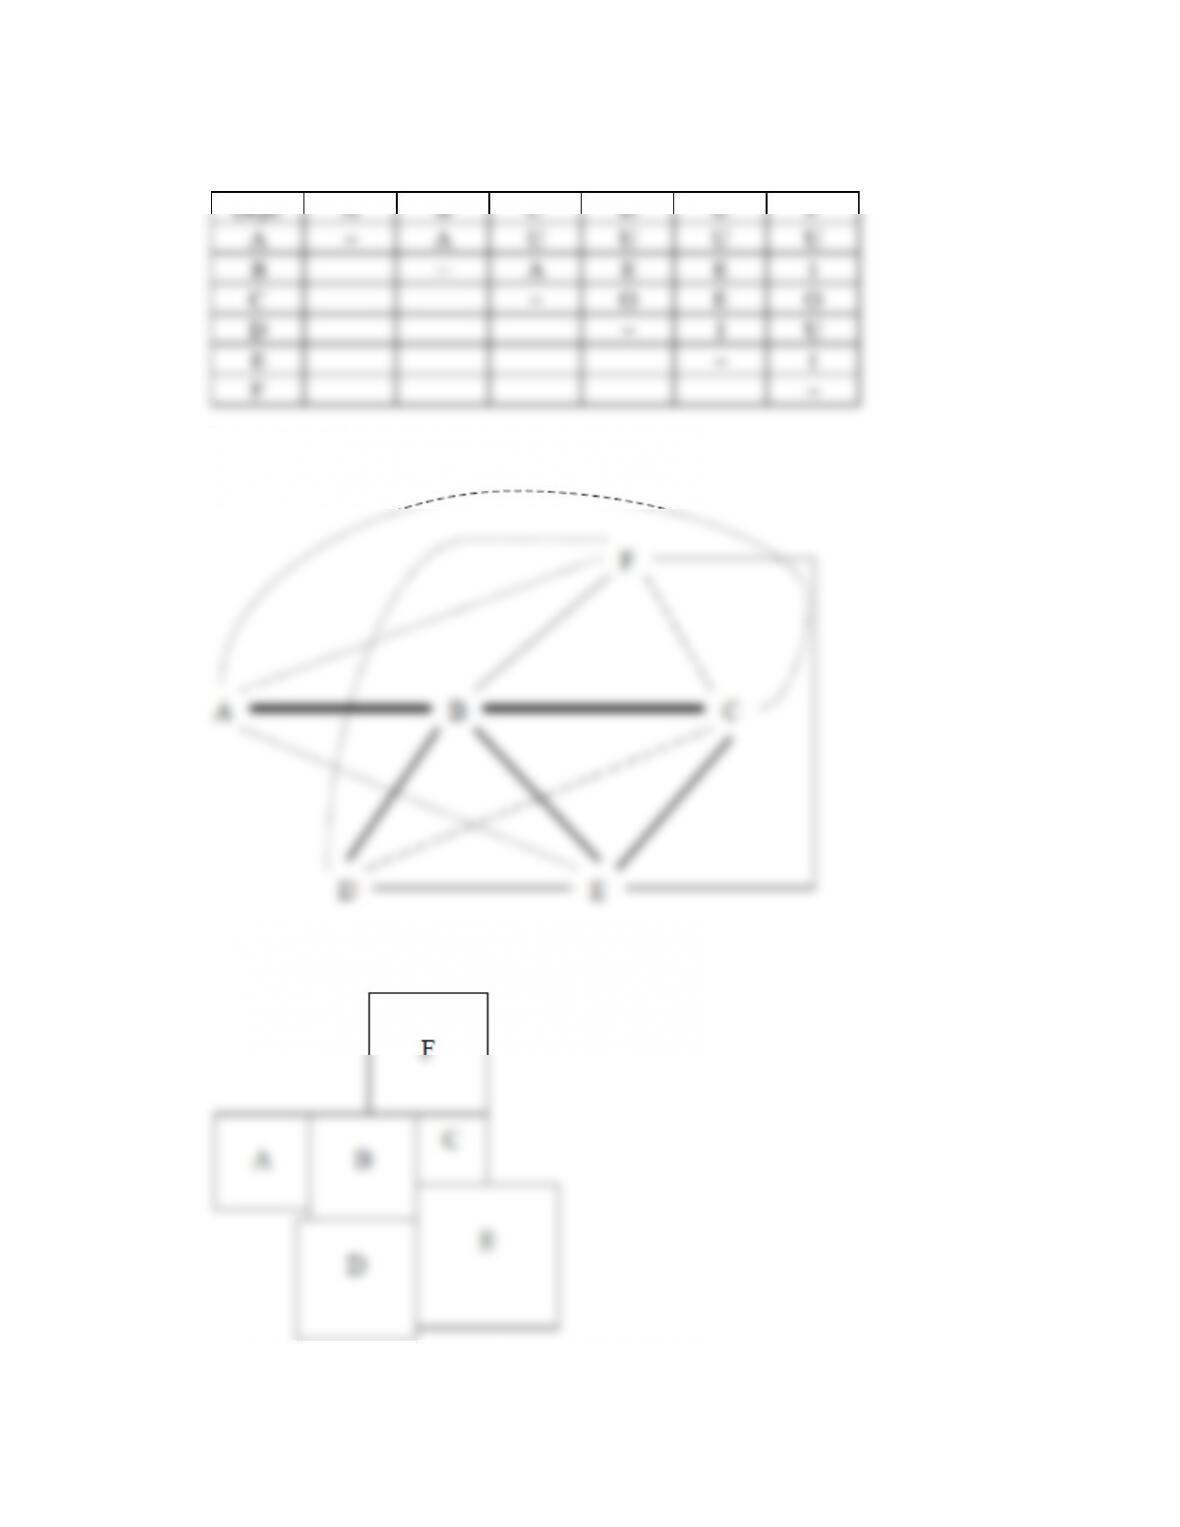
Activity Relationship Chart
Relationship Diagram
Block Layout
Dept. A B C D E F
A–A U U U U
B–A E E I
C–O E O
D–I U
E–I
F–
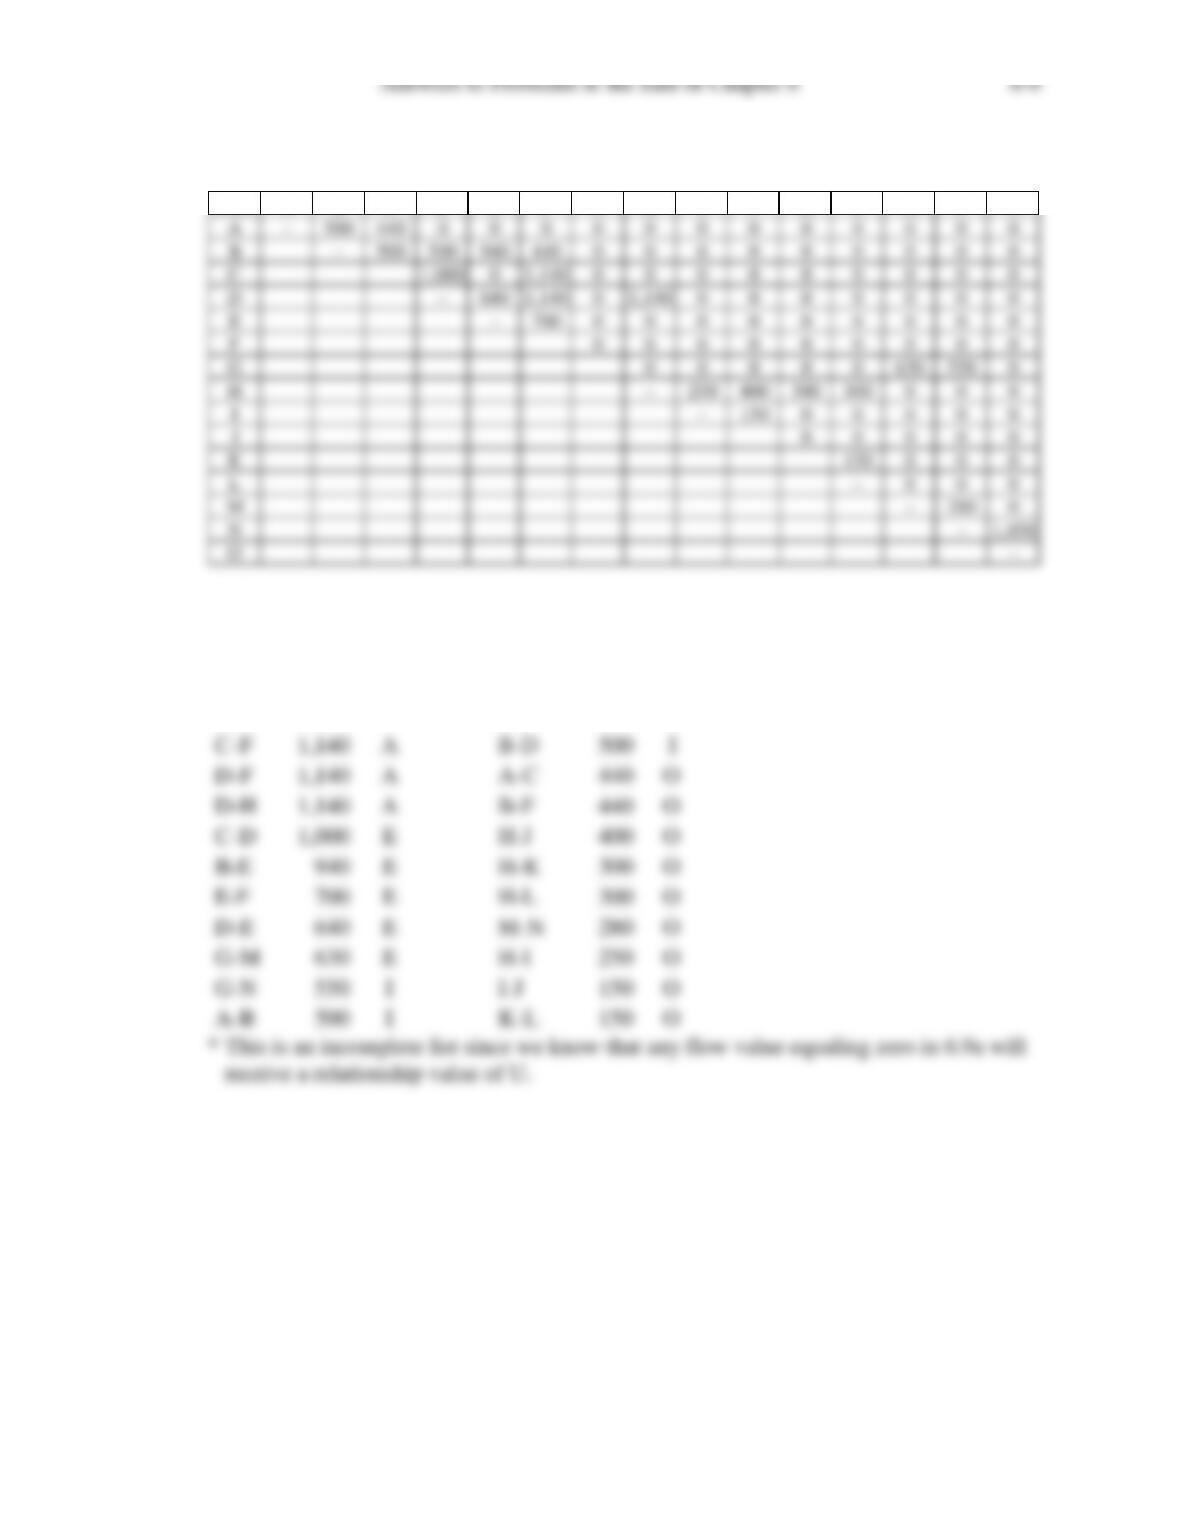
6.9a From-To Chart
Dept. A B C D E F G H I J K L M N O
A–500 440 0 0 0 0 0 0 0 0 0 0 0 0
B–500 500 940 440 0 0 0 0 0 0 0 0 0
C–1,000 01,140 0 0 0 0 0 0 0 0 0
D–640 1,140 01,140 0 0 0 0 0 0 0
E–700 0 0 0 0 0 0 0 0 0
F–0 0 0 0 0 0 0 0 0
G–0 0 0 0 0 630 550 0
H–250 400 300 300 0 0 0
I–150 0 0 0 0 0
J–0 0 0 0 0
K–150 0 0 0
L–0 0 0
M–280 0
N–1,450
O–
6.9b SLP Approach
Rank flow values
N–O 1,450 A B–C 500 I
C-F 1,140 A B–D 500 I
D–F 1,140 A A–C 440 O
D–H 1,140 A B–F 440 O
C-D 1,000 E H–J 400 O
B–E 940 E H-K 300 O
E–F 700 E H-L 300 O
D–E 640 E M-N 280 O
G–M 630 E H-I 250 O
G–N 550 I I–J 150 O
A–B 500 I K–L 150 O
Answers to Problems at the End of Chapter 6 6-7
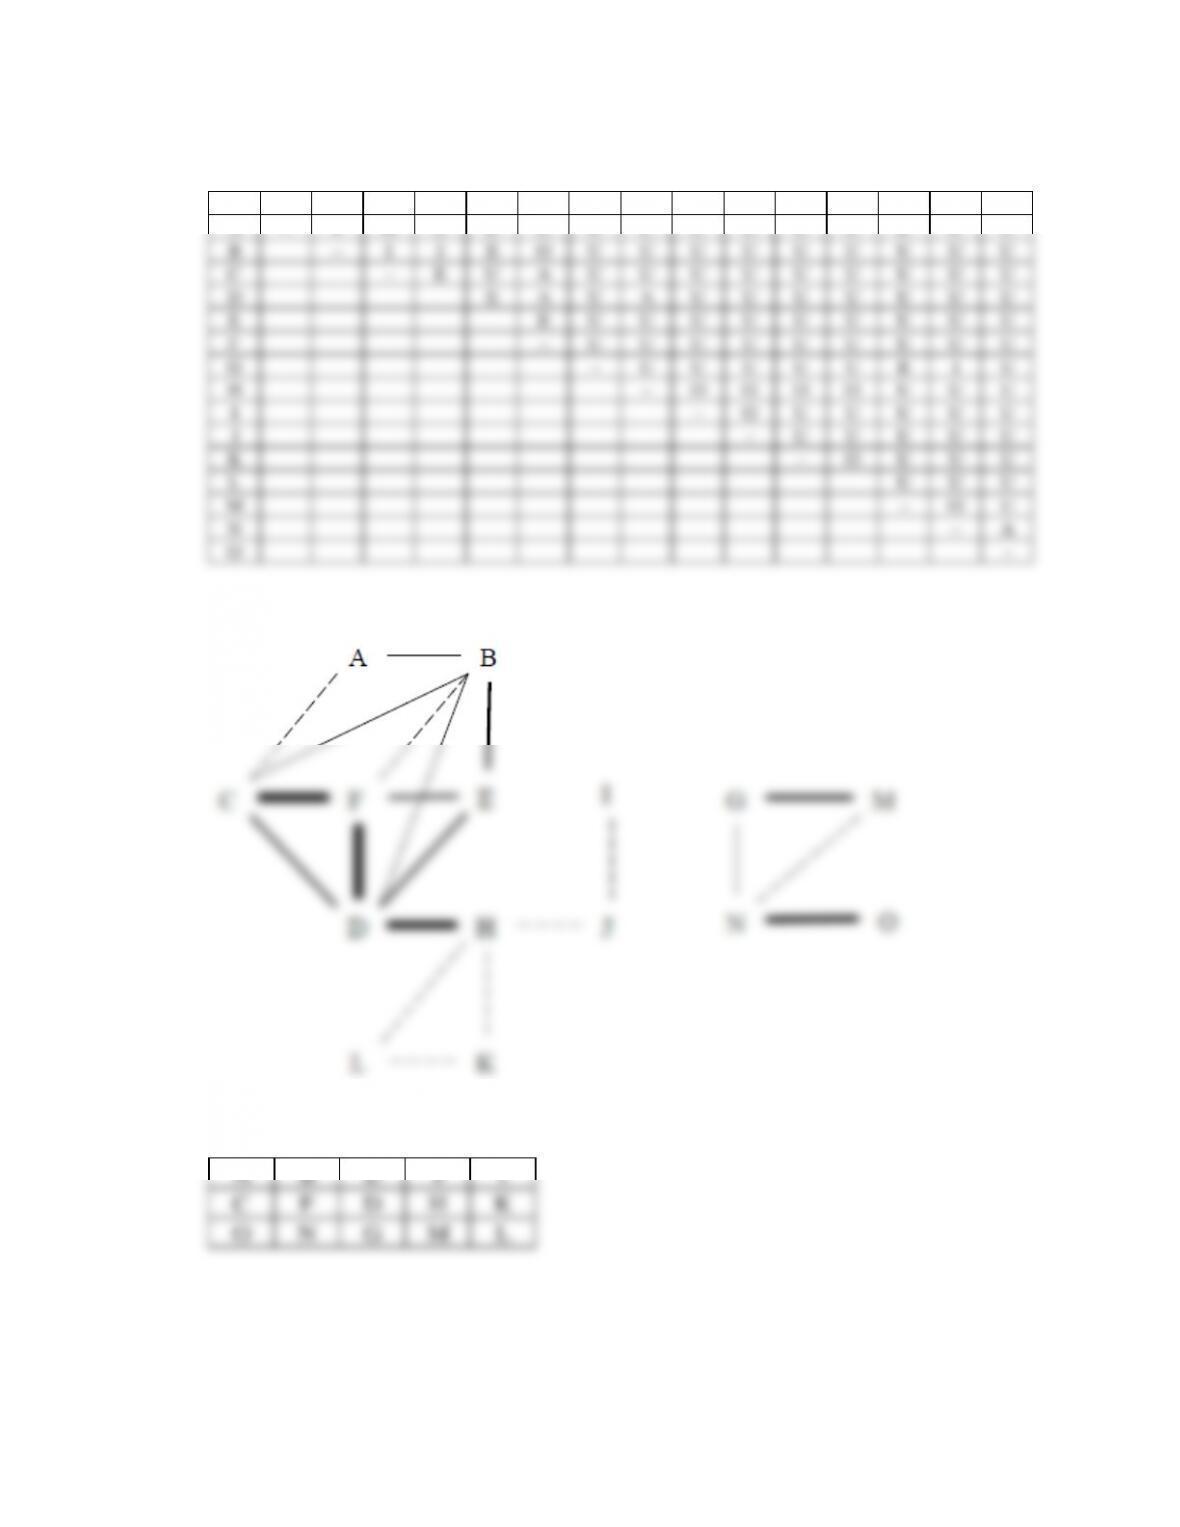
Activity Relationship Chart
Dept. A B C D E F G H I J K L M N O
A–I O U U U U U U U U U U U U
B–I I E O U U U U U U U U U
C–E U A U U U U U U U U U
D–E A U A U U U U U U U
E–E U U U U U U U U U
F–U U U U U U U U U
G–U U U U U E I U
H–O O O O U U U
I–O U U U U U
J–U U U U U
K–O U U U
L–U U U
M–O U
N–A
O–
Relationship Diagram
Block Layout
A B E J I
C F D H K
O N G M L
6.10a Relationship Diagram
Space Relationship Diagram
6.11 Relationship Diagram
Answers to Problems at the End of Chapter 6 6-10
Space Relationship Diagram
Block Layout
Answers to Problems at the End of Chapter 6 6-11
SECTION 6.4
6.12 𝑓
𝑖𝑗 =20,
𝑖,𝑗 ∈𝐹 𝑓
𝑖𝑗 =−10,
𝑖,𝑗 ∈𝐹
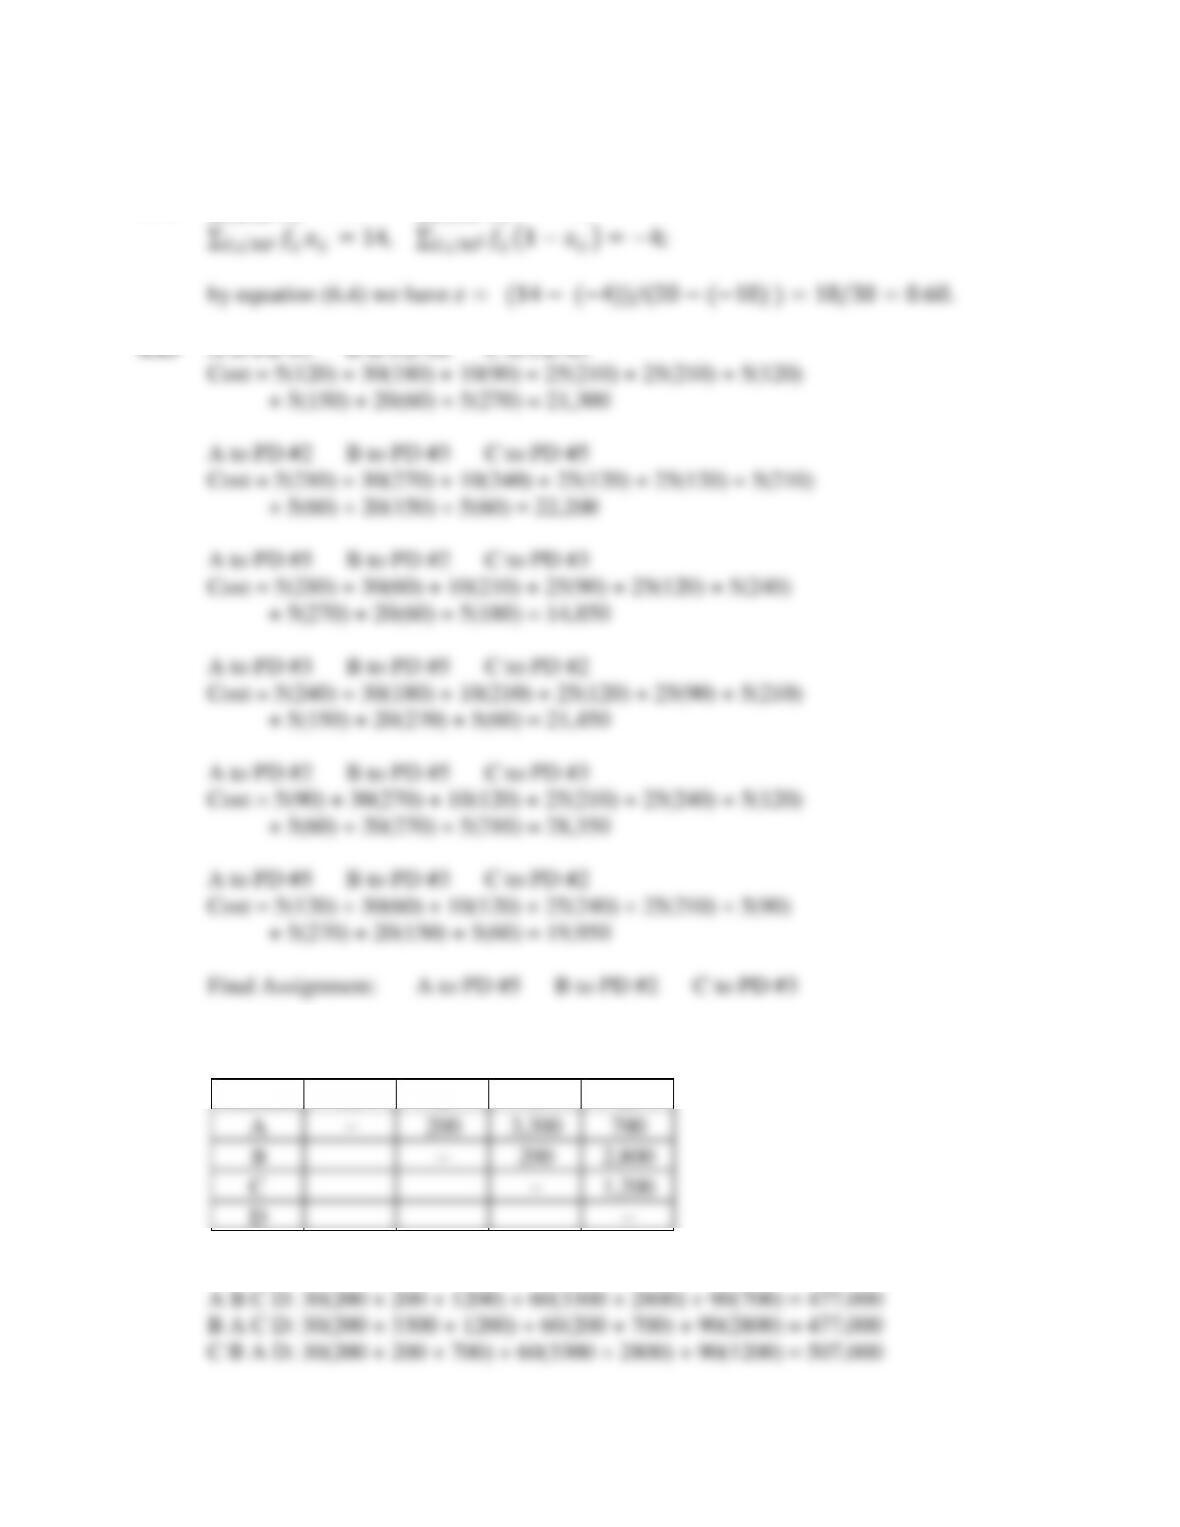
6.13 A to PD #3 B to PD #2 C to PD #5
6.14 Flow-Between Chart
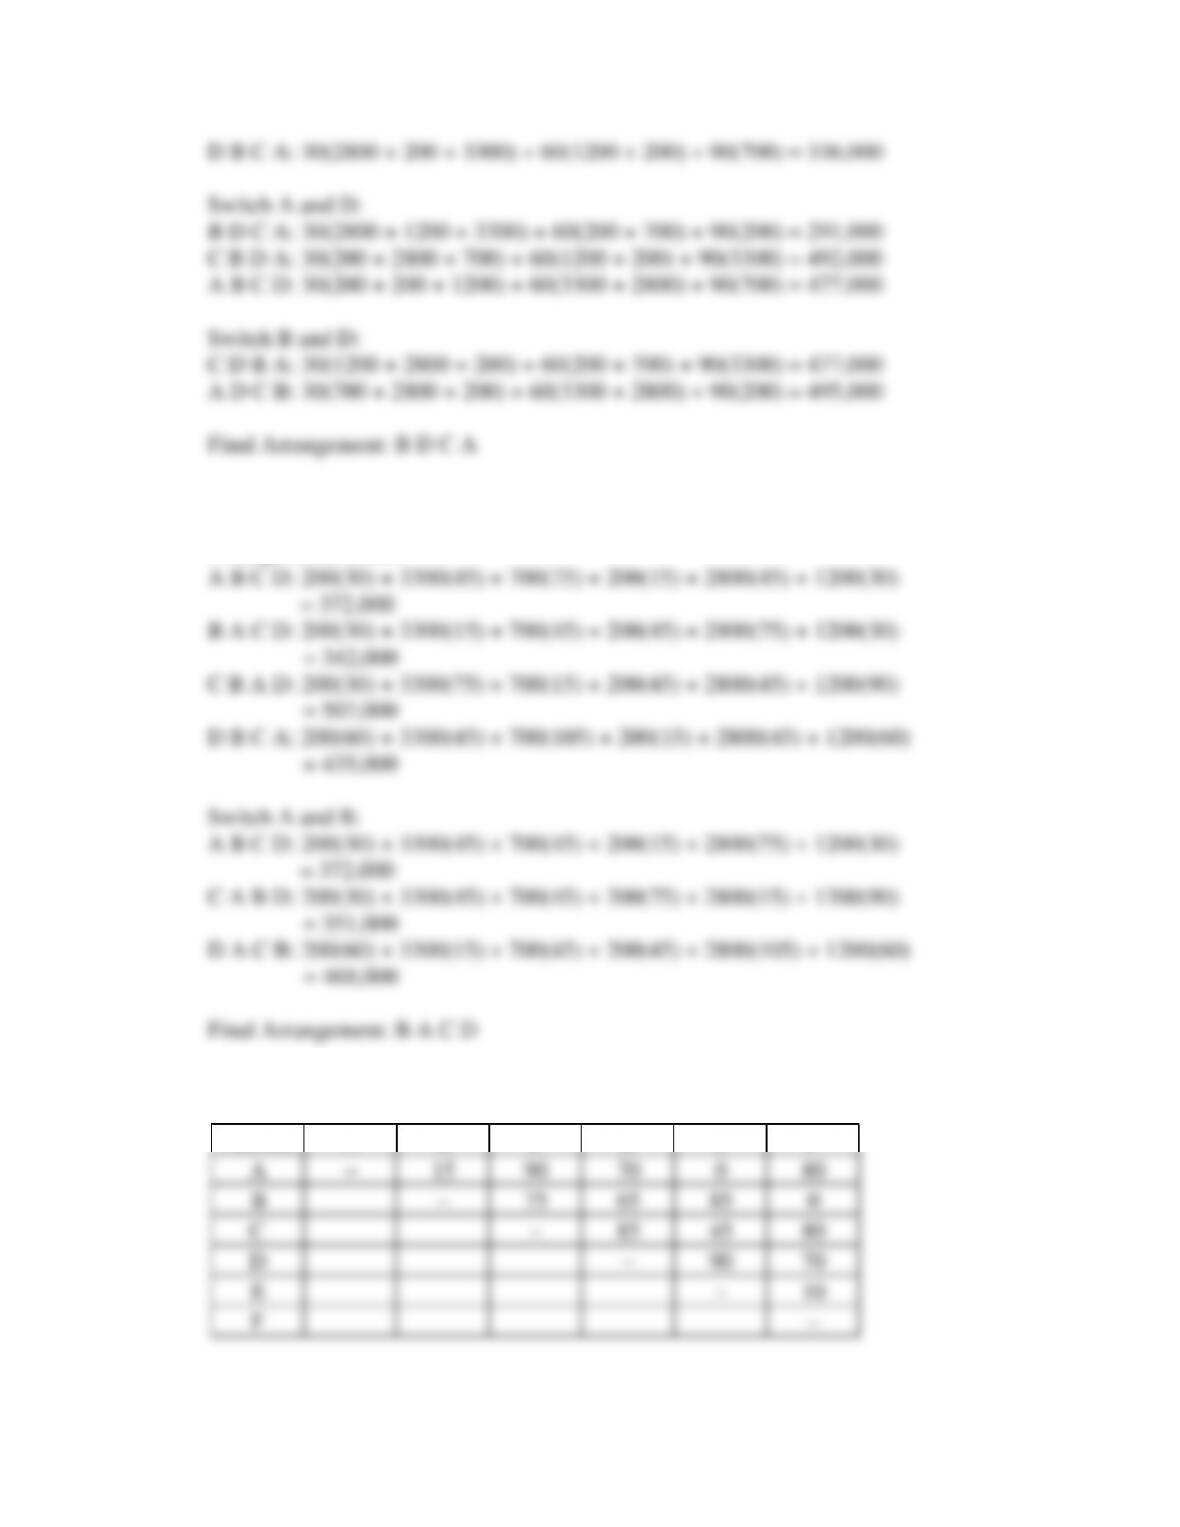
Arrangements/Costs:
Machine A B C D
A–200 3,300 700
B–200 2,800
C–1,200
D–
Answers to Problems at the End of Chapter 6 6-12
6.15 Flow-Between chart is identical to the one presented in the solution to Problem 6.14.
Arrangements/Costs:
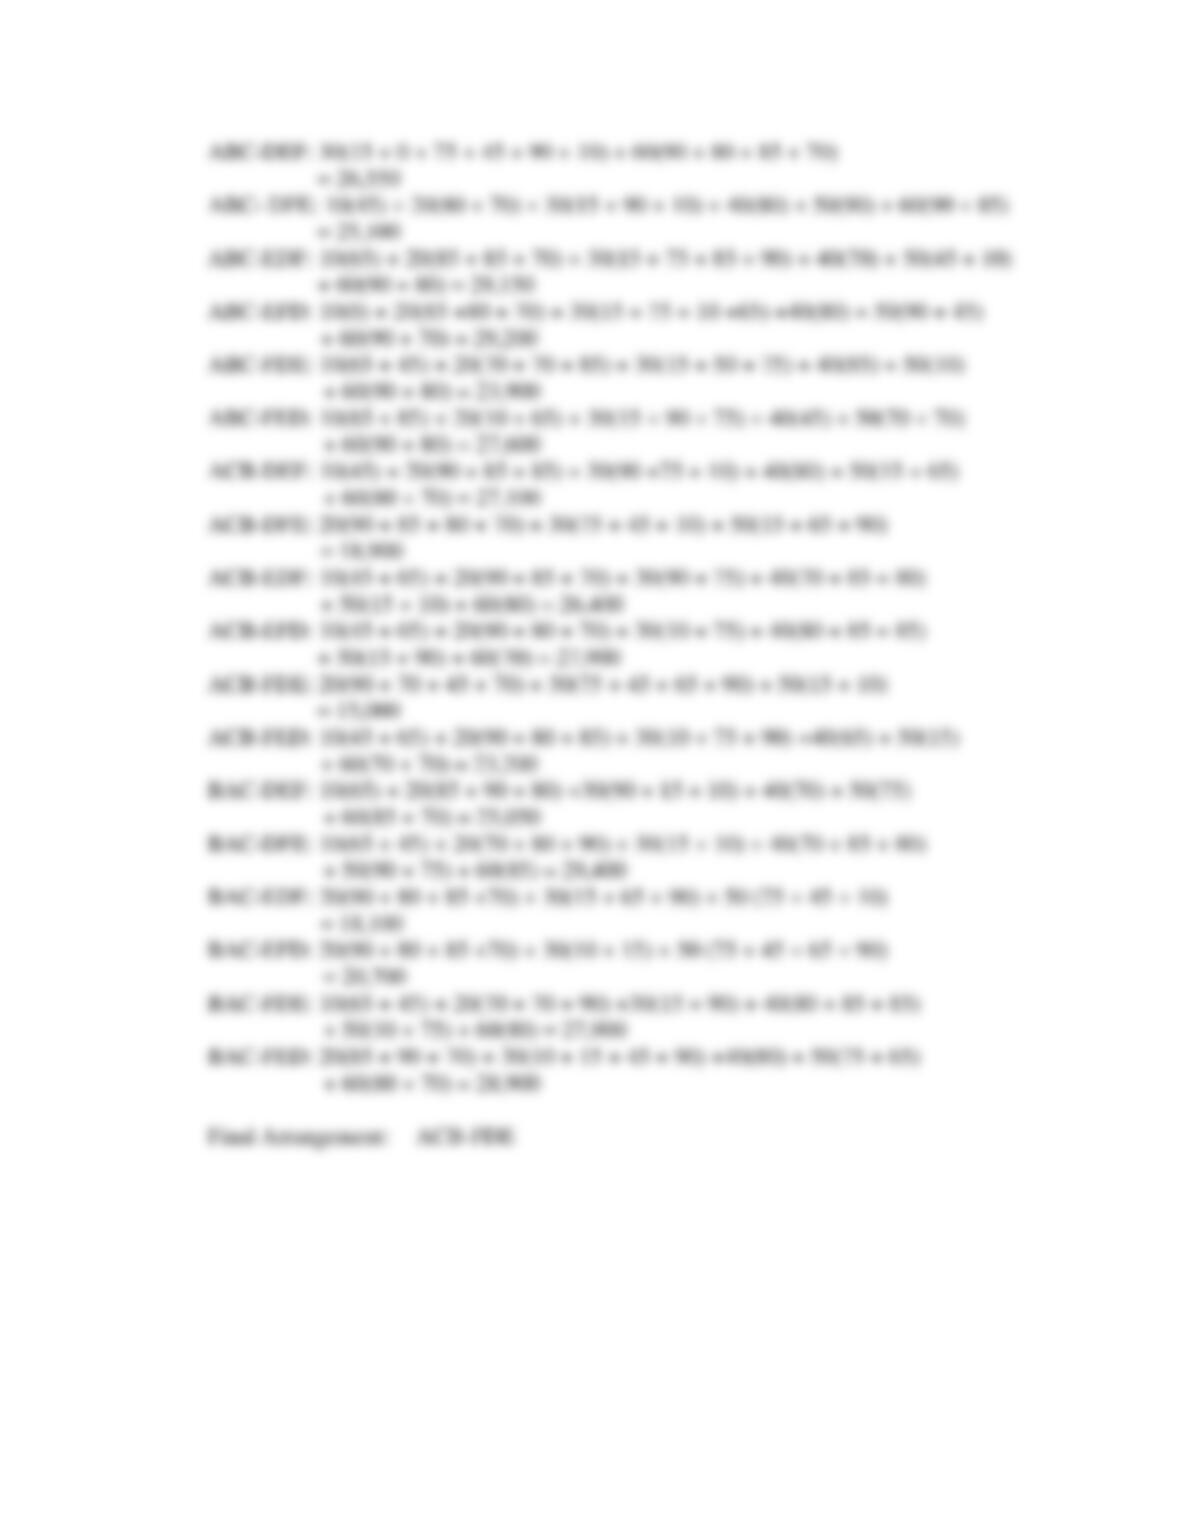
6.16 Flow-Between Chart
Machine A B C D E F
A–15 90 70 080
B–75 65 85 0
C–85 45 80
D–90 70
E–10
F–
Answers to Problems at the End of Chapter 6 6-13
Answers to Problems at the End of Chapter 6 6-14
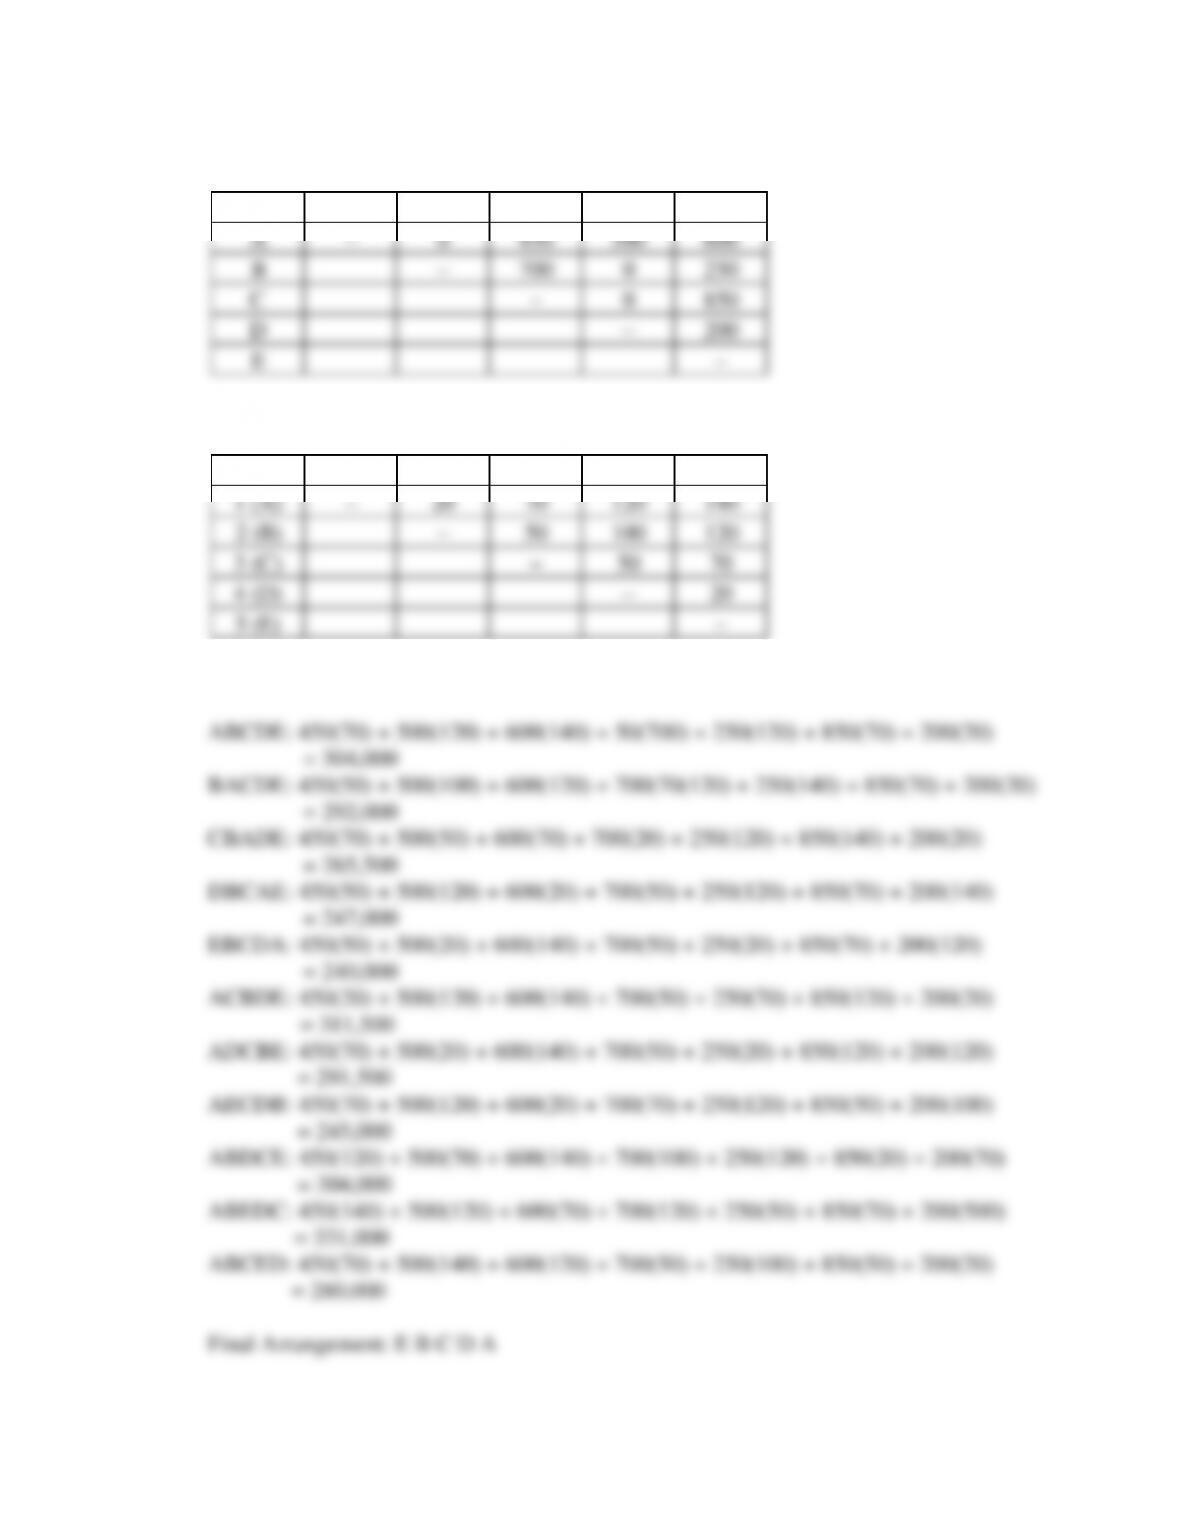
6.17 Flow-Between Chart
Distance Matrix (w/ initial assignments based on diagram)
Arrangements/Costs:
Machine A B C D E
A–0450 500 600
B–700 0250
C–0850
D–200
E–
1 2 3 4 5
1 (A) –20 70 120 140
2 (B) –50 100 120
3 (C) –50 70
4 (D) –20
5 (E) –
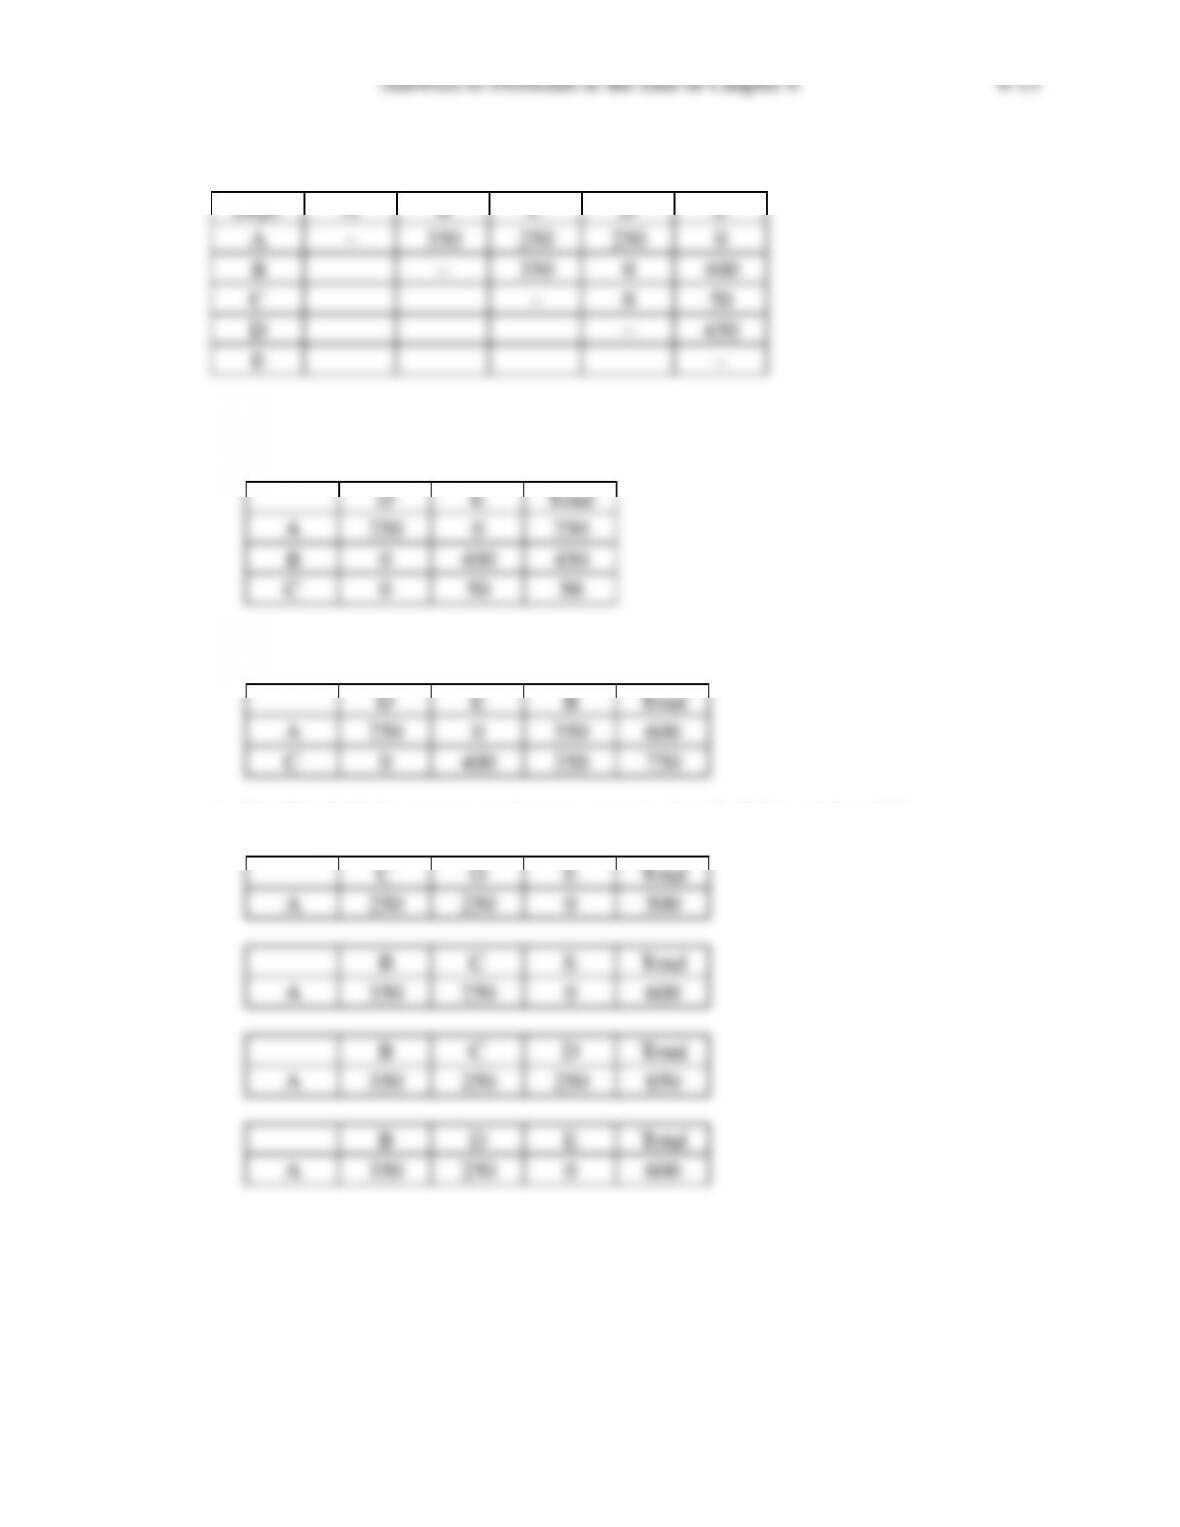
6.18 Flow-Between Chart
1. Determine the departments with largest weight: D and E; weight = 450
2. Select the third department to enter: B; weight = 400
3. Select the next department to enter: C; in face D-E-B; weight = 750
4. Decide which face to locate department A; in face B-C-D; weight = 850
A350 250 0600
A350 250 250 850
A350 250 0600
Dept. A B C D E
A–350 250 250 0
B–350 0400
C–050
D–450
E–
D E Total
A250 0250
B 0 400 450
C 0 50 50
D E B Total
A250 0350 600
C 0 400 350 750
C D E Total
A250 250 0500