Valuation
Measuring and Managing the Value of Companies
5th Edition
Chapter 7 Solutions
Reorganizing the Financial Statements
Version 1.0
April 1, 2010

Chapter 7
Ques!ons 1-3
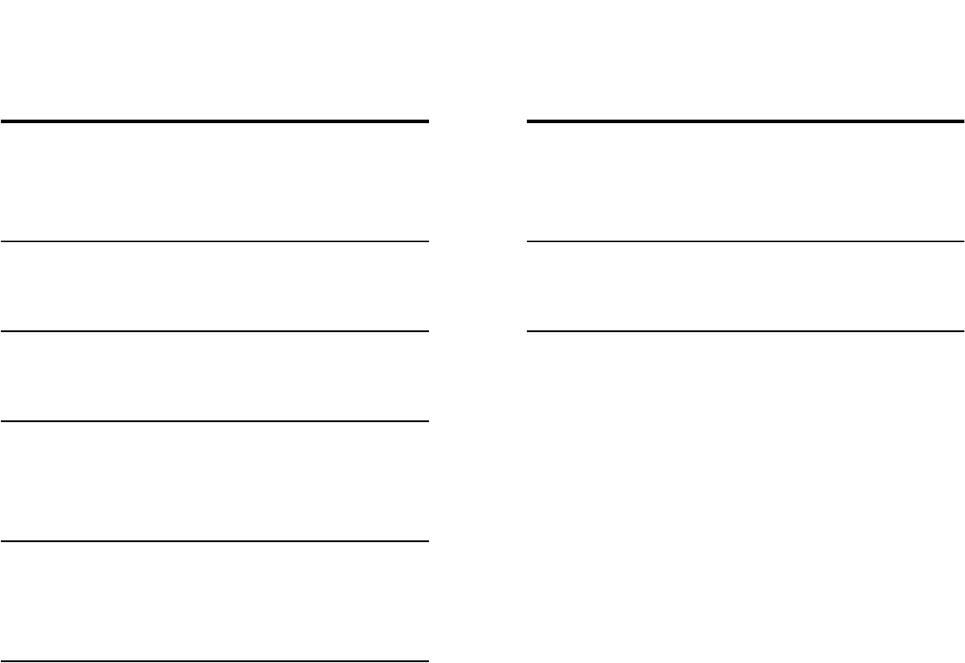
Ratio Company A Company B Company C
Return on assets 14.3% 13.0% 11.4%
Return on equity 15.8% 14.3% 21.8%
Return on invested capital 15.8% 15.8% 15.8%
Question 1
Return on invested capital best measures opera!ng performance. All three companies have the same opera!ng performance!
Question 2
Companies that hold less than 20% of another company (or subsidiary) only record income when dividends are paid. Therefore,
profit will be under reported. This causes return on assets to be distorted downwards. Since Company B
has $50 million in equity investments, but no corresponding income, its ROA is lower than Company A.
Question 3
Company C’s return on equity outpaces both Company A and Company B because the company uses leverage. Leverage
will magnify opera!ng results. Leverage makes good results look great, but can bankrupt companies with poor performance.
Return on invested capital best measures opera!ng performance. All three companies have the same opera!ng performance!
Companies that hold less than 20% of another company (or subsidiary) only record income when dividends are paid. Therefore,
Company C’s return on equity outpaces both Company A and Company B because the company uses leverage. Leverage
will magnify opera!ng results. Leverage makes good results look great, but can bankrupt companies with poor performance.

Chapter 7
Ques!on 4
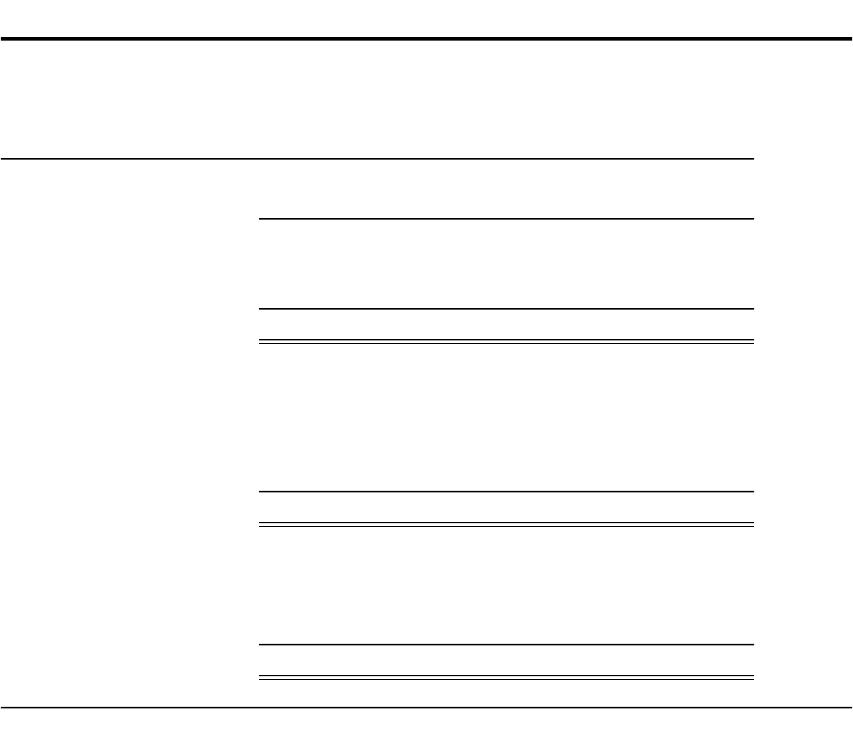
HealthCo
Reorganized financial statements
Prior Current Prior
NOPLAT Year Year Total funds invested Year
Revenues 605.0 665.0 Working cash 5
Cost of sales (200.0) (210.0) Accounts receivable 45
Selling costs (300.0) (320.0) Inventories 15
Deprecia!on (40.0) (45.0) Accounts payable (10)
Opera!ng income 65.0 90.0 Working capital 55
Opera!ng taxes (17.8) (26.5) Property, plant & equipment 250
NOPLAT 47.3 63.5 Invested capital 305
Prepaid pension assets 10
Reconciliation of NOPLAT Total funds invested 315
Net income 44.0 60.0
0.0 0.0
ABer-tax interest expense 3.3 9.8 Reconciliation of total funds invested
ABer-tax gain on sale 0.0 (16.3) Short-term debt 20
NOPLAT 47.3 53.5 Long-term debt 70
Restructuring reserves 20
Debt and debt equivalents 110
Equity 205
Total funds invested 315
Tax audit1
1 Included to be consistent with Ques!on 6

HealthCo
Ra!o Analysis
Current Prior Current
Year Ratio Year Year
5 ROIC 15.5% 19.5%
55
20 Opera!ng tax rate 27.3% 29.4%
(15) Marginal tax rate 35.0% 35.0%
65
260
325
50
375
40
70
0
110
265
375
Chapter 7
Ques!on 5
HealthCo HealthCo
Cash Dow available to investors Reconcilia!on of cash Dow available to investors
Current Current
year year
Revenues 665.0 ABer-tax interest expense 9.8
Cost of sales (210.0) Decrease in short-term debt (20.0)
Selling costs (320.0) Decrease in long-term debt 0.0
Deprecia!on (45.0) Restructuring reserves 20.0
Opera!ng income 90.0 9.8
Opera!ng taxes (26.5) Dividends 0
NOPLAT 63.5 Cash Dow available to investors 9.8
Deprecia!on 45.0
Gross cash Dow 108.5
Increase in working capital (10.0)
Capital expenditures (55.0)
Free cash Dow 43.5
Prepaid pension assets (40.0)
ABer-tax gain on sale 16.3
Cash Dow available to investors 19.8

Chapter 7
Ques!on 6
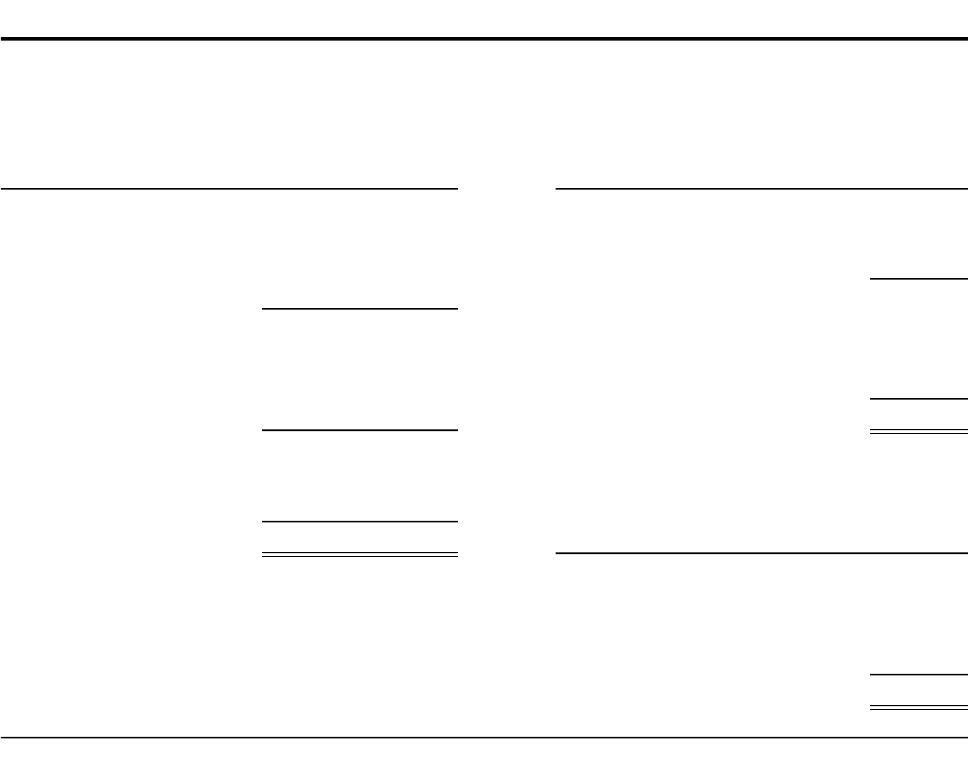
HealthCo
Reconcilia!on of eFec!ve taxes
Prior Current
year year
Statutory taxes 21.0 35.0
Manufacturing investments (5.0) (5.0)
Audit expense 0.0 10.0
EFec!ve taxes 16.0 40.0
Statutory taxes 35.0% 35.0%
Manufacturing investments -8.3% -5.0%
Audit expense 0.0% 10.0%
EFec!ve taxes 26.7% 40.0%
profit
Earnings before taxes 60 100
Opera!ng profit 65 90
Tax rates
Statutory (marginal) tax rate 35.0% 35.0%
Opera!ng tax rate 27.3% 29.4%
EFec!ve tax rate 26.7% 40.0%
Chapter 7
Ques!on 7
Commentary
Excess cash is not “invested” capital, and is not necessary for core
opera!ons. Therefore, it should be analyzed and valued separately.
Including cash in the computa!on of ROIC will incorrectly depress
the ROIC.
$ millions
Company A Company B Company C
Opera!ng pro1t 100 100 100
Interest 0 0 (20)
Earnings before taxes 100 100 80
Taxes (25) (25) (20)
Net income 75 75 60
Balance sheet:
Inventory 125 125 125
Property and equipment 400 400 400
Equity investments 0 50 0
Total assets 525 575 525
Accounts payable 50 50 50
Debt 0 0 200
Equity 475 525 275
Liabili!es and equity 525 575 525
Exhibit Data:
Tax rate 25%
EXHIBIT 7.15 Ratio Analysis: Consolidated Financial Statements
$ million
Prior Current Prior
Income statement year year Balance sheet year
Revenues 605 665 Working cash 5
Cost of sales (200) (210) Accounts receivable 45
Selling costs (300) (320) Inventories 15
Deprecia!on (40) (45) Current assets 65
Opera!ng income 65 90
Property, plant & equipment 250
Interest expense (5) (15) Prepaid pension assets 10
Gain on sale 0 25 Total assets 325
Earnings before taxes 60 100
Accounts payable 10
Taxes (16) (40) Short-term debt 20
Net income 44 60 Restructuring reserves 20
Current liabili!es 50
Long-term debt 70
Equity 205
Liabili!es and equity 325
Exhibit Data:
Statutory (marginal) tax rate 35.0% 35.0%
Opera!ng tax rate 29.4% 29.4%
EFec!ve tax rate 40.0% 40.0%
Check
Balance sheet 0 0
Exhibit 7.16 HealthCo: Income Statement and Balance Sheet

Current
year
5
55
20
80
260
50
390
15
40
0
55
70
265
390