Unlock document.
This document is partially blurred.
Unlock all pages and 1 million more documents.
Get Access

Reckitt Benckiser Reckitt Benckiser
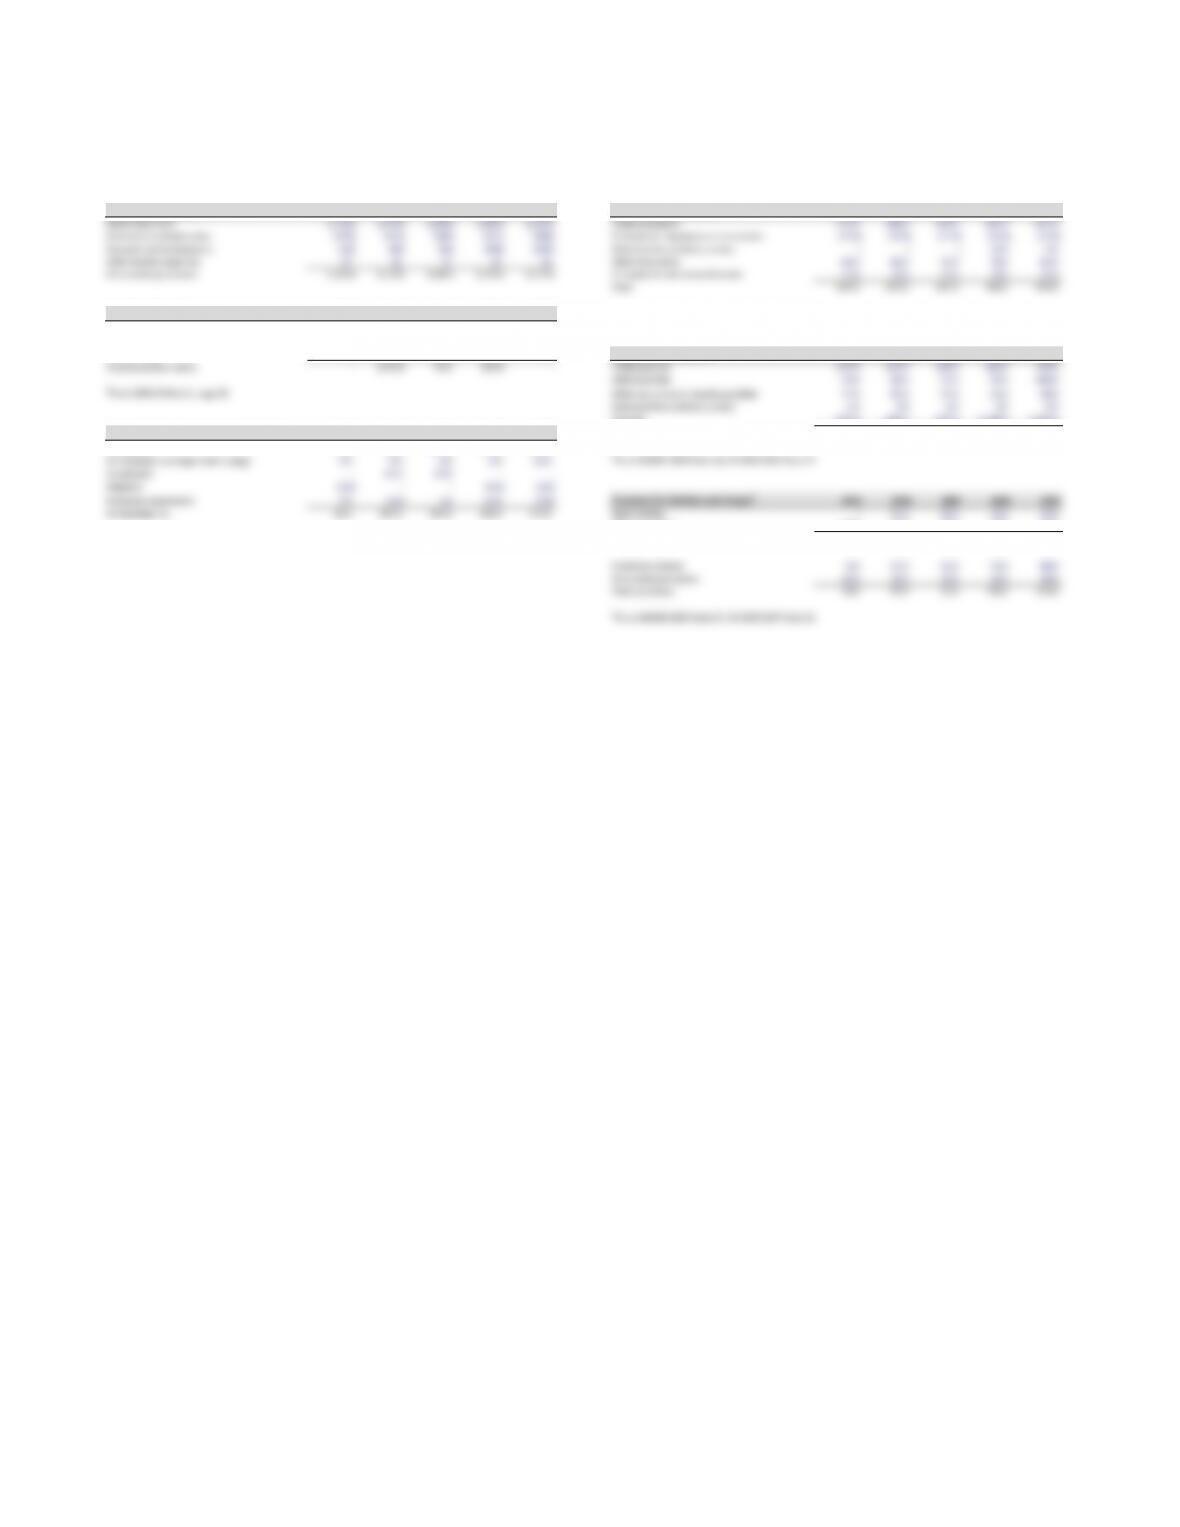
Income statement Balance sheet
GBP million 2005 2006 2007 2008 2009 Assets 2005 2006 2007 2008 2009
Net revenues 4,179 4,922 5,269 6,563 7,753 Inventories 270 322 382 556 486
Cost of sales (1,886) (2,133) (2,197) (2,673) (3,089) Trade and other receivables 545 670 693 906 928
Gross profit 2,293 2,789 3,072 3,890 4,664 Derivative financial instruments – – – 69 1
Available for sale financial assets 77 19 39 6 4
Net operating expenses (1,453) (1,730) (1,882) (2,355) (2,773) Cash and cash equivalents 978 305 328 417 351
Operating profit (EBIT) 840 1,059 1,190 1,535 1,891 Current assets 1,870 1,316 1,442 1,954 1,770
Net finance income 36 (36) (24) (31) 1Goodwill and other intangible assets 1,766 3,842 3,811 6,454 6,090
Exceptional items –(149) 43 (30) –Property, plant, and equipment 485 425 479 637 639
Earnings before income taxes 876 874 1,209 1,474 1,892 Deferred tax assets 77 144 106 93 121
Financial assets – – – 25 16
Income tax (207) (200) (271) (354) (474) Other receivables 15 10 30 19 25
Net income 669 674 938 1,120 1,418 Total assets 4,213 5,737 5,868 9,182 8,661
Liabilities and equity 2005 2006 2007 2008 2009
Borrowings 88 973 487 1,571 132
Provisions for liabilities and charges 447 36 73 88
Trade and other payables 1,225 1,481 1,635 2,189 2,286
Tax liabilities 206 239 266 383 385
Current liabilities 1,523 2,740 2,424 4,216 2,891
Borrowings 80 11 544
Deferred tax liabilities 377 766 705 1,172 1,145
Retirement benefit obligations 261 216 187 316 393
Provisions for liabilities and charges 10 15 19 31 36
Tax liabilities 85 100 120 128 158
Other noncurrent liabilities 21 23 23 21 20
Total liabilities 2,357 3,871 3,483 5,888 4,647
Equity minority interest 13222
Share capital 76 76 72 72 72
Share premium account 479 527 –––
Retained earnings, net of reserves 1,300 1,260 2,311 3,220 3,940
Total liabilities and equity 4,213 5,737 5,868 9,182 8,661
Reckitt Benckiser Reckitt Benckiser
Income statement Balance sheet
Net operating expenses 2005 2006 2007 2008 2009
Trade and other receivables32005 2006 2007 2008 2009
Distribution costs (1,161) (1,376) (1,503) (1,857) (2,119) Trade receivables 471.0 588.0 596.0 804.0 834.0
General and administrative (256) (313) (304) (412) (546) Provision for impairment of receivables (12.0) (16.0) (11.0) (13.0) (22.0)
Research and development (63) (82) (92) (109) (126) Derivative financial instruments – – – 16.0 3.0
Other income (expense) 27 41 17 23 18 Other receivables 69.0 80.0 76.0 70.0 81.0
Net operating expenses (1,453) (1,730) (1,882) (2,355) (2,773) Prepayments and accrued income 17.0 18.0 21.0 29.0 32.0
Total 545.0 670.0 682.0 906.0 928.0
Exceptional items12005 2006 2007 2008 2009 3From AR2007-2009 Note 13, AR 2005-2006 Note 12.
Profit on disposal of business – – 127.0 – –
Asset impairments –(31.0) (54.0) – –
Restructuring –(118.0) (30.0) (30.0) –
Trade and other payables42005 2006 2007 2008 2009
Total exceptional items –(149.0) 43.0 (30.0) –Trade payables 570.0 646.0 658.0 882.0 790.0
Other payables 40.0 68.0 57.0 64.0 106.0
1From 2009 AR Note 3, page 36. Other tax and social security payables 47.0 69.0 77.0 91.0 98.0
Derivative financial instruments 1.0 2.0 6.0 3.0 5.0
Accruals 567.0 696.0 837.0 1,149.0 1,287.0
Accumulated impairment and amortization22005 2006 2007 2008 2009 Total 1,225.0 1,481.0 1,635.0 2,189.0 2,286.0
At January 1 76.0 86.0 107.0 144.0 159.0
Amortization and impairment charge 9.0 9.0 9.0 8.0 21.0
4From AR2007-2009 Note 18, AR 2005-2006 Note 17.
Impairment –14.0 27.0 – –
Disposals (2.0) – – (5.0) (2.0)
Exchange adjustments 3.0 (2.0) 1.0 12.0 (4.0)
Provisions for liabilities and charges52005 2006 2007 2008 2009
At December 31 86.0 107.0 144.0 159.0 174.0 Restructuring –51.0 36.0 51.0 52.0
Other provisions 14.0 11.0 19.0 53.0 72.0
2From AR2007-2009 Note 10, AR 2005-2006 Note 9. Total provisions 14.0 62.0 55.0 104.0 124.0
Current provisions 4.0 47.0 36.0 73.0 88.0
Noncurrent provisions 10.0 15.0 19.0 31.0 36.0
Total provisions 14.0 62.0 55.0 104.0 124.0
5From AR2008-2009 Note 17, AR 2005-2007 Note 16.

Reckitt Benckiser Reckitt Benckiser
Organic growth1Employees2
percent 2005 2006 2007 2008 2009 Staff numbers (000s) 2005 2006 2007 2008 2009
Organic growth 6.0% 7.0% 7.0% 10.0% 8.0% Europe 8.4 10.3 10.9 11.5 11.7
Currency fluctuation 2.0% 1.0% 3.0% 12.0% 10.0% North America and Australia 3.1 3.3 3.6 4.0 3.6
Portfolio change –10.0% –3.0% –Developing markets 8.8 8.3 8.9 8.5 9.2
Reported revenue growth 8.0% 18.0% 10.0% 25.0% 18.0% RBP n/a n/a n/a 0.3 0.4
Total 20.3 21.9 23.4 24.3 24.9
1RB Annual Report 2005–2009, page 8 (except 2008, page 1).
Reckitt Benckiser
Return on invested capital
Return on capital 2005 2006 2007 2008 2009
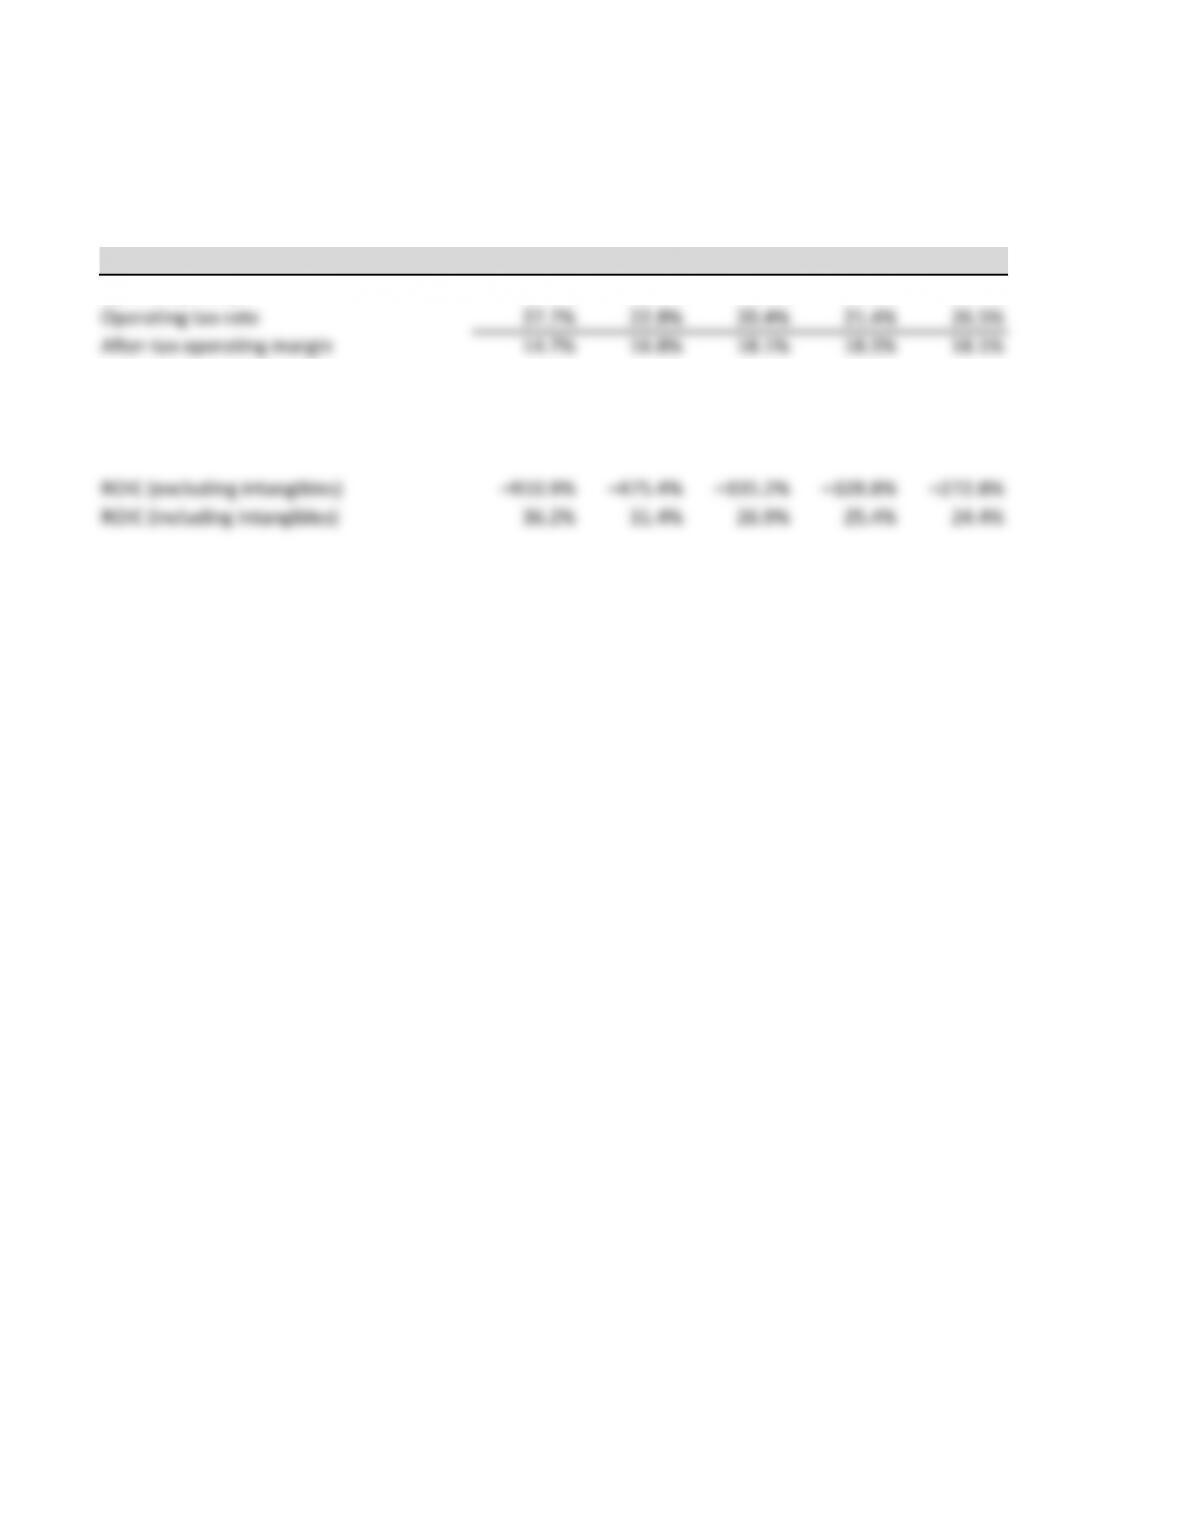
Operating margin 20.3% 21.7% 22.8% 23.5% 24.7%
Operating tax rate 27.7% 22.8% 20.4% 21.4% 26.5%
After-tax operating margin 14.7% 16.8% 18.1% 18.5% 18.1%
Capital turnover (excl. intangibles) (62.0) (28.4) (18.5) (17.8) (15.1)
Capital turnover (incl. intangibles) 2.5 1.9 1.5 1.4 1.3
ROIC (excluding intangibles) –910.9% –475.4% –335.2% –328.8% –272.8%
ROIC (including intangibles) 36.2% 31.4% 26.9% 25.4% 24.4%
Reckitt Benckiser Reckitt Benckiser
After-tax operating profits After-tax operating margins
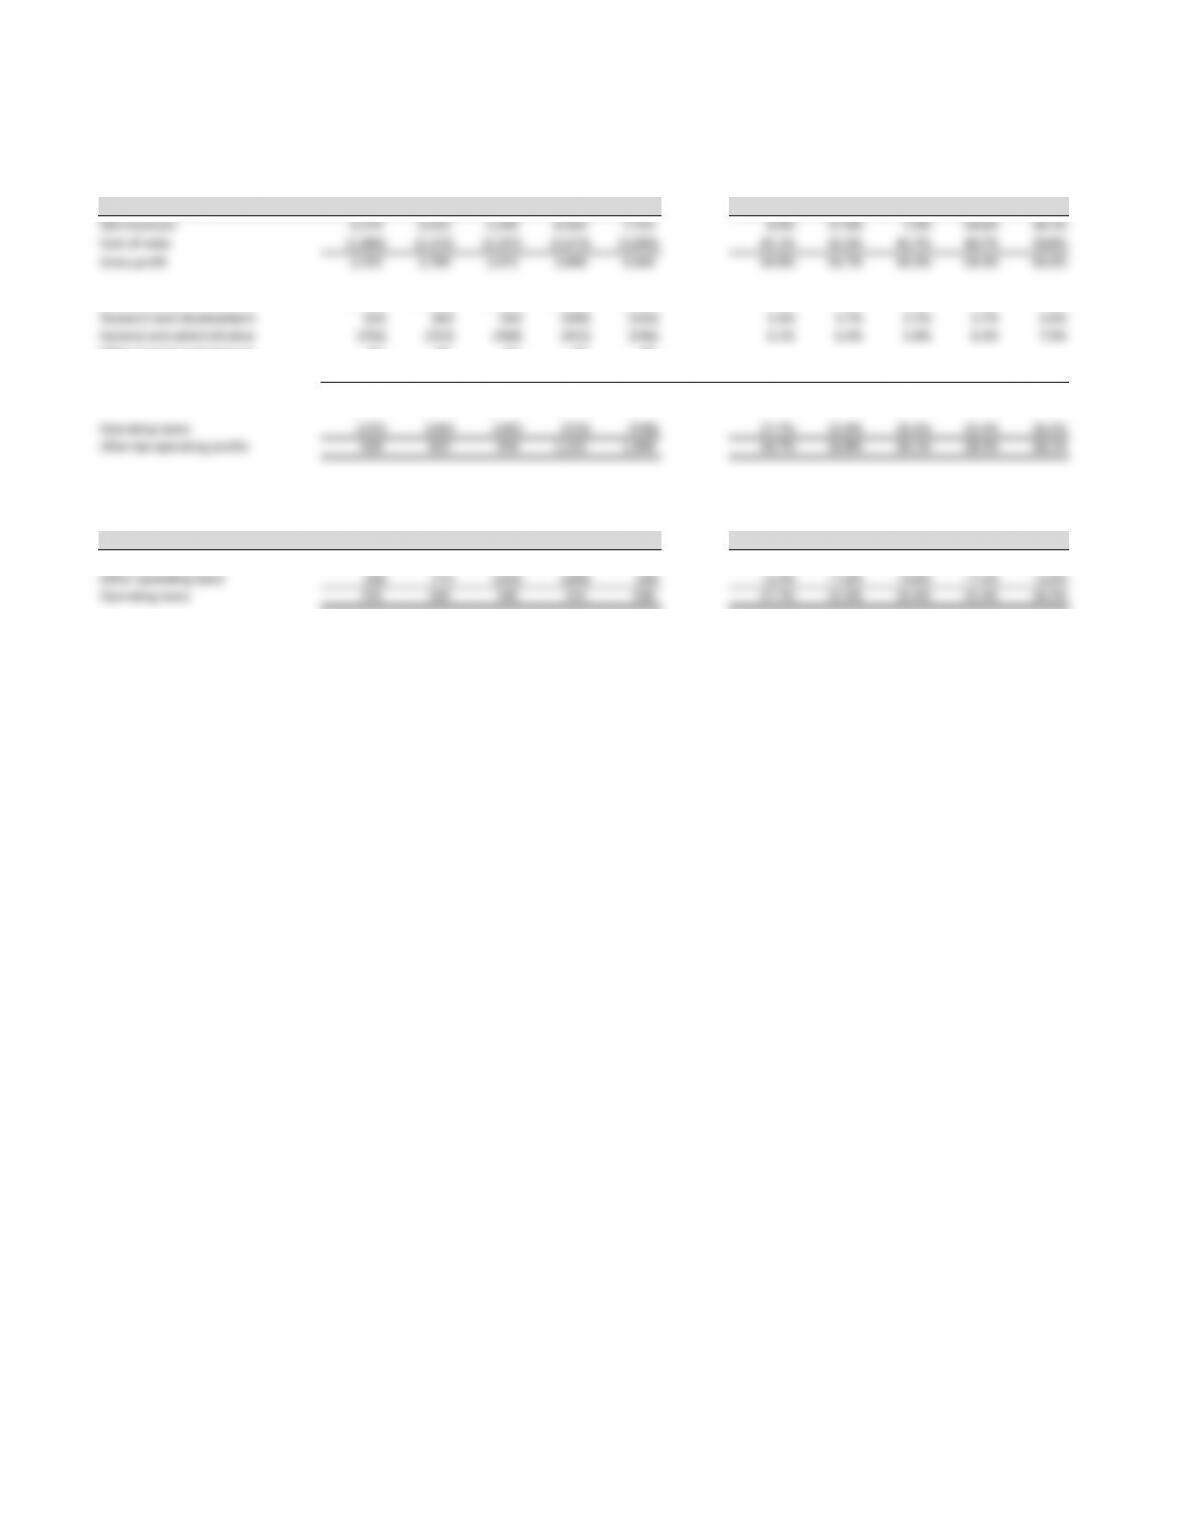
GBP million 2005 2006 2007 2008 2009 2005 2006 2007 2008 2009
Net revenues 4,179 4,922 5,269 6,563 7,753 8.0% 17.8% 7.0% 24.6% 18.1%
Cost of sales (1,886) (2,133) (2,197) (2,673) (3,089) 45.1% 43.3% 41.7% 40.7% 39.8%
Gross profit 2,293 2,789 3,072 3,890 4,664 54.9% 56.7% 58.3% 59.3% 60.2%
Marketing and distribution (1,161) (1,376) (1,503) (1,857) (2,119) 27.8% 28.0% 28.5% 28.3% 27.3%
Research and development (63) (82) (92) (109) (126) 1.5% 1.7% 1.7% 1.7% 1.6%
General and administrative (256) (313) (304) (412) (546) 6.1% 6.4% 5.8% 6.3% 7.0%
Other income and expense 27 41 17 23 18
Amortization 9 9 9 8 21
Operating profit (EBITA) 849 1,068 1,199 1,543 1,912 20.3% 21.7% 22.8% 23.5% 24.7%
Operating taxes (235) (243) (245) (331) (508) 27.7% 22.8% 20.4% 21.4% 26.5%
After-tax operating profits 614 825 954 1,212 1,404 14.7% 16.8% 18.1% 18.5% 18.1%
Operating taxes
GBP million 2005 2006 2007 2008 2009 2005 2006 2007 2008 2009
Marginal taxes on EBIT 254.9 320.2 360.0 439.7 535.6 30.0% 30.0% 30.0% 28.5% 28.0%
Other operating taxes (20) (77) (115) (109) (28) –2.4% –7.2% –9.6% –7.1% –1.5%
Operating taxes 235 243 245 331 508 27.7% 22.8% 20.4% 21.4% 26.5%

Reckitt Benckiser Reckitt Benckiser
Tax reconciliation table Tax reconciliation table
Liabilities and equity 2005 2006 2007 2008 2009 Operating Percent 2005 2006 2007 2008 2009 Marginal
Tax at UK corporation rate 263 262 363 420 530 Yes Tax at UK corporation rate 30.0% 30.0% 30.0% 28.5% 28.0% Yes
Tax at rates other than UK rate (38) (73) (125) (148) (55) Yes Tax at rates other than UK rate –4.3% –8.3% –10.3% –10.0% –2.9%
Adjustments with respect to uresolved matters
36 935 54 21
Adjustments with respect to uresolved matters
4.1% 1.0% 2.9% 3.7% 1.1%
Utilised tax losses (43) 19 30 (2) (25) Utilized tax losses –4.9% 2.2% 2.5% –0.1% –1.3%
Witholdings and local taxes 18 (4) 10 39 27 Yes Witholdings and local taxes 2.1% –0.5% 0.8% 2.6% 1.4%
Adjustment in respect of prior periods (16) (19) (20) (19) (29) Adjustment in respect of prior periods –1.8% –2.2% –1.7% –1.3% –1.5%
Other permanent differences (13) 6 (22) 10 5Other permanent differences –1.5% 0.7% –1.8% 0.7% 0.3%
Total tax charge 207 200 271 354 474 Total tax charge 23.6% 22.9% 22.4% 24.0% 25.1%
Earnings before taxes 876 874 1,209 1,474 1,892
Reckitt Benckiser Reckitt Benckiser
Tax breakout Tax rates
GBP millions 2005 2006 2007 2008 2009 Percent 2005 2006 2007 2008 2009
Statutory 263 262 363 420 530 Marginal tax rate 30.0% 30.0% 30.0% 28.5% 28.0%
Operating (20) (77) (115) (109) (28) Effective tax rate 23.6% 22.9% 22.4% 24.0% 25.1%
Nonoperating (36) 15 23 43 (28) Operating tax rate 27.7% 22.8% 20.4% 21.4% 26.5%
Effective taxes 207 200 271 354 474
Reckitt Benckiser Reckitt Benckiser
Invested capital Capital efficiency
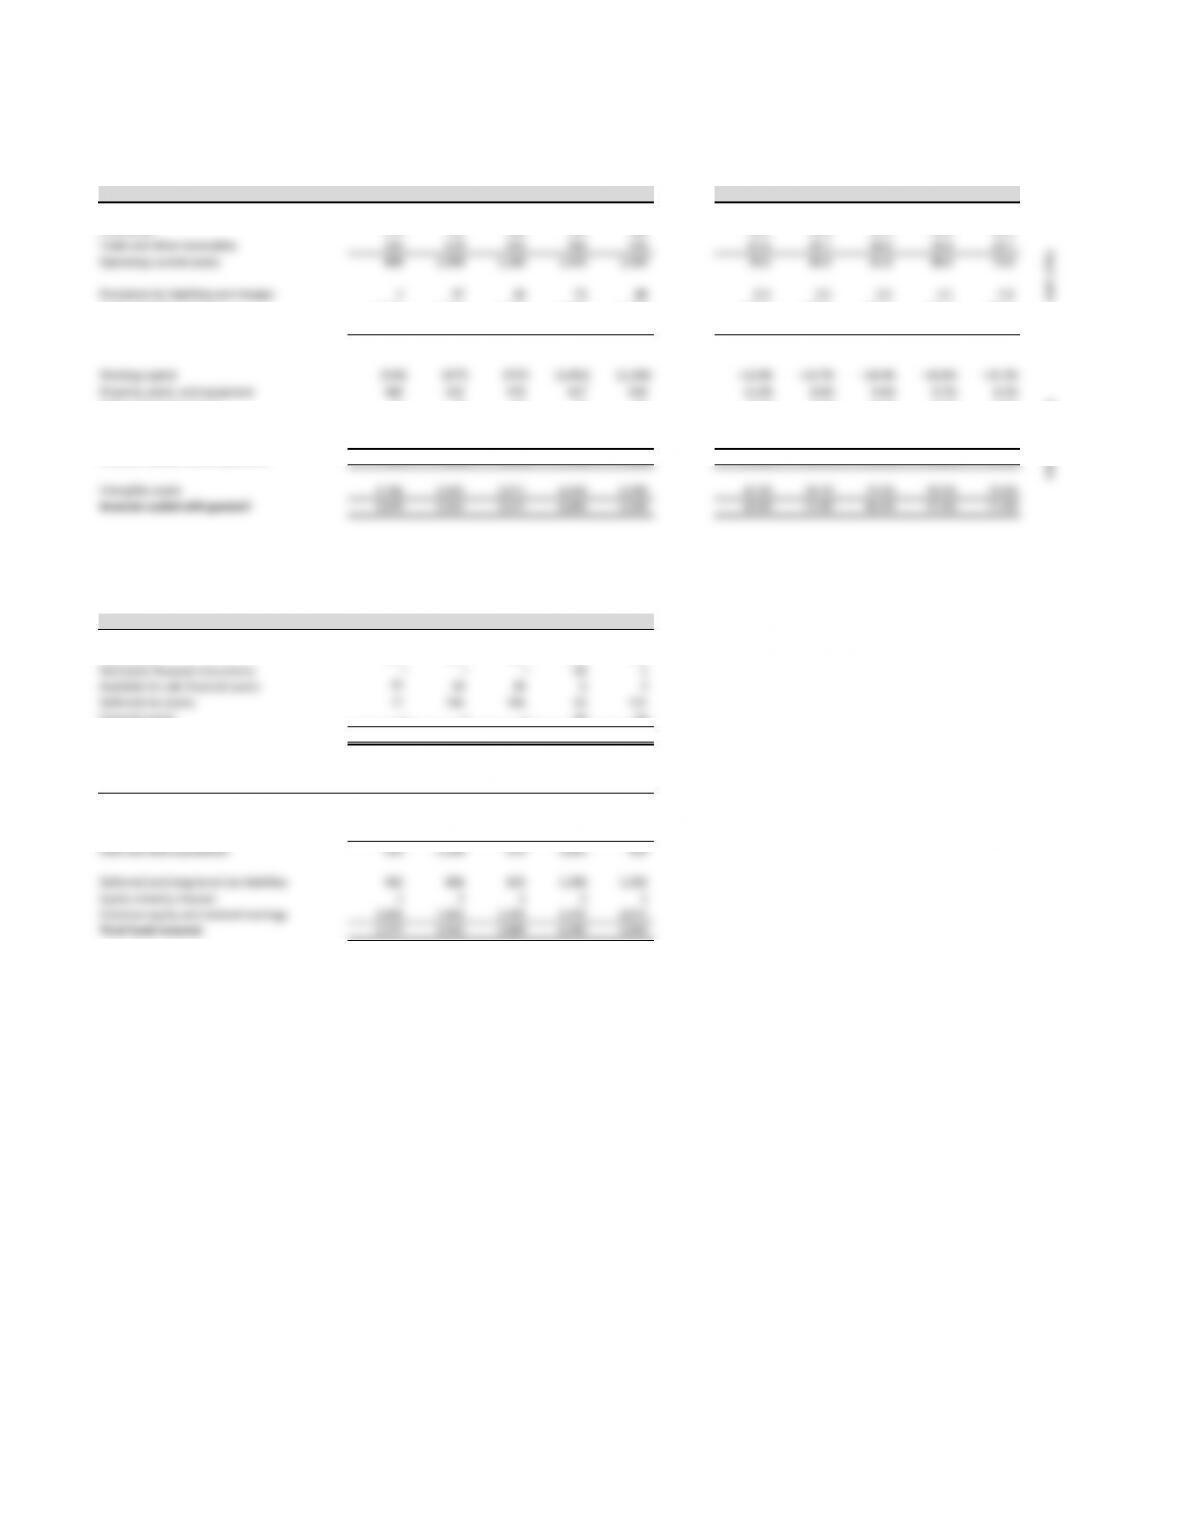
GBP million 2005 2006 2007 2008 2009 2005 2006 2007 2008 2009
Working cash 84 98 105 131 155 7.3 7.3 7.3 7.3 7.3
Inventories 270 322 382 556 486 23.6 23.9 26.5 30.9 22.9
Trade and other receivables 545 670 693 906 928 47.6 49.7 48.0 50.4 43.7
Operating current assets 899 1,090 1,180 1,593 1,569 78.5 80.9 81.8 88.6 73.9
Provisions for liabilities and charges 4 47 36 73 88 0.3 3.5 2.5 4.1 4.1
Trade and other payables 1,225 1,481 1,635 2,189 2,286 107.0 109.8 113.3 121.7 107.6
Tax liabilities 206 239 266 383 385 18.0 17.7 18.4 21.3 18.1
Operating current liabilities 1,435 1,767 1,937 2,645 2,759 125.3 131.0 134.2 147.1 129.9
Working capital (536) (677) (757) (1,052) (1,190) –12.8% –13.7% –14.4% –16.0% –15.3%
Property, plant, and equipment 485 425 479 637 639 11.6% 8.6% 9.1% 9.7% 8.2%
Other noncurrent assets 15 10 30 19 25 0.4% 0.2% 0.6% 0.3% 0.3%
Provisions for liabilities and charges (10) (15) (19) (31) (36) 0.2% 0.3% 0.4% 0.5% 0.5%
Other noncurrent liabilities (21) (23) (23) (21) (20) 0.5% 0.5% 0.4% 0.3% 0.3%
Invested capital without goodwill (67) (280) (290) (448) (582) –1.6% –5.7% –5.5% –6.8% –7.5%
Intangible assets 1,766 3,842 3,811 6,454 6,090 42.3% 78.1% 72.3% 98.3% 78.6%
Invested capital with goodwill 1,699 3,562 3,521 6,006 5,508 40.6% 72.4% 66.8% 91.5% 71.0%
Reckitt Benckiser
Reconciliation of total funds invested
GBP million 2005 2006 2007 2008 2009
Invested capital 1,699 3,562 3,521 6,006 5,508
Excess cash 894 207 223 286 196
Derivative financial instruments –––69 1
Available for sale financial assets 77 19 39 6 4
Deferred tax assets 77 144 106 93 121
Financial assets –––25 16
Total funds invested 2,747 3,932 3,889 6,485 5,846
GBP million 2005 2006 2007 2008 2009
Short-term borrowings 88 973 487 1,571 132
Long-term borrowings 80 11 5 4 4
Retirement benefit obligations 261 216 187 316 393
Debt and debt equivalents 429 1,200 679 1,891 529
Deferred (and long-term) tax liabilities 462 866 825 1,300 1,303
Equity minority interest 1 3 2 2 2
Common equity and retained earnings 1,855 1,863 2,383 3,292 4,012
Total funds invested 2,747 3,932 3,889 6,485 5,846
Percent of sales
Days' sales


