Henkel Integrative Case
Who is Henkel?
Axis Value Axis Value
2005 11,974 2005 1,162
2006 12,740 2006 1,296
2007 13,074 2007 1,344
2008 14,131 2008 779
2009 13,573 2009 1,080
CAGR 3.2% CAGR –1.8%
Sales
Operating profit
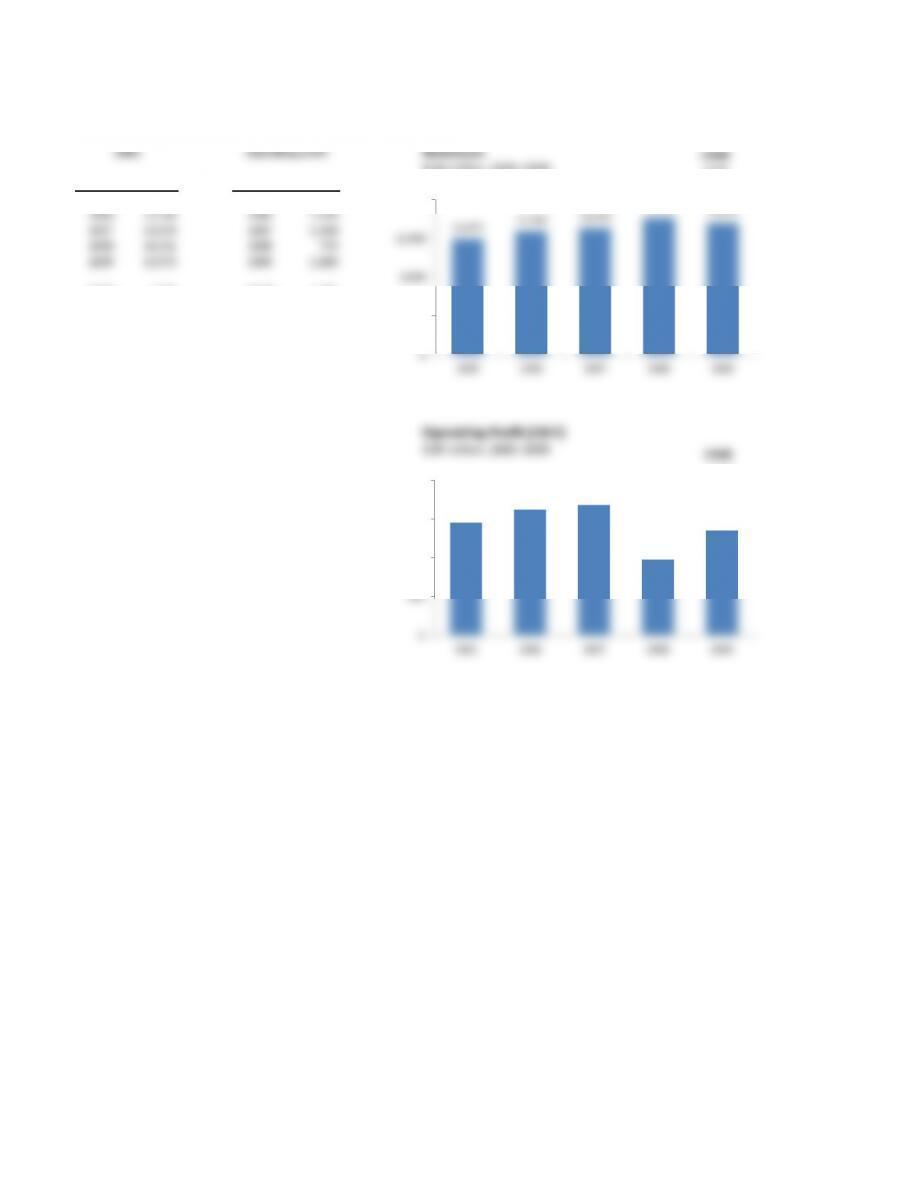
11,974 12,740 13,074 14,131 13,573
0
4,000
8,000
12,000
16,000
2005 2006 2007 2008 2009
Revenues
EUR million, 2005–2009
CAGR
3.2%
1,162
1,296 1,344
779
1,080
0
400
800
1,200
1,600
2005 2006 2007 2008 2009
Operating Profit (EBIT)
EUR million, 2005–2009
CAGR
–1.8%
Henkel Integrative Case
Who is Henkel?
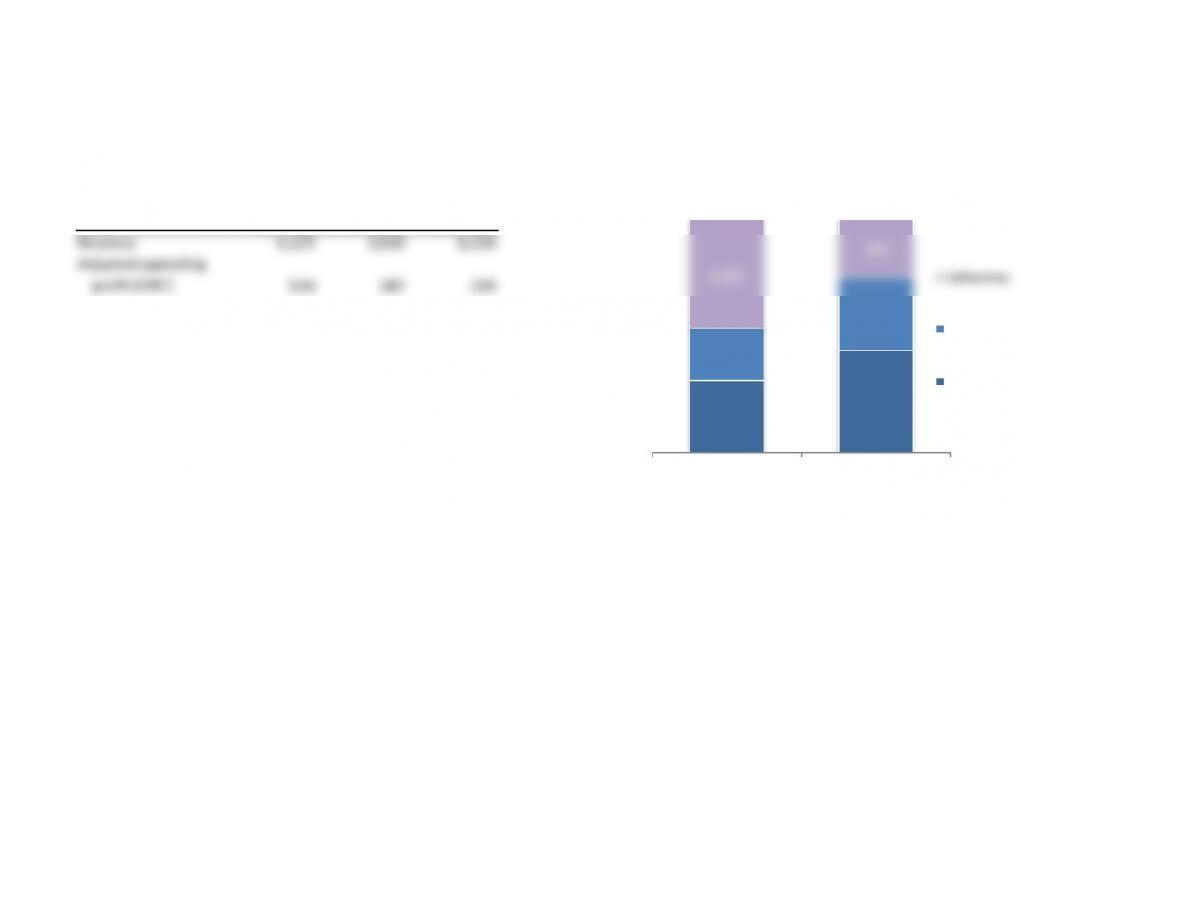
Performance by sector 2009
Metric Laundry Cosmetics Adhesives
Revenue 4,129 3,010 6,224
Adjusted operating
profit (EBIT)
530 387 290
4,129 530
3,010
387
6,224
290
Revenue Adjusted operating
profit (EBIT)
Financial Performance by Sector
2009
Adhesives
Cosmetics
Laundry

Henkel Integrative Case
Who is Henkel?
Year Revenues EBIT Margin Year Revenues EBIT Margin Year Revenues EBIT Margin
2005 4,088 433 10.6% 2005 2,629 321 12.2% 2005 5,008 530 10.6%
2006 4,117 449 10.9% 2006 2,864 359 12.5% 2006 5,510 579 10.5%
2007 4,148 459 11.1% 2007 2,972 372 12.5% 2007 5,711 621 10.9%
2008 4,172 439 10.5% 2008 3,016 376 12.5% 2008 6,700 658 9.8%
2009 4,129 501 12.1% 2009 3,010 387 12.9% 2009 6,224 290 4.7%
CAGR 0.2% 3.7% CAGR 3.4% 4.8% CAGR 5.6% –14.0%
Adhesives
Laundry
Cosmetics
4,088 4,117 4,148 4,172 4,129
0
1,500
3,000
4,500
2005 2006 2007 2008 2009
Laundry Revenues
EUR million, 2005–2009
CAGR
0.2%
CAGR
0.2%
2,629 2,864 2,972 3,016 3,010
0
1,000
2,000
3,000
4,000
2005 2006 2007 2008 2009
Cosmetics Revenues
EUR million, 2005–2009
CAGR
3.4%
5,008 5,510 5,711
6,700 6,224
0
2,000
4,000
6,000
8,000
2005 2006 2007 2008 2009
Adhesives Revenues
EUR million, 2005–2009
CAGR
5.6%
Henkel Integrative Case
Who is Henkel?
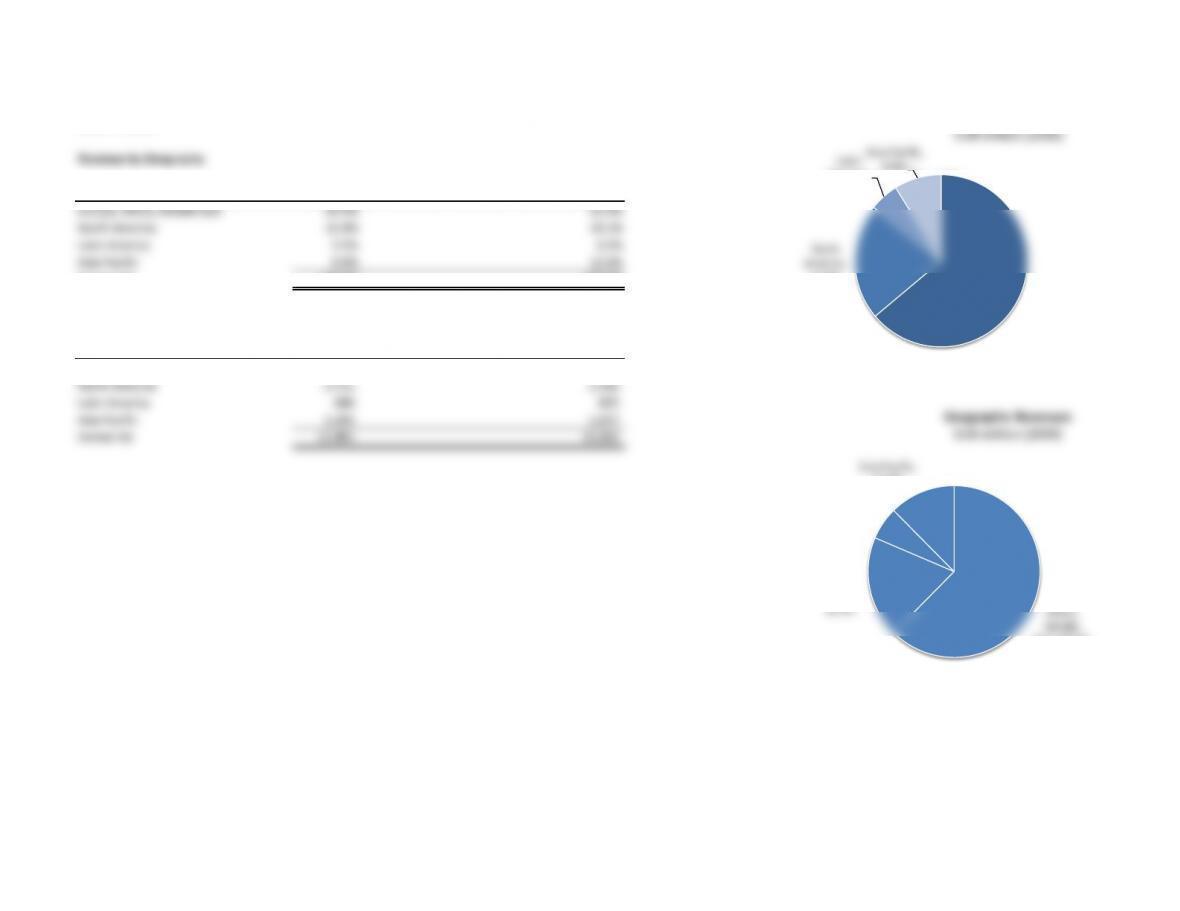
Revenue by Geography
Revenue split (percent) 2005 2006 2007 2008 2009
Europe, Africa, Middle East 63.9% 62.4%
North America 21.8% 19.1%
Latin America 5.5% 6.2%
Asia-Pacific 8.8% 12.4%
Henkel AG 100.0% 100.0%
Revenue split (EUR million) 2005 2006 2007 2008 2009
Europe, Africa, Middle East 7,979 8,335
North America 2,721 2,546
Latin America 686 825
Asia-Pacific 1,105 1,657
Henkel AG 12,491 13,363
Europe,
Africa,
Middle
East, 63.9%
North
America,
21.8%
Latin
America,
5.5%
Asia-Pacific,
8.8%
Geographic Revenues
EUR million (2005)
Europe,
Africa,
Middle
North
America,
19.1%
Latin
America,
6.2%
Asia-Pacific,
12.4%
Geographic Revenues
EUR million (2009)
Henkel Integrative Case
Who is Henkel?
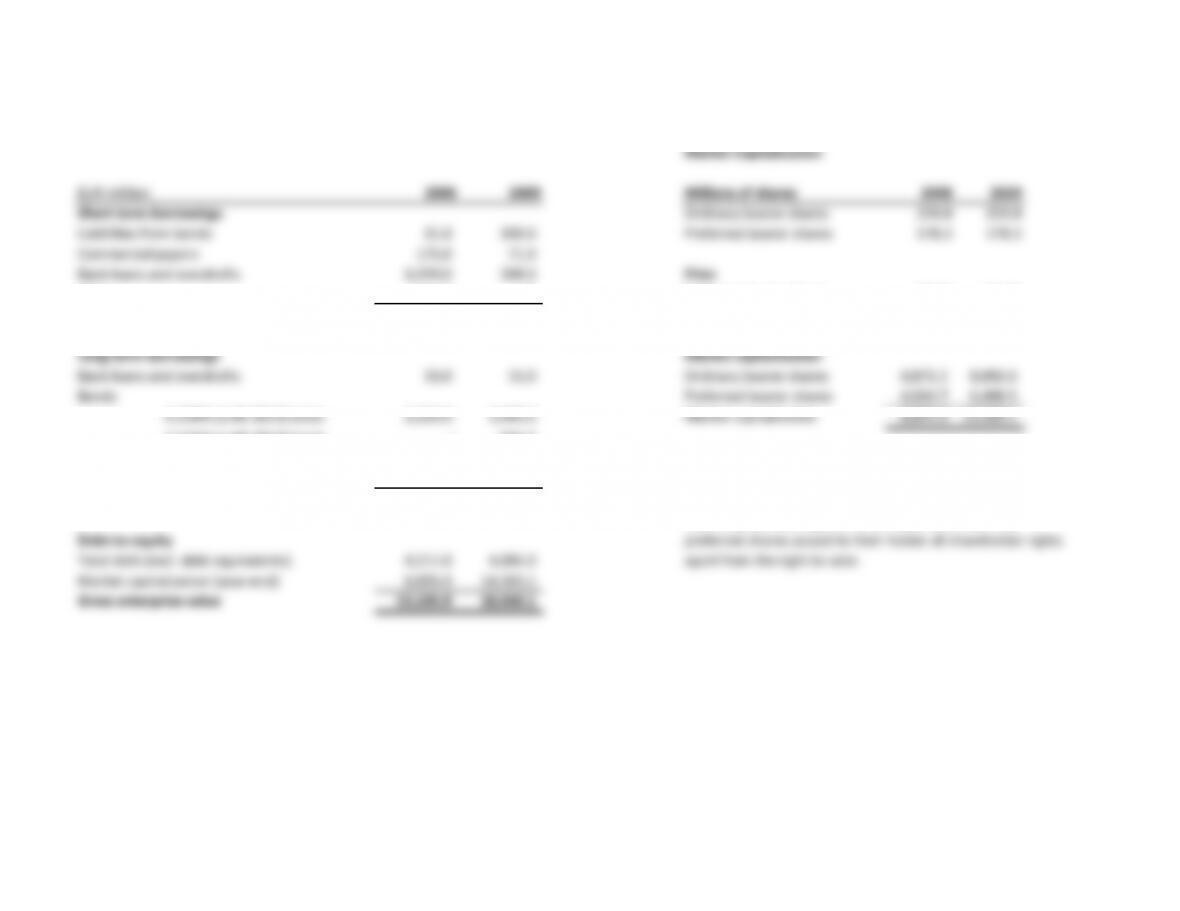
Market Capitalization
EUR million 2008 2009 Millions of shares 2008 2009
Short-term borrowings Ordinary bearer shares 259.8 259.8
Liabilities from bonds
31.0 300.0 Preferred bearer shares 178.2 178.2
Commercial papers 175.0 71.0
Bank loans and overdrafts 1,099.0 288.0 Price
Other 512.0 1.0 Ordinary bearer shares 18.75 31.15
Subtotal 1,817.0 660.0 Preferred bearer shares 22.59 36.43
Long-term borrowings Market capitalization
Bank loans and overdrafts 33.0 15.0 Ordinary bearer shares 4,871.2 8,092.6
Bonds Preferred bearer shares 4,024.7 6,490.5
4.250%
(until 2013)
bond 1,024.0 1,045.0 Market capitalization 8,895.9 14,583.1
4.625%
(until 2014)
bond –994.0
(Hybrid) 5.375%
(until 2015)
bond 1,331.0 1,368.0 Source: Henkel 2009 Annual Report, pages 16 and 17.
Other 6.0 3.0
Subtotal 2,394.0 3,425.0 Note:
Each ordinary share grants to its holder one vote. The
Debt-to-equity preferred shares accord to their holder all shareholder rights
Total debt (excl. debt equivalents) 4,211.0 4,085.0 apart from the right to vote.
Market capitalization (year-end) 8,895.9 14,583.1
Gross enterprise value 13,106.9 18,668.1
Note:
Increase in current liabilities from bonds is because of the issuance of a floating-rate note, 2009.