Henkel AG Henkel AG
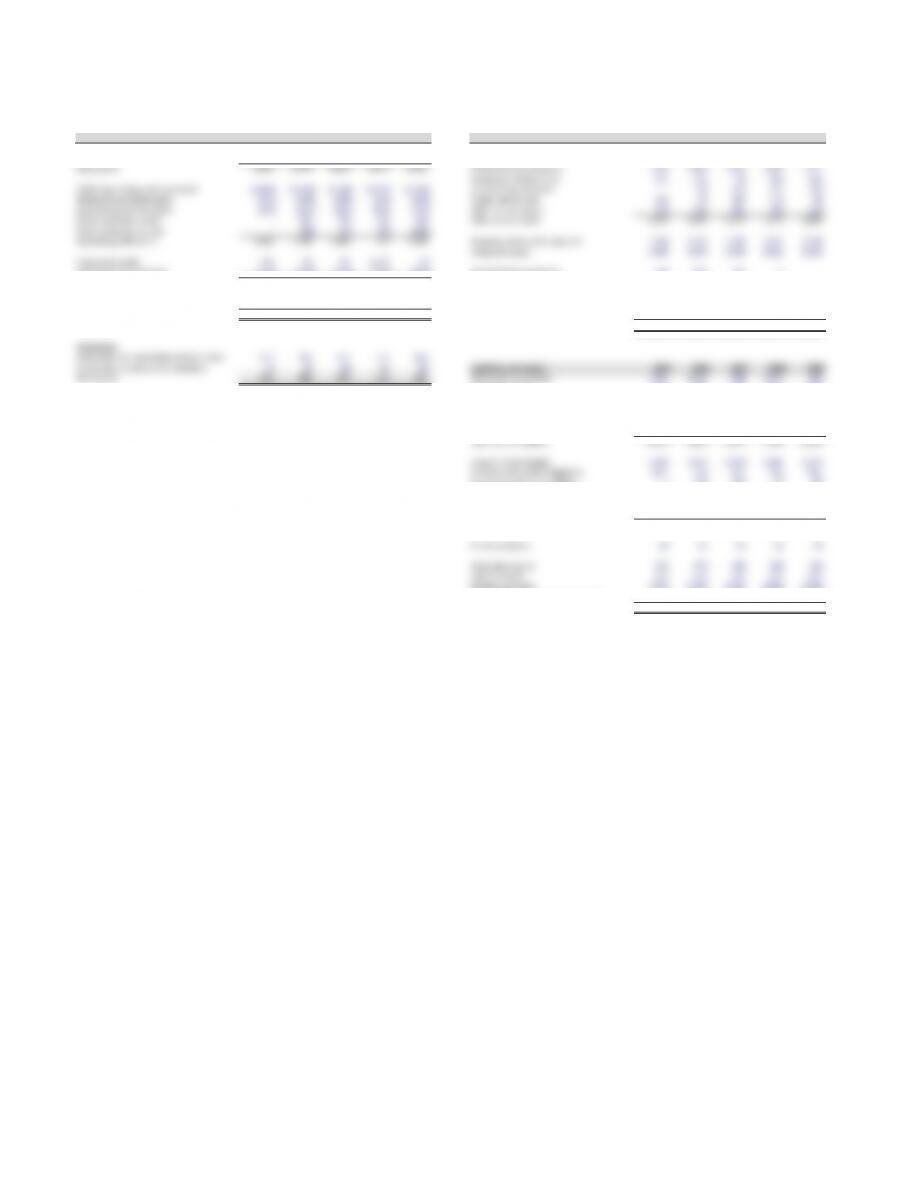
Income statement Balance sheet
EUR million 2005 2006 2007 2008 2009 Assets 2005 2006 2007 2008 2009
Net revenues 11,974 12,740 13,074 14,131 13,573 Liquid funds/marketable securities 1,212 929 1,440 338 1,110
Cost of sales (6,533) (6,963) (7,013) (8,190) (7,411) Inventories 1,232 1,325 1,283 1,482 1,218
Gross profit 5,441 5,777 6,061 5,941 6,162 Trade accounts receivable 1,794 1,868 1,694 1,847 1,721
Income tax refund claims 121 110 90 202 139
Marketing, selling, and distribution (3,409) (3,650) (3,748) (3,993) (3,926) Current financial assets –124 170 575 214
Research and development (324) (340) (350) (429) (396) Assets held for sale 142 14 125 113 30
General and administrative (627) (697) (664) (825) (735) Other current assets 378 312 315 256 224
Other operating income –266 109 160 140 Total current assets 4,879 4,682 5,117 4,813 4,656
Other operating charges –(58) (64) (75) (165)
Operating profit (EBIT) 1,081 1,298 1,344 779 1,080 Property, plant, and equipment 1,364 1,516 1,749 2,337 2,248
Intangible assets 5,660 5,487 4,940 8,392 8,218
Investment result 171 54 84 1,123 (4)
Interest (expense) income (210) (176) (178) (275) (191) Investments in associates 530 496 295 1–
Earnings before income taxes 1,042 1,176 1,250 1,627 885 Other investments 151 66 33 23 –
Long-term financial assets 681 632 598 199 360
Income tax benefit (provision) (272) (305) (309) (394) (257) Deferred income taxes 456 363 249 305 322
Net income 770 871 941 1,233 628 Other noncurrent assets 223 104 67 414
Total assets 13,944 13,346 13,048 16,074 15,818
Attribution
Attributable to shareholders of Henkel AG 612 833 877 122 658
Attributable to minority shareholders 13 16 20 12 26 Liabilities and equity 2005 2006 2007 2008 2009
Net income 625 849 897 134 684 Short-term borrowings 1,405 1,012 838 1,817 660
Accounts payable 1,333 1,494 1,477 1,678 1,885
Income tax provisions and liabilities –135 167 354 234
Source: Henkel 2009 Annual Report, page 80. Current financial liabilities –93 246 272 145
Other short-term provisions 932 884 763 866 938
Other current liabilities 455 224 200 306 251
Total current liabilities 4,125 3,842 3,691 5,293 4,113
Long-term borrowings 2,400 2,322 2,304 2,402 3,426
Pensions and similar obligations 1,061 788 657 833 867
Noncurrent financial liabilities –118 147 77 88
Deferred taxes and tax provisions 900 595 414 589 519
Other long-term provisions –126 119 336 241
Other noncurrent liabilities 59 810 920
Total liabilities 8,545 7,799 7,342 9,539 9,274
Minority interest 28 60 63 51 70
Subscribed capital 374 374 438 438 438
Capital reserve 652 652 652 652 652
Retained earnings 4,764 5,362 5,963 6,805 6,908
Gains and losses recognized in equity (419) (901) (1,410) (1,411) (1,524)
Total liabilities and equity 13,944 13,346 13,048 16,074 15,818
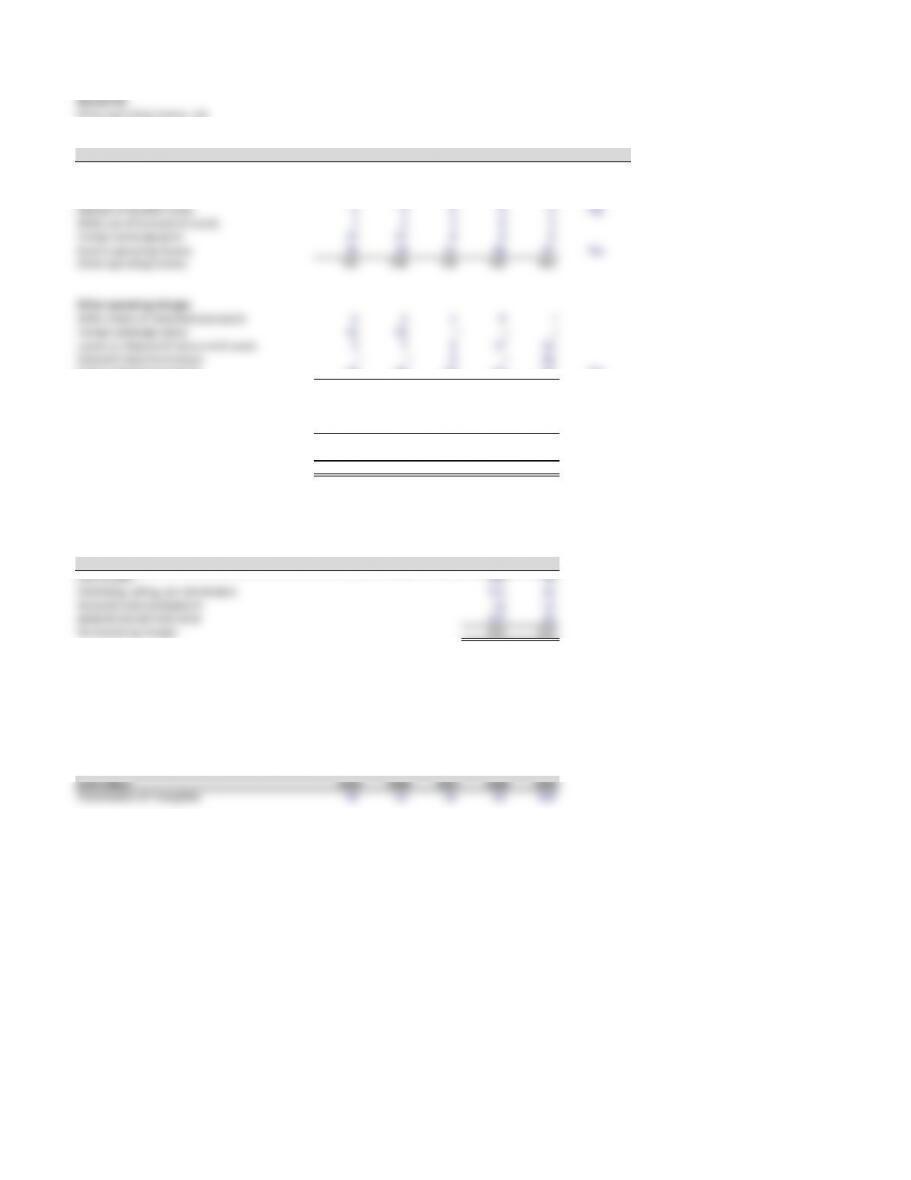
Henkel AG
Other operating income, net
Other operating income 2005 2006 2007 2008 2009 Operating
Gains on disposal of noncurrent assets 944 14 14 10
Profits on sale of businesses –57 –8–
Release of provisions 31 101 35 44 38 Yes
Release of doubtful debts 4 4 6 6 2 Yes
Write-ups of noncurrent assets 71303
Foreign exchange gains 37 32 0 0 0
Sundry operating income 95 59 51 88 87 Yes
Other operating income 183 298 109 160 140
Other operating charges
Write-downs of miscellaneous assets 6 2 5 4 –
Foreign exchange losses 31 35 – – –
Losses on disposal of noncurrent assets 37617 22
Goodwill impairment losses – – 9–46
Sundry operating expenses 38 46 44 54 97 Yes
Other operating charges 78 90 64 75 165
Other operating income, net 2005 2006 2007 2008 2009
Other operating income 130 164 92 138 127
Other operaitng expenses (38) (46) (44) (54) (97)
Other operating income, net 92 118 48 84 30
Henkel AG
Restructuring charges
EUR million 2005 2006 2007 2008 2009
Cost of sales 373 70
Marketing, selling, and distribution 111 52
Research and development 52 13
General and administrative 127 24
Restructuring charges 663 159
Restructuring charges in 2009: 159 million euros (2008: 663 million euros), of which 70 million euros (2008: 373 million euros) cost of sales; 52 million euros
(2008: 111 million euros) marketing, selling, and distribution expenses; 13 million euros (2008: 52 million euros) research and development expenses;
24 million euros (2008: 127 million euros) administrative expenses.
Henkel AG
Amortization of intangibles
EUR million 2005 2006 2007 2008 2009
Amortization of intangibles 49 53 56 95 108
Source: Henkel 2009 Annual Report, page 86.
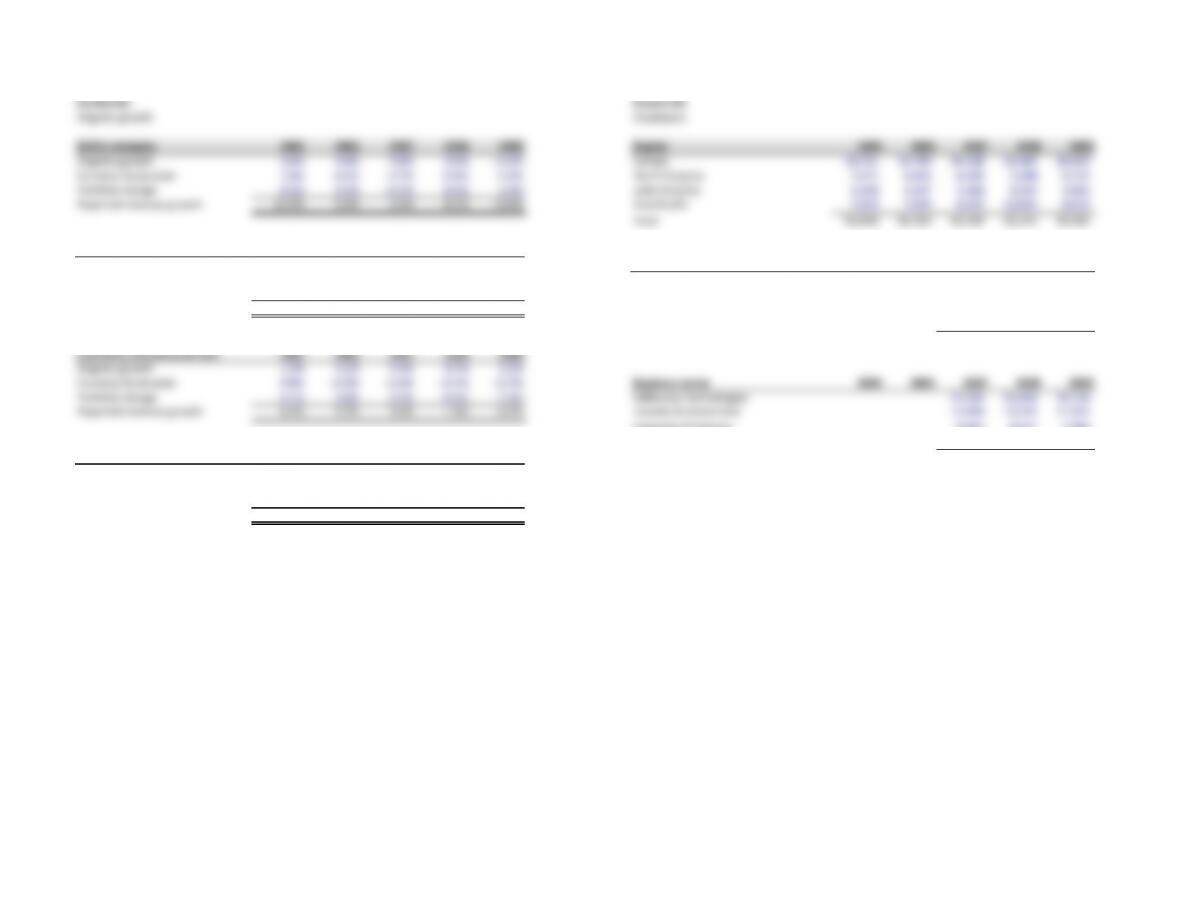
Henkel AG Henkel AG
Organic growth Employees
Entire company 2005 2006 2007 2008 2009 Region 2005 2006 2007 2008 2009
Organic growth 3.0% 4.6% 5.8% 3.0% –3.5% Europe 33,731 33,799 34,168 33,485 30,933
Currency fluctuation 1.0% –0.1% –2.7% –3.5% –2.4% North America 7,271 6,651 6,438 7,360 5,714
Portfolio change 8.5% 0.5% –0.5% 8.6% 2.0% Latin America 4,208 4,297 4,268 4,293 4,002
Reported revenue growth 12.5% 5.0% 2.6% 8.1% –3.9% Asia-Pacific 7,355 7,545 8,235 10,004 8,613
Total 52,565 52,292 53,109 55,142 49,262
Laundry and home care 2005 2006 2007 2008 2009
Organic growth 3.0% 4.6% 5.5% 3.8% 2.9% Function 2005 2006 2007 2008 2009
Currency fluctuation 0.8% –0.3% –2.3% –2.4% –3.9% Production and Engineering 24,961 25,917 24,138
Portfolio change 9.2% –3.9% –2.4% –0.8% 0.0% Research and Development 2,655 2,757 2,463
Reported revenue growth 13.0% 0.4% 0.8% 0.6% –1.0% Administration 8,497 9,374 6,897
Marketing, selling, and distribution 16,995 17,094 15,764
53,109 55,142 49,262
Cosmetics and personal care 2005 2006 2007 2008 2009
Organic growth 1.3% 4.1% 5.9% 4.7% 3.5%
Currency fluctuation 0.8% –0.2% –2.4% –2.7% –2.7% Business sector 2005 2006 2007 2008 2009
Portfolio change 4.1% 5.8% 0.3% –0.5% –1.0% Adhesives Technologies 23,368 26,468 24,138
Reported revenue growth 6.2% 9.7% 3.8% 1.5% –0.2% Laundry & Home Care 13,808 13,234 11,331
Cosmetics/Toiletries 8,497 8,271 7,389
Corporate 7,435 7,168 6,404
Adhesives technologies 2005 2006 2007 2008 2009 53,109 55,142 49,262
Organic growth 5.4% 8.5% 6.5% 1.3% –10.2% Source: Henkel 2009 Annual Report, page x.
Currency fluctuation 1.5% 0.0% –3.3% –4.8% –1.4%
Portfolio change 11.4% 1.3% 0.4% 20.8% 4.5%
Reported revenue growth 18.3% 9.9% 3.6% 17.3% –7.1%
Source: Lehman Brothers estimates, UBS estimates, JPMorgan estimates, and company reports.
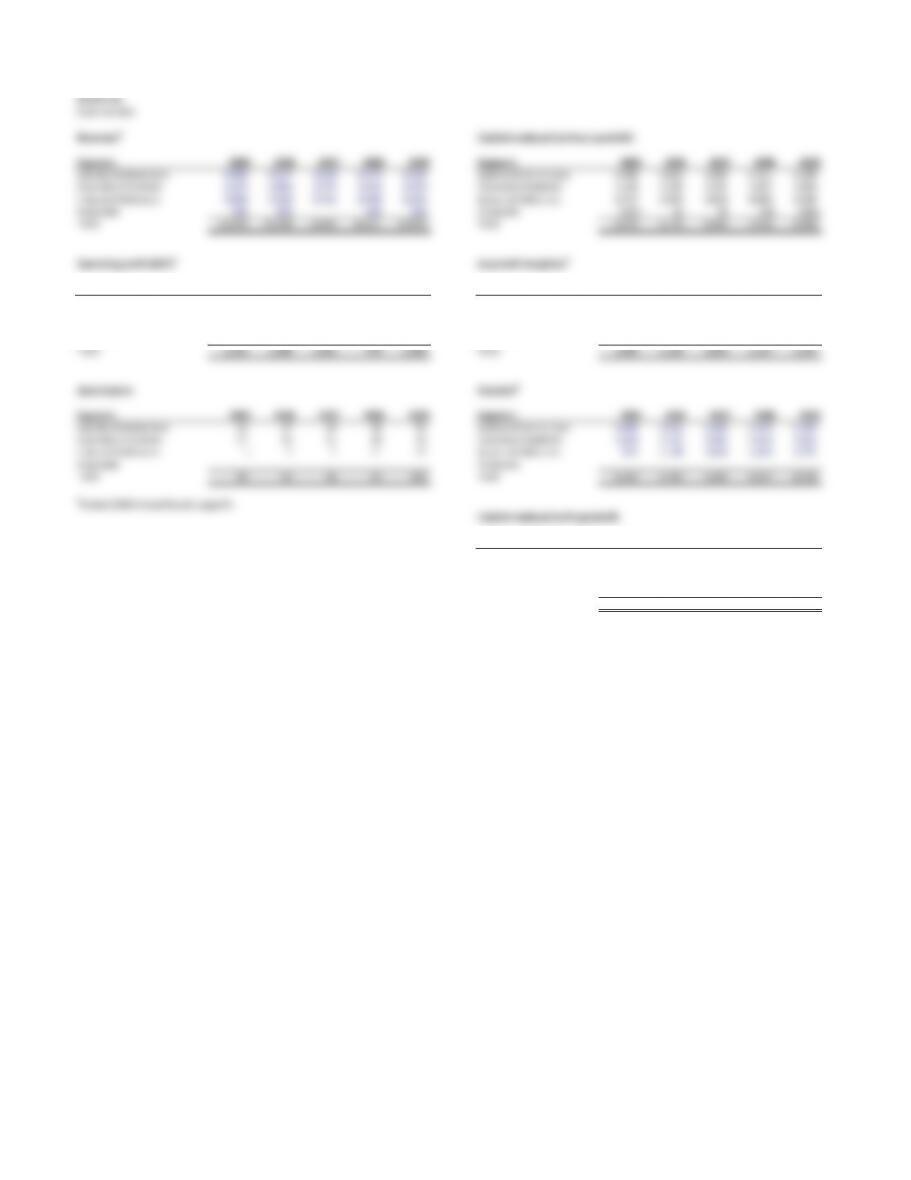
Henkel AG
Segment data
Revenues1Capital employed (without goodwill)
Segment 2005 2006 2007 2008 2009 Segment 2005 2006 2007 2008 2009
Laundry & Home Care 4,088 4,117 4,148 4,172 4,129 Laundry & Home Care 1,496 1,423 1,402 1,211 1,198
Cosmetics/Toiletries 2,629 2,864 2,972 3,016 3,010 Cosmetics/Toiletries 1,126 1,226 1,234 1,097 1,094
Industrial Adhesives 5,008 5,510 5,711 6,700 6,224 Industrial Adhesives 2,717 2,500 2,640 4,930 3,283
Corporate 249 249 –243 210 Corporate (167) 24 76 (24) (181)
Total 11,974 12,740 12,831 14,131 13,573 Total 5,172 5,173 5,352 7,214 5,394
Operating profit (EBIT)1Acquired intangibles2
Segment 2005 2006 2007 2008 2009 Segment 2005 2006 2007 2008 2009
Laundry & Home Care 433 449 459 439 501 Laundry & Home Care 684 589 548 578 560
Cosmetics/Toiletries 321 359 372 376 387 Cosmetics/Toiletries 361 526 458 479 463
Industrial Adhesives 530 579 621 658 290 Industrial Adhesives 451 47 140 124
Corporate (122) (89) –(694) (98) Corporate –––––
Total 1,162 1,298 1,452 779 1,080 Total 1,049 1,166 1,053 1,197 1,147
Amortization
Goodwill2
Segment 2005 2006 2007 2008 2009 Segment 2005 2006 2007 2008 2009
Laundry & Home Care 32 27 29 46 53 Laundry & Home Care 1,688 1,532 1,350 1,393 1,364
Cosmetics/Toiletries 17 24 24 38 44 Cosmetics/Toiletries 1,058 1,102 1,002 1,054 1,031
Industrial Adhesives –2 2 11 12 Industrial Adhesives 819 1,148 1,040 1,660 3,752
Corporate ––––– Corporate –––––
Total 49 53 56 95 108 Total 3,565 3,782 3,392 4,107 8,218
1Henkel 2009 Annual Report, page 84.
Capital employed (with goodwill)
Segment 2005 2006 2007 2008 2009
Laundry & Home Care 3,184 2,955 2,752 2,604 2,562
Cosmetics/Toiletries 2,184 2,328 2,236 2,151 2,125
Industrial Adhesives 3,536 3,648 3,680 6,590 7,035
Corporate (167) 24 76 (24) (181)
Total 8,737 8,955 8,744 11,321 11,541
2Henkel 2009 Annual Report, note 11.