Henkel AG
FInancial Statements
Henkel AG Henkel AG
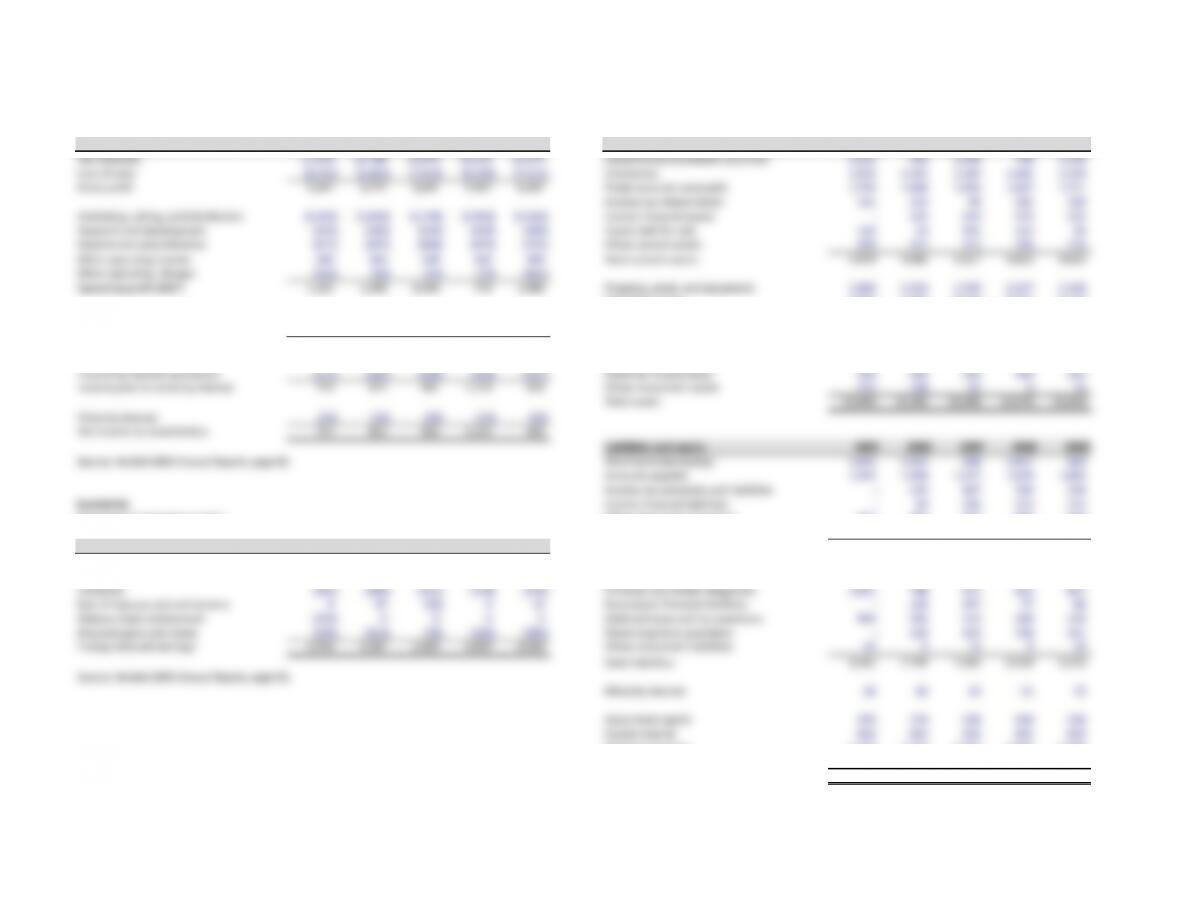
Income statement Balance sheet
EUR million 2005 2006 2007 2008 2009 Assets 2005 2006 2007 2008 2009
Net revenues 11,974 12,740 13,074 14,131 13,573 Liquid funds/marketable securities 1,212 929 1,440 338 1,110
Cost of sales (6,533) (6,963) (7,013) (8,190) (7,411) Inventories 1,232 1,325 1,283 1,482 1,218
Gross profit 5,441 5,777 6,061 5,941 6,162 Trade accounts receivable 1,794 1,868 1,694 1,847 1,721
Income tax refund claims 121 110 90 202 139
Marketing, selling, and distribution (3,409) (3,650) (3,748) (3,993) (3,926) Current financial assets –124 170 575 214
Research and development (324) (340) (350) (429) (396) Assets held for sale 142 14 125 113 30
General and administrative (627) (697) (664) (825) (735) Other current assets 378 312 315 256 224
Other operating income 183 266 109 160 140 Total current assets 4,879 4,682 5,117 4,813 4,656
Other operating charges (102) (58) (64) (75) (165)
Operating profit (EBIT) 1,162 1,298 1,344 779 1,080 Property, plant, and equipment 1,364 1,516 1,749 2,337 2,248
Intangible assets 5,660 5,487 4,940 8,392 8,218
Investment result 90 54 84 1,123 (4)
Interest (expense) income (210) (176) (178) (275) (191) Investments in associates 530 496 295 1–
Earnings before income taxes 1,042 1,176 1,250 1,627 885 Other investments 151 66 33 23 –
Long-term financial assets 681 632 598 199 360
Income tax benefit (provision) (272) (305) (309) (394) (257) Deferred income taxes 456 363 249 305 322
Income prior to minority interest 770 871 941 1,233 628 Other noncurrent assets 223 104 67 414
Total assets 13,944 13,346 13,048 16,074 15,818
Minority interest (13) (16) (20) (12) (26)
Net income to shareholders 757 855 921 1,221 602
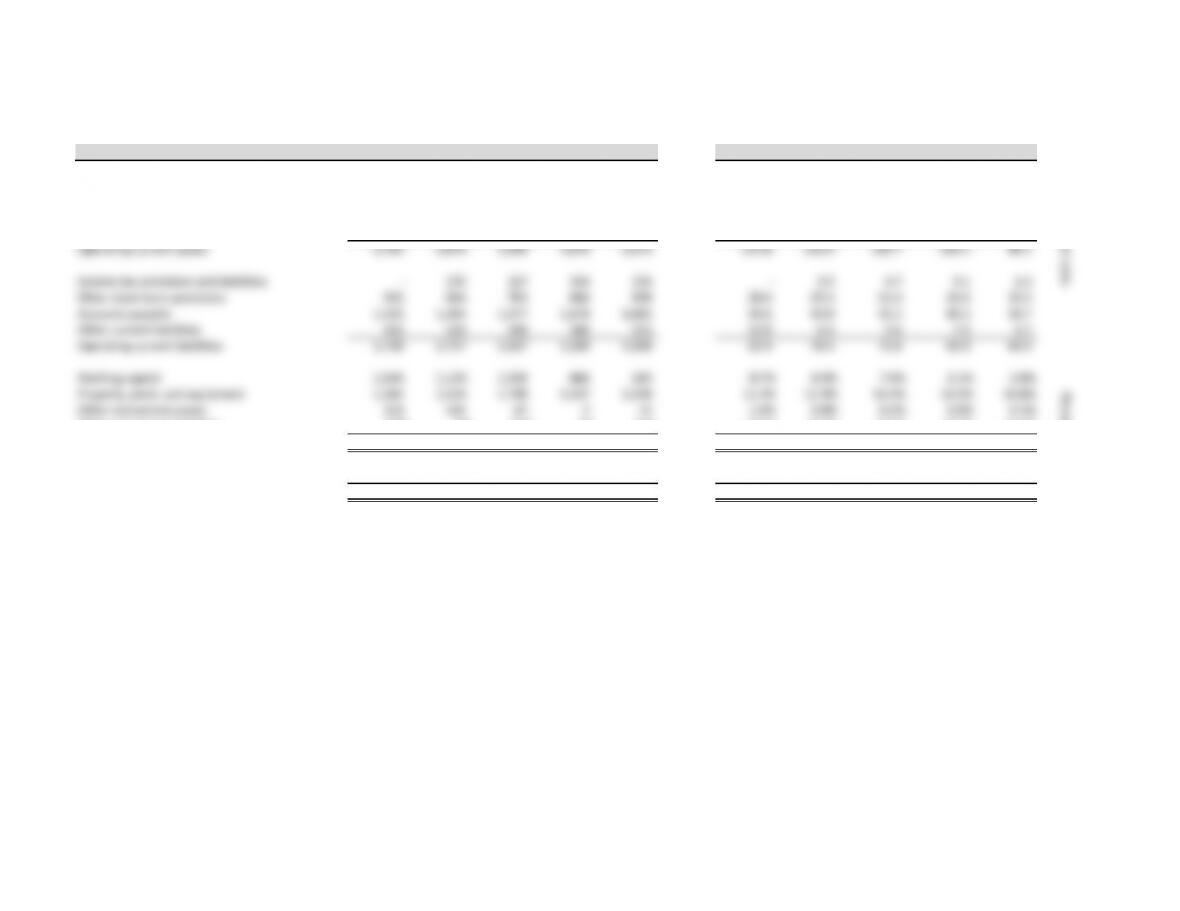
Liabilities and equity 2005 2006 2007 2008 2009
Source: Henkel 2009 Annual Report, page 80. Short-term borrowings 1,405 1,012 838 1,817 660
Accounts payable 1,333 1,494 1,477 1,678 1,885
Income tax provisions and liabilities –135 167 354 234
Henkel AG Current financial liabilities –93 246 272 145
Statement of retained earnings Other short-term provisions 932 884 763 866 938
Other current liabilities 455 224 200 306 251
EUR million 2005 2006 2007 2008 2009 Total current liabilities 4,125 3,842 3,691 5,293 4,113
Starting retained earnings 4,544 4,764 5,362 5,963 6,805
Net income 757 855 921 1,221 602 Long-term borrowings 2,400 2,322 2,304 2,402 3,426
Dividends (181) (190) (211) (224) (224) Pensions and similar obligations 1,061 788 657 833 867
Sale of treasury and retirements 847 (50) 5 10 Noncurrent financial liabilities –118 147 77 88
Balance sheet restatement (258) 0 0 0 0 Deferred taxes and tax provisions 900 595 414 589 519
Actuarial gains and losses (106) (114) (59) (160) (285) Other long-term provisions –126 119 336 241
Ending retained earnings 4,764 5,362 5,963 6,805 6,908 Other noncurrent liabilities 59 810 920
Total liabilities 8,545 7,799 7,342 9,539 9,274
Source: Henkel 2009 Annual Report, page 83.
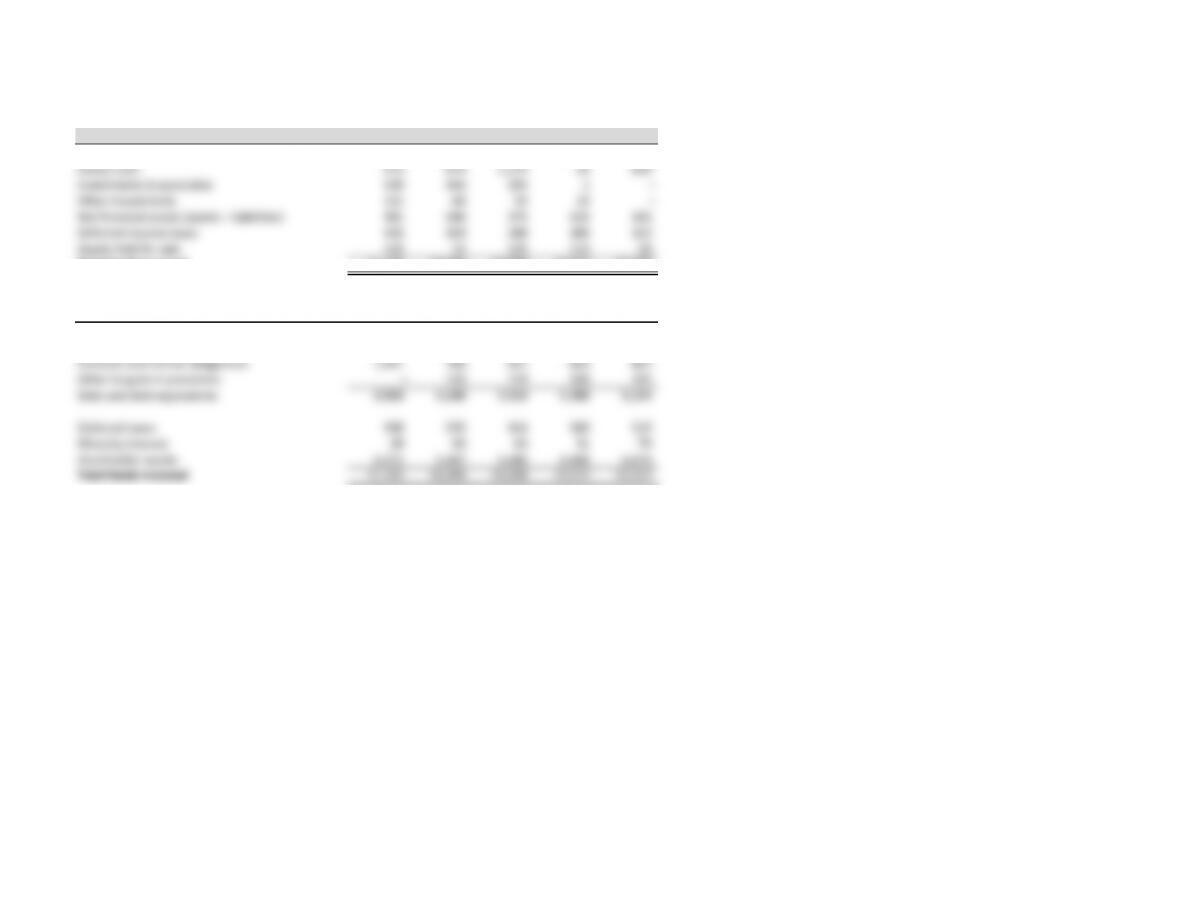
Minority interest 28 60 63 51 70
Subscribed capital 374 374 438 438 438
Capital reserve 652 652 652 652 652
Retained earnings 4,764 5,362 5,963 6,805 6,908
Gains and losses recognized in equity (419) (901) (1,410) (1,411) (1,524)
Total liabilities and equity 13,944 13,346 13,048 16,074 15,818
Source: Henkel 2009 Annual Report, page 81.
Henkel AG
Supplemental Financial Statements
Henkel AG Henkel AG
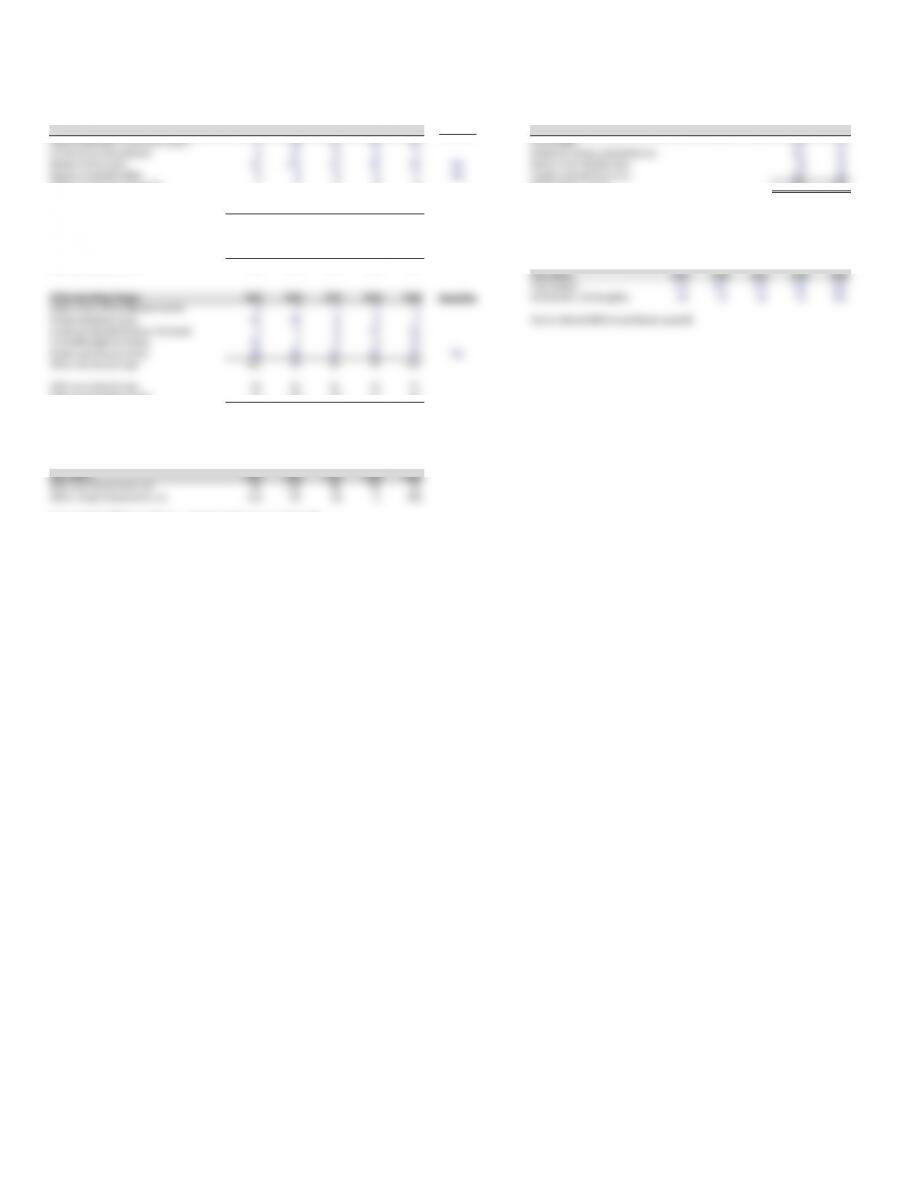
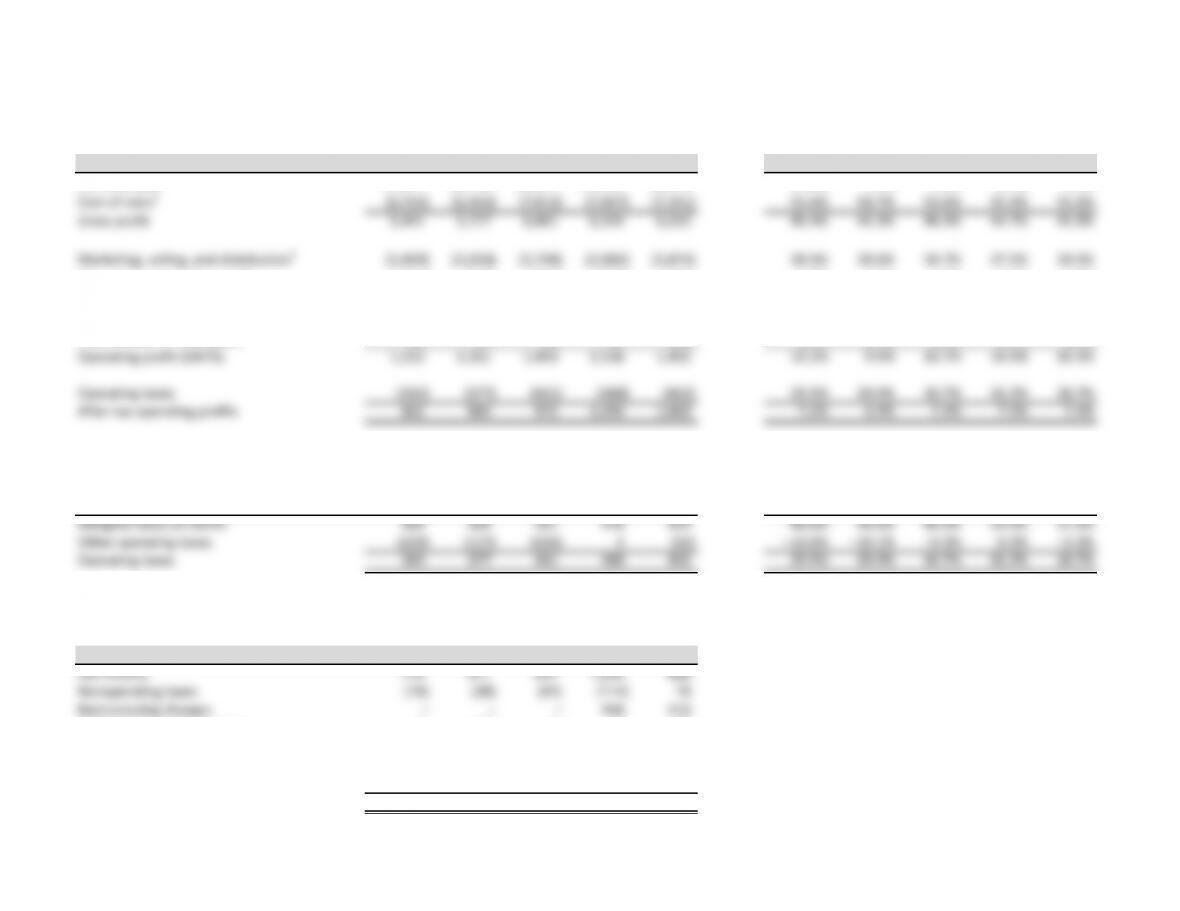
Other operating income, net Restructuring charges
Other operating income 2005 2006 2007 2008 2009 Operating EUR million 2005 2006 2007 2008 2009
Gains on disposal of noncurrent assets 944 14 14 10 Cost of sales 373 70
Profits on sale of businesses 057 080 Marketing, selling, and distribution 111 52
Release of provisions 31 101 35 44 38 Yes Research and development 52 13
Release of doubtful debts 4 4 6 6 2 Yes General and administrative 127 24
Write-ups of noncurrent assets 71303 Restructuring charges 663 159
Foreign exchange gains 37 32 000
Sundry operating income 95 59 51 88 87 Yes Source: Henkel 2009 Annual Report, page 80.
Other operating income 183 298 109 160 140
Other operating income 130 164 92 138 127 Henkel AG
Other nonoperating income 53 134 17 22 13 Depreciation and amortization
Other operating income 183 298 109 160 140
EUR million 2005 2006 2007 2008 2009
Depreciation 279 282 279 298 308
Other operating charges 2005 2006 2007 2008 2009 Operating Amortization of intangibles 49 53 56 95 108
Write-downs of miscellaneous assets 62540
Foreign exchange losses 31 35 000 Source: Henkel 2009 Annual Report, page 86.
Losses on disposal of noncurrent assets 3 7 6 17 22
Goodwill impairment losses 24 09046
Sundry operating expenses 38 46 44 54 97 Yes
Other operating charges 102 90 64 75 165
Other operating charges 38 46 44 54 97
Other nonoperating charges 64 44 20 21 68
Other operating charges 102 90 64 75 165
Henkel AG
Other operating income (charges), split into operating and nonoperating, net
EUR million 2005 2006 2007 2008 2009
Other operating income, net 92 118 48 84 30
Other nonoperating income, net (11) 90 (3) 1 (55)
Source: Henkel 2009 Annual Report, note 6 (page 91) and note 7 (page 92).
Note:
Since classification of an item as ongoing and related to core operations is (somewhat) subjective, make sure
to create a spreadsheet that provides for flexibility in treatment.
Henkel AG
Supplemental Financial Data
Henkel AG Henkel AG
Organic growth Employees
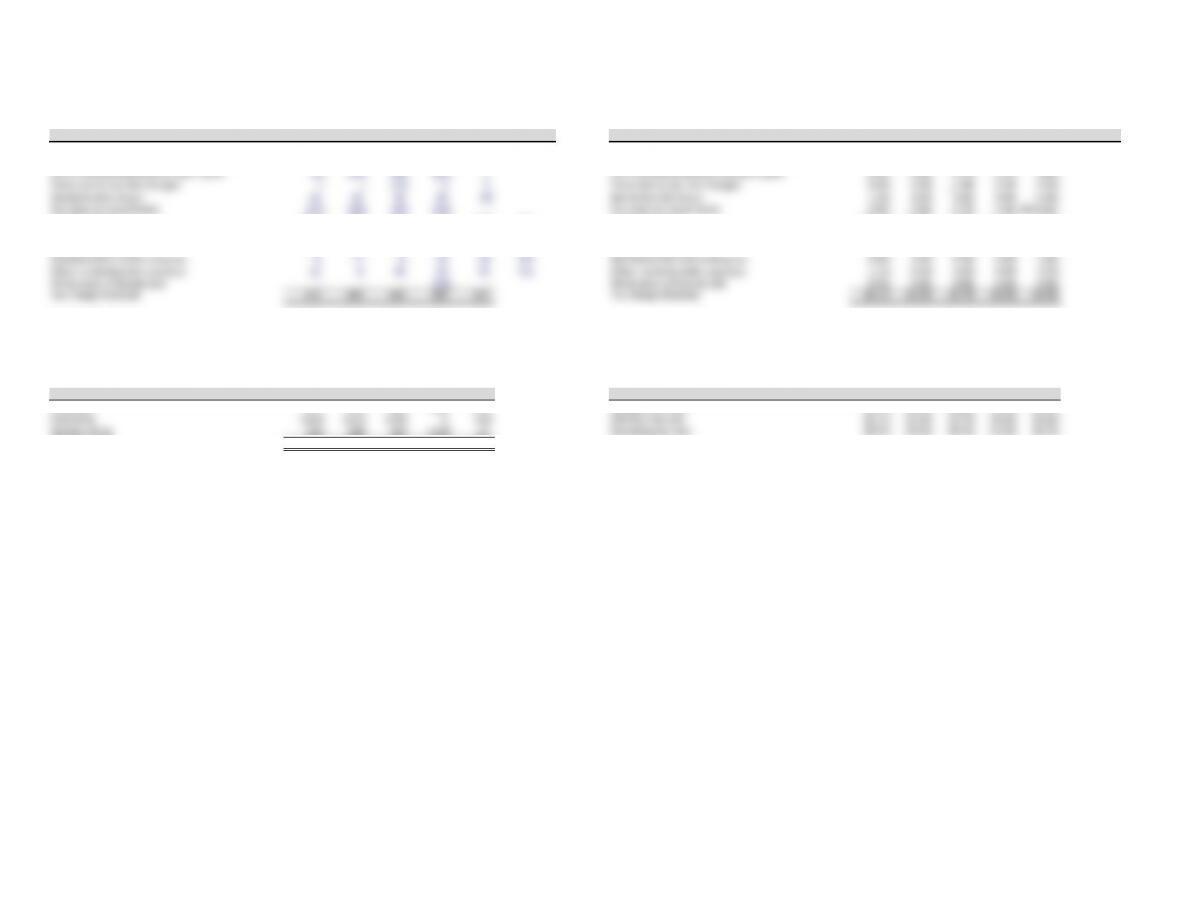
Entire Company 2005 2006 2007 2008 2009 Region 2005 2006 2007 2008 2009
Organic growth 3.0% 4.6% 5.8% 3.0% –3.5% Europe 33,731 33,799 34,168 33,485 30,933
Currency fluctuation 1.0% –0.1% –2.7% –3.5% –2.4% North America 7,271 6,651 6,438 7,360 5,714
Portfolio change 8.5% 0.5% –0.5% 8.6% 2.0% Latin America 4,208 4,297 4,268 4,293 4,002
Reported revenue growth 12.5% 5.0% 2.6% 8.1% 3.9% Asia-Pacific 7,355 7,545 8,235 10,004 8,613
Total 52,565 52,292 53,109 55,142 49,262
Laundry and Home Care 2005 2006 2007 2008 2009
Organic growth 3.0% 4.6% 5.5% 3.8% 2.9% Function 2005 2006 2007 2008 2009
Currency fluctuation 0.8% –0.3% –2.3% –2.4% –3.9% Production and engineering 24,961 25,917 24,138
Portfolio change 9.2% –3.9% –2.4% –0.8% 0.0% Research and development 2,655 2,757 2,463
Reported revenue growth 13.0% 0.4% 0.8% 0.6% –1.0% Administration 8,497 9,374 6,897
Marketing,selling, and distribution 16,995 17,094 15,764
53,109 55,142 49,262
Cosmetics and Personal Care 2005 2006 2007 2008 2009
Organic growth 1.3% 4.1% 5.9% 4.7% 3.5%
Currency fluctuation 0.8% –0.2% –2.4% –2.7% –2.7% Business sector 2005 2006 2007 2008 2009
Portfolio change 4.1% 5.8% 0.3% –0.5% –1.0% Adhesives Technologies 23,368 26,468 24,138
Reported revenue growth 6.2% 9.7% 3.8% 1.5% –0.2% Laundry & Home Care 13,808 13,234 11,331
Cosmetics/Toiletries 8,497 8,271 7,389
Corporate 7,435 7,168 6,404
Adhesive Technologies 2005 2006 2007 2008 2009 53,109 55,142 49,262
Organic growth 5.4% 8.5% 6.5% 1.3% –10.2% Source: Henkel 2009 Annual Report, page 49.
Currency fluctuation 1.5% 0.0% –3.3% –4.8% –1.4%
Portfolio change 11.4% 1.3% 0.4% 20.8% 4.5%
Reported revenue growth 18.3% 9.9% 3.6% 17.3% –7.1%
Source: Lehman Brothers estimates, UBS estimates, JPMorgan estimates, and company reports.
Henkel AG
Segment Financial Statements
Henkel AG
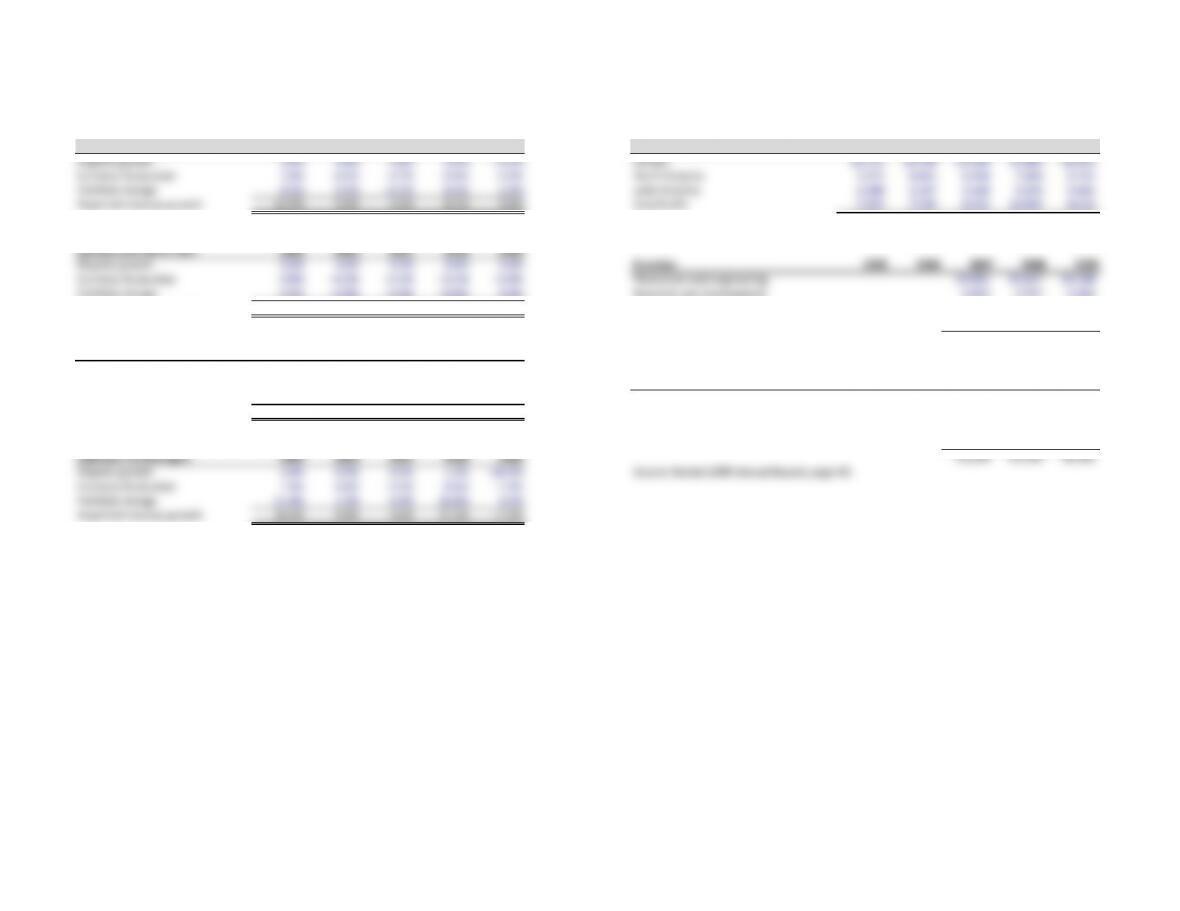
Segment data
Revenues1Capital employed (without goodwill)
Segment 2005 2006 2007 2008 2009 Segment 2005 2006 2007 2008 2009
Laundry & Home Care 4,088 4,117 4,148 4,172 4,129 Laundry & Home Care 1,496 1,423 1,402 1,211 1,198
Cosmetics/Toiletries 2,629 2,864 2,972 3,016 3,010 Cosmetics/Toiletries 1,126 1,226 1,234 1,097 1,094
Adhesives 5,008 5,510 5,711 6,700 6,224 Adhesives 2,717 2,500 2,640 4,930 3,283
Corporate 249 249 –243 210 Corporate (167) 24 76 (24) (181)
Total 11,974 12,740 12,831 14,131 13,573 Total 5,172 5,173 5,352 7,214 5,394
Operating profit (EBIT)1Acquired intangibles2
Segment 2005 2006 2007 2008 2009 Segment 2005 2006 2007 2008 2009
Laundry & Home Care 433 449 459 439 501 Laundry & Home Care 684 589 548 578 560
Cosmetics/Toiletries 321 359 372 376 387 Cosmetics/Toiletries 361 526 458 479 463
Adhesives 530 579 621 658 290 Adhesives 451 47 140 124
Corporate (122) (89) –(694) (98) Corporate –––––
Total 1,162 1,298 1,452 779 1,080 Total 1,049 1,166 1,053 1,197 1,147
Amortization (estimated)
Goodwill2
Segment 2005 2006 2007 2008 2009 Segment 2005 2006 2007 2008 2009
Laundry & Home Care 32 27 29 46 53 Laundry & Home Care 1,688 1,532 1,350 1,393 1,364
Cosmetics/Toiletries 17 24 24 38 44 Cosmetics/Toiletries 1,058 1,102 1,002 1,054 1,031
Adhesives –2 2 11 12 Adhesives 819 1,148 1,040 1,660 3,752
Corporate ––––– Corporate –––––
Total 49 53 56 95 108 Total 3,565 3,782 3,392 4,107 8,218
1Henkel 2009 Annual Report, page 84.
Capital employed (with goodwill)
Segment 2005 2006 2007 2008 2009
Laundry & Home Care 3,184 2,955 2,752 2,604 2,562
Cosmetics/Toiletries 2,184 2,328 2,236 2,151 2,125
Adhesives 3,536 3,648 3,680 6,590 7,035
Corporate (167) 24 76 (24) (181)
Total 8,737 8,955 8,744 11,321 11,541

Henkel AG
Segment Financial Statements
2Henkel 2009 Annual Report, Note 11.
Henkel AG
Segment Ratios
Henkel AG
Segment analysis
Return on invested capital Capital turns (without goodwill)
Segment 2005 2006 2007 2008 2009 Segment 2005 2006 2007 2008 2009
Laundry & Home Care 21.9% 23.4% 24.1% 27.5% 33.0% Laundry & Home Care 2.73 2.89 2.96 3.45 3.45
Cosmetics/Toiletries 21.2% 21.9% 22.2% 26.0% 28.1% Cosmetics/Toiletries 2.33 2.34 2.41 2.75 2.75
Adhesives #VALUE! 16.3% 16.4% 9.3% 6.6% Adhesives 1.84 2.20 2.16 1.36 1.90
Return on invested capital Capital turns (excluding goodwill)
Segment 2005 2006 2007 2008 2009 Segment 2005 2006 2007 2008 2009
Laundry & Home Care 10.3% 11.3% 12.3% 12.8% 15.4% Laundry & Home Care 1.28 1.39 1.51 1.60 1.61
Cosmetics/Toiletries 10.9% 11.5% 12.3% 13.2% 14.5% Cosmetics/Toiletries 1.20 1.23 1.33 1.40 1.42
Adhesives #VALUE! 11.2% 11.7% 7.0% 3.1% Adhesives 1.42 1.51 1.55 1.02 0.88
Operating margin (EBITA)
Segment 2005 2006 2007 2008 2009
Laundry & Home Care 11.4% 11.6% 11.8% 11.6% 13.4%
Cosmetics/Toiletries 12.9% 13.4% 13.3% 13.7% 14.3%
Adhesives #VALUE! 10.6% 10.9% 10.0% 4.8%
Henkel AG
ROIC, Margin, and Turnover
Henkel AG
Return on invested capital
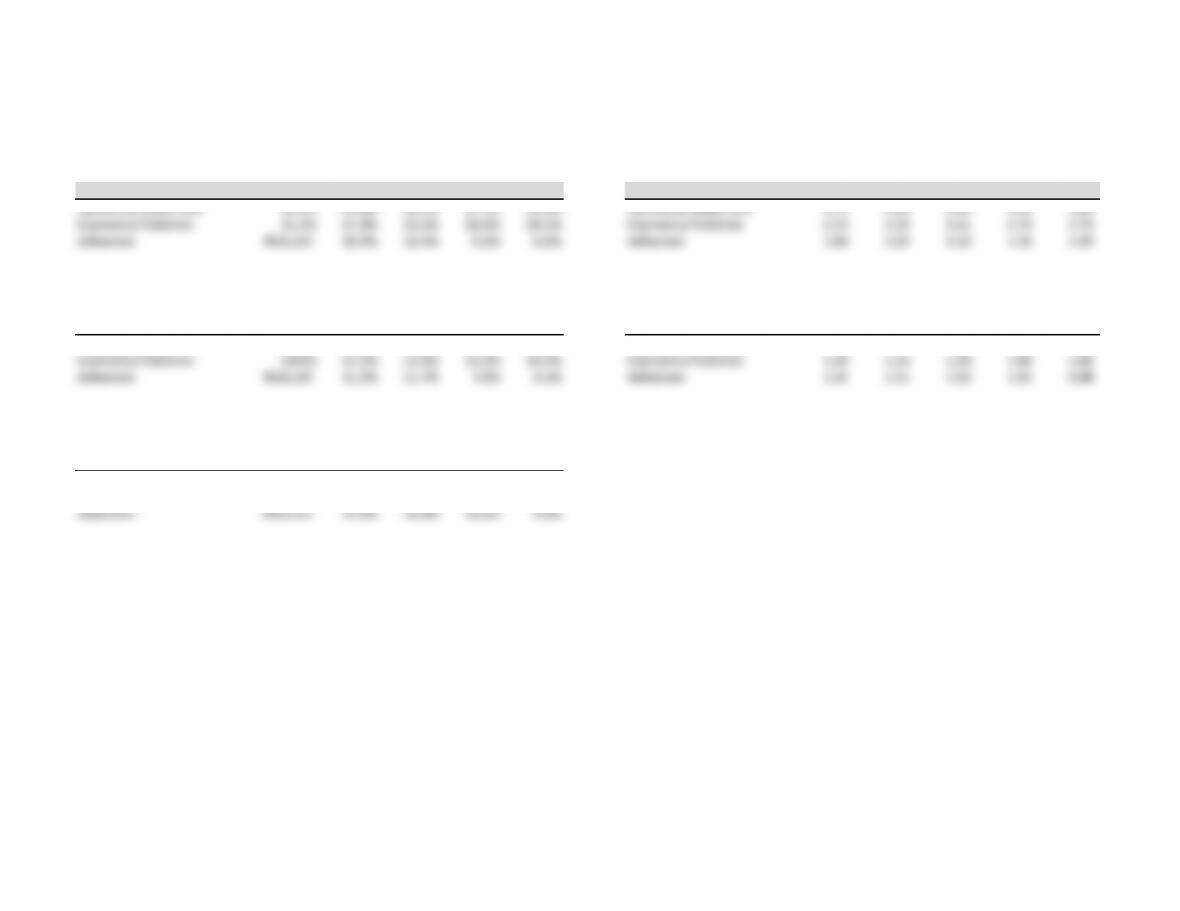
Return on capital 2005 2006 2007 2008 2009
Operating margin 10.2% 9.9% 10.7% 10.9% 10.3%
Operating tax rate 29.5% 29.9% 30.7% 31.2% 28.7%
After-tax operating margin 7.2% 6.9% 7.4% 7.5% 7.4%
Capital turnover (excl. intangibles) 4.2 4.8 4.7 4.7 4.8
Capital turnover (incl. intangibles) 2.3 2.3 2.5 2.1 1.6
ROIC (excluding intangibles) 30.3% 33.3% 34.8% 35.0% 35.1%
ROIC (including intangibles) 16.9% 15.9% 18.6% 15.8% 12.0%
Henkel AG
NOPLAT
Henkel AG Henkel AG
After-tax operating profits After-tax operating margins
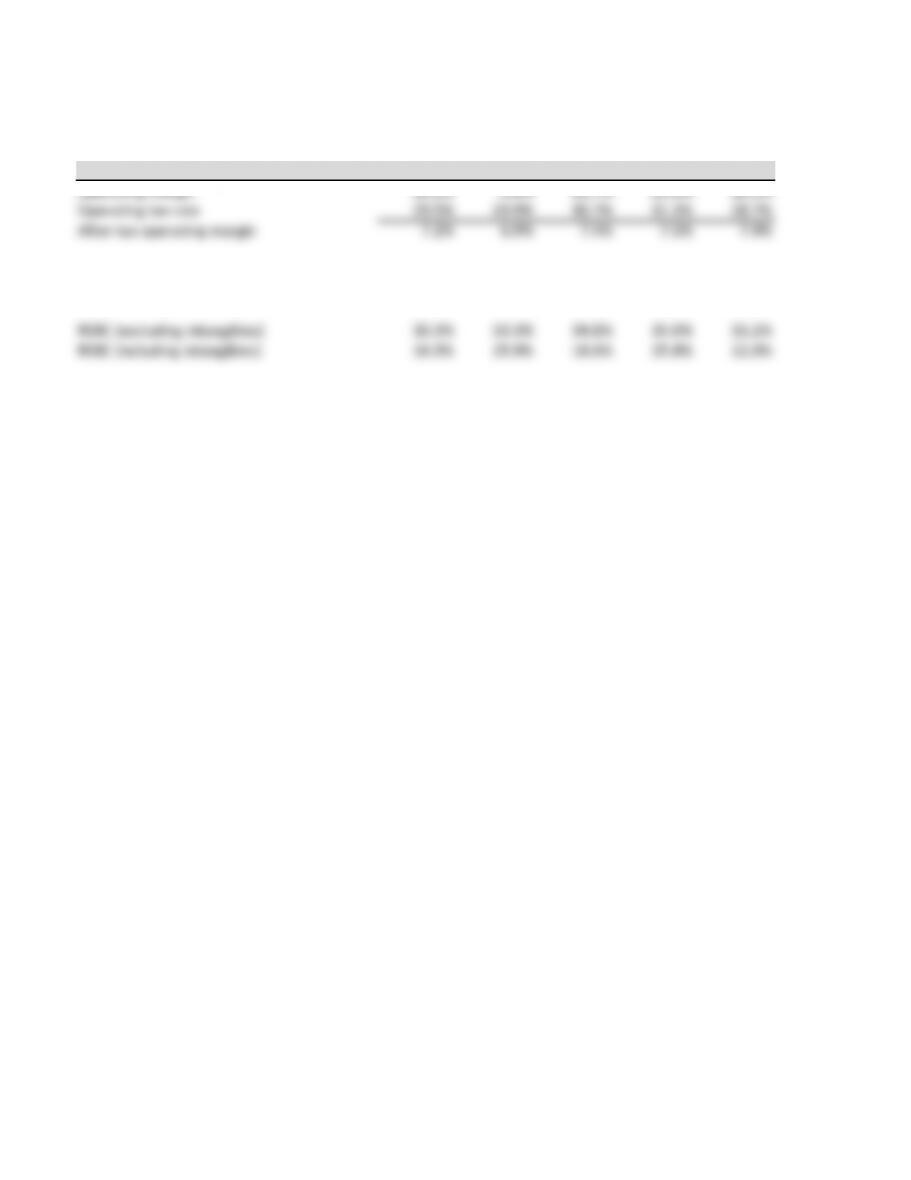
EUR million 2005 2006 2007 2008 2009 2005 2006 2007 2008 2009
Net revenues 11,974 12,740 13,074 14,131 13,573 13.0% 6.4% 2.6% 8.1% –3.9%
Cost of sales1(6,533) (6,963) (7,013) (7,817) (7,341) 54.6% 54.7% 53.6% 55.3% 54.1%
Gross profit 5,441 5,777 6,061 6,314 6,232 45.4% 45.3% 46.4% 44.7% 45.9%
Marketing, selling, and distribution1(3,409) (3,650) (3,748) (3,882) (3,874) 28.5% 28.6% 28.7% 27.5% 28.5%
Research and development1(324) (340) (350) (377) (383) 2.7% 2.7% 2.7% 2.7% 2.8%
General and administrative1(627) (697) (664) (698) (711) 5.2% 5.5% 5.1% 4.9% 5.2%
Other operating profit, net 92 118 48 84 30 0.8% 0.9% 0.4% 0.6% 0.2%
Amortization of intangibles 49 53 56 95 108 0.4% 0.4% 0.4% 0.7% 0.8%
Operating profit (EBITA) 1,222 1,261 1,403 1,536 1,402 10.2% 9.9% 10.7% 10.9% 10.3%
Operating taxes (360) (377) (431) (480) (402) 29.5% 29.9% 30.7% 31.2% 28.7%
After-tax operating profits 862 884 972 1,056 1,000 7.2% 6.9% 7.4% 7.5% 7.4%
Operating taxes
EUR million 2005 2006 2007 2008 2009 2005 2006 2007 2008 2009
Marginal taxes on EBITA 489 504 561 476 434 40.0% 40.0% 40.0% 31.0% 31.0%
Other operating taxes (129) (127) (130) 4 (32) –10.6% –10.1% –9.3% 0.3% –2.3%
Operating taxes 360 377 431 480 402 29.5% 29.9% 30.7% 31.2% 28.7%
Reconciliation to net income
EUR million 2005 2006 2007 2008 2009
Net income 770 871 941 1,233 628
Nonoperating taxes (16) (38) (61) (114) 15
Restructuring charges –––458 110
Other nonoperating income 7 (54) 2 (1) 38
Investment result (54) (32) (50) (775) 3
Interest (expense) income 126 106 107 190 132
Amortization 29 32 34 66 75
After-tax operating profits 862 884 972 1,056 1,000
Henkel AG
NOPLAT
1Adjusted for restructuring charges in 2008, 2009.
Henkel AG
Operating Taxes
Henkel AG Henkel AG
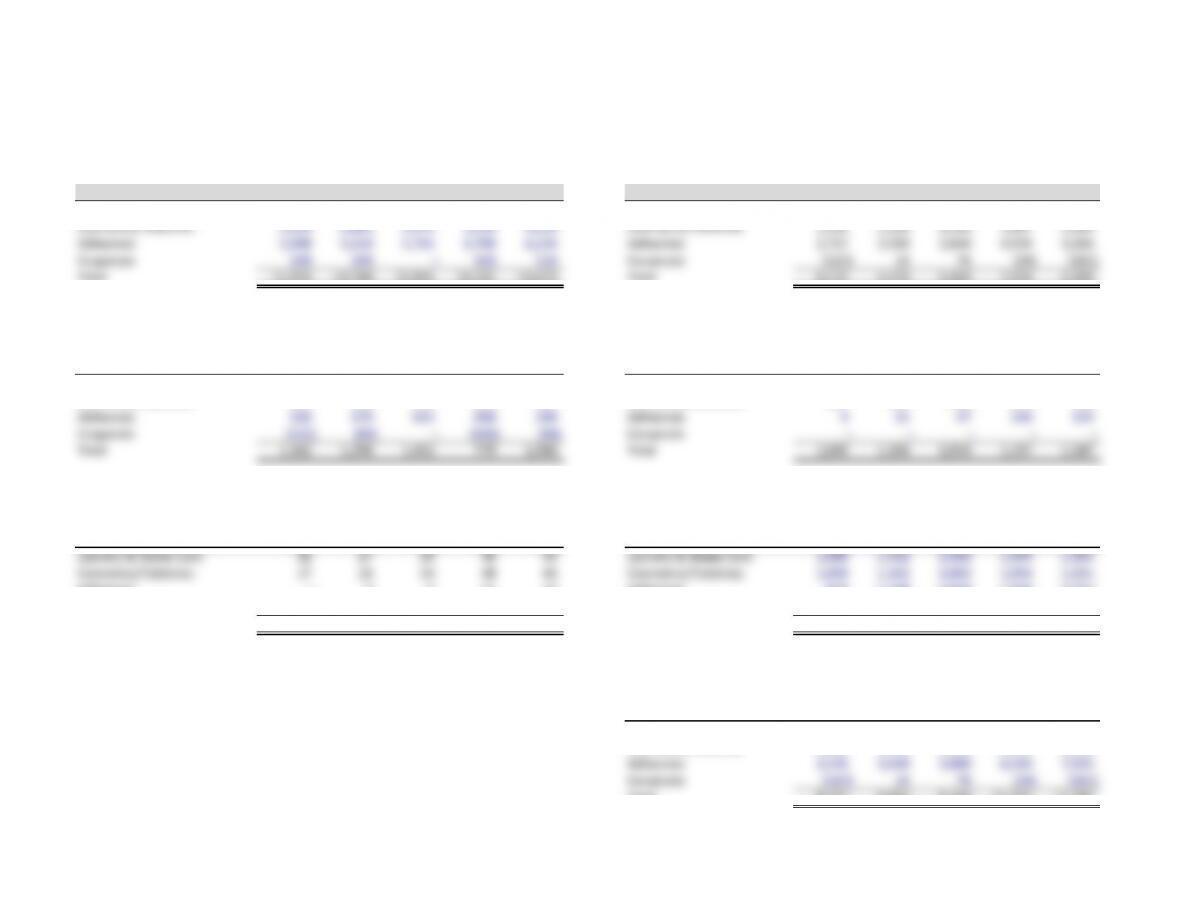
Tax reconciliation table Tax reconciliation table
EUR million 2005 2006 2007 2008 2009 Operating Percent 2005 2006 2007 2008 2009 Marginal
Taxes at statutory tax rate 417 470 500 504 274 Yes Taxes at statutory tax rate 40.0% 40.0% 40.0% 31.0% 31.0% Yes
Difference between local and domestic taxes (68) (139) (153) (26) (70) Yes Difference between local and domestic taxes –6.5% –11.8% –12.2% –1.6% –7.9%
Tax increases/reductions for prior years (2) (30) (46) (61) 7 Tax increases/reductions for prior years –0.2% –2.6% –3.7% –3.7% 0.8%
Taxes due to tax rate changes – – (13) 5 3 Taxes due to tax rate changes 0.0% 0.0% _1.0% 0.3% 0.3%
Nondeductible losses 13 22 32 10 (9) Nondeductible losses 1.2% 1.9% 2.6% 0.6% –1.0%
Tax rates on investments (27) (30) (34) (25) –Tax rates on investments –2.6% –2.6% –2.7% –1.5% #VALUE!
Tax-free income (107) (47) (25) (22) (22) Yes Tax-free income –10.3% –4.0% –2.0% –1.4% –2.5%
Write-down of intangible assets – – – 14 Write-down of intangible assets 0.0% 0.0% 0.0% 0.0% 1.6%
Trade tax additions 27 38 12 28 13 Yes Trade tax additions 2.6% 3.2% 1.0% 1.7% 1.5%
Nondeductible withholding tax 817 410 14 Yes Nondeductible withholding tax 0.8% 1.4% 0.3% 0.6% 1.6%
Other nondeductible expenses 11 432 14 33 Yes Other nondeductible expenses 1.1% 0.3% 2.6% 0.9% 3.7%
Write-down of Ecolab sale – – – (43) –Write-down of Ecolab sale 0.0% 0.0% 0.0% –2.6% 0.0%
Tax charge disclosed 272 305 309 394 257 Tax charge disclosed 26.1% 25.9% 24.7% 24.2% 29.0%
Earnings before taxes 1,042 1,176 1,250 1,627 885
Henkel AG Henkel AG
Tax breakout Tax rates
EUR million 2005 2006 2007 2008 2009 Percent 2005 2006 2007 2008 2009
Statutory 417 470 500 504 274 Marginal tax rate 40.0% 40.0% 40.0% 31.0% 31.0%
Operating (129) (127) (130) 4 (32) Effective tax rate 26.1% 25.9% 24.7% 24.2% 29.0%
Nonoperating (16) (38) (61) (114) 15 Operating tax rate 29.5% 29.9% 30.7% 31.2% 28.7%
Effective taxes 272 305 309 394 257
Note on trade tax
The trade tax is levied on every trade or business (also permanent
establishments) located in Germany. Municipalities are authorized
to determine their own rate of assessment independently (as a multiplier
of the base rate), which must be at least 200%. The trade tax is
not deductible as a business expense.
Henkel AG
Invested Capital
Henkel AG Henkel AG
Invested capital Capital efficiency
EUR million 2005 2006 2007 2008 2009 2005 2006 2007 2008 2009
Working cash 239 255 261 283 271 7.3 7.3 7.3 7.3 7.3
Inventories 1,232 1,325 1,283 1,482 1,218 37.6 38.0 35.8 38.3 32.8
Trade accounts receivable 1,794 1,868 1,694 1,847 1,721 54.7 53.5 47.3 47.7 46.3
Income tax refund claims 121 110 90 202 139 3.7 3.2 2.5 5.2 3.7
Other current assets 378 312 315 256 224 11.5 8.9 8.8 6.6 6.0
Operating current assets 3,764 3,870 3,643 4,070 3,573 114.8 110.9 101.7 105.1 96.1
Income tax provisions and liabilities –135 167 354 234 –3.9 4.7 9.1 6.3
Other short-term provisions 932 884 763 866 938 28.4 25.3 21.3 22.4 25.2
Accounts payable 1,333 1,494 1,477 1,678 1,885 40.6 42.8 41.2 43.3 50.7
Other current liabilities 455 224 200 306 251 13.9 6.4 5.6 7.9 6.7
Operating current liabilities 2,720 2,737 2,607 3,204 3,308 82.9 78.4 72.8 82.8 89.0
Working capital 1,044 1,133 1,036 866 265 8.7% 8.9% 7.9% 6.1% 2.0%
Property, plant, and equipment 1,364 1,516 1,749 2,337 2,248 11.4% 11.9% 13.4% 16.5% 16.6%
Other noncurrent assets 223 104 67 414 1.9% 0.8% 0.5% 0.0% 0.1%
Other noncurrent liabilities (59) (8) (10) (9) (20) –0.5% –0.1% –0.1% –0.1% –0.1%
Invested capital without goodwill 2,572 2,745 2,842 3,198 2,507 21.5% 21.5% 21.7% 22.6% 18.5%
Intangible assets 5,660 5,487 4,940 8,392 8,218 47.3% 43.1% 37.8% 59.4% 60.5%
Invested capital with goodwill 8,232 8,232 7,782 11,590 10,725 68.8% 64.6% 59.5% 82.0% 79.0%
Percent of sales
Days’ sales
Henkel AG
Invested Capital
Henkel AG
Reconciliation of total funds invested
EUR million 2005 2006 2007 2008 2009
Invested capital 8,232 8,232 7,782 11,590 10,725
Excess cash 973 674 1,179 55 839
Investments in associates 530 496 295 1–
Other investments 151 66 33 23 –
Net financial assets (assets – liabilities) 481 545 375 425 341
Deferred income taxes 456 363 249 305 322
Assets held for sale 142 14 125 113 30
Total funds invested 11,165 10,390 10,038 12,512 12,257
EUR million 2,005 2,006 2,007 2,008 2,009
Short-term borrowings 1,405 1,012 838 1,817 660
Long-term borrowings 2,400 2,322 2,304 2,402 3,426
Pensions and similar obligations 1,061 788 657 833 867
Other long-term provisions –126 119 336 241
Debt and debt equivalents 4,866 4,248 3,918 5,388 5,194
Deferred taxes 900 595 414 589 519
Minority interest 28 60 63 51 70
Stockholder equity 5,371 5,487 5,643 6,484 6,474
Total funds invested 11,165 10,390 10,038 12,512 12,257