
Integrative Case: Henkel AG Competitive Benchmarking of Henkel AG
Valuation
Henkel AG versus Reckitt Benckiser plc
Professor David Wessels © 2010
The Wharton School of the University of Pennsylvania
3620 Locust Walk, Philadelphia, PA 19104

Integrative Case: Henkel AG Competitive Benchmarking of Henkel AG
Presentation Overview
• Understanding a company’s past is essential to forecasting its future. For that
reason, we start with an in-depth analysis of historical operating performance.
•For Henkel AG, the company struggles to compete against its European
Household and Personal Care (HPC) counterparts, and specifically Reckitt
Benckiser plc. Henkel lags Reckitt Benckiser in each of the key value drivers:
organic revenue growth, operating margin, capital turnover, and financial
flexibility.
• Part of Henkel’s underperformance can be attributed to the economic
downturn and its reliance on its Adhesives segment, which is highly cyclical.
Yet even controlling for segment performance, Henkel still remains well
below best practices. This presentation examines each component in detail.
Valuation: Measuring and Managing the Value of Companies 2
Integrative Case: Henkel AG Competitive Benchmarking of Henkel AG
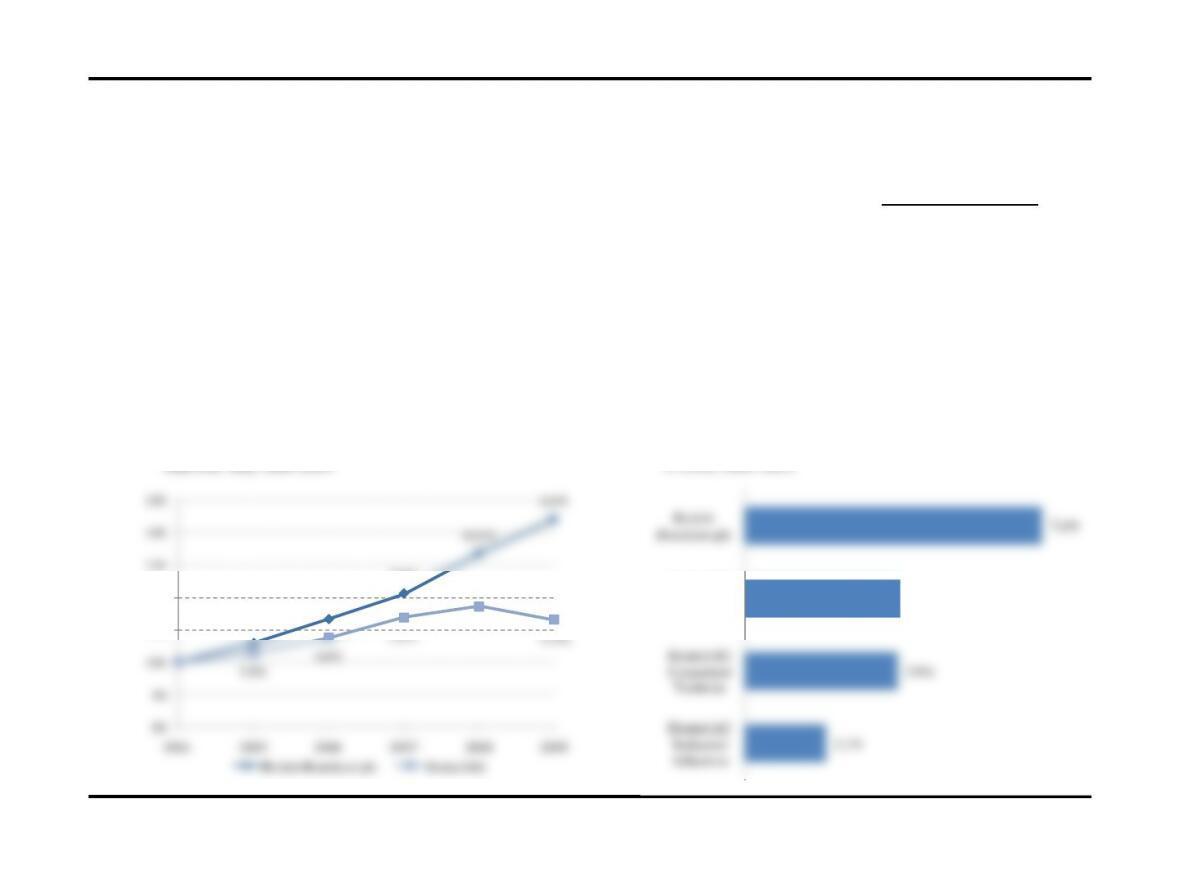
Revenue Growth
•Between 2005 and 2009, Reckitt Benckiser has outgrown Henkel AG each and every
year. Reckitt Benckiser even managed to record 8.0 percent organic revenue growth
during the global recession of 2009, as compared to Henkel’s negative 3.5 percent
growth.
• Henkel’s low organic growth is not caused by any particularly poor-performing segment.
Each division is growing at roughly the same rate.
4.0%
7.6%
Henkel AG
Henkel AG
Laundry &
Home Care
Reckitt
Benckiser plc
Organic Revenue Growth
CAGR, 2005-2009
6.0%
7.0%
7.0%
10.0%
8.0%
4.6%
5.8%
3.0%
-3.5%
110
120
130
140
150
Organic Revenue Growth
Year over Year, 2005-2009
Integrative Case: Henkel AG Competitive Benchmarking of Henkel AG
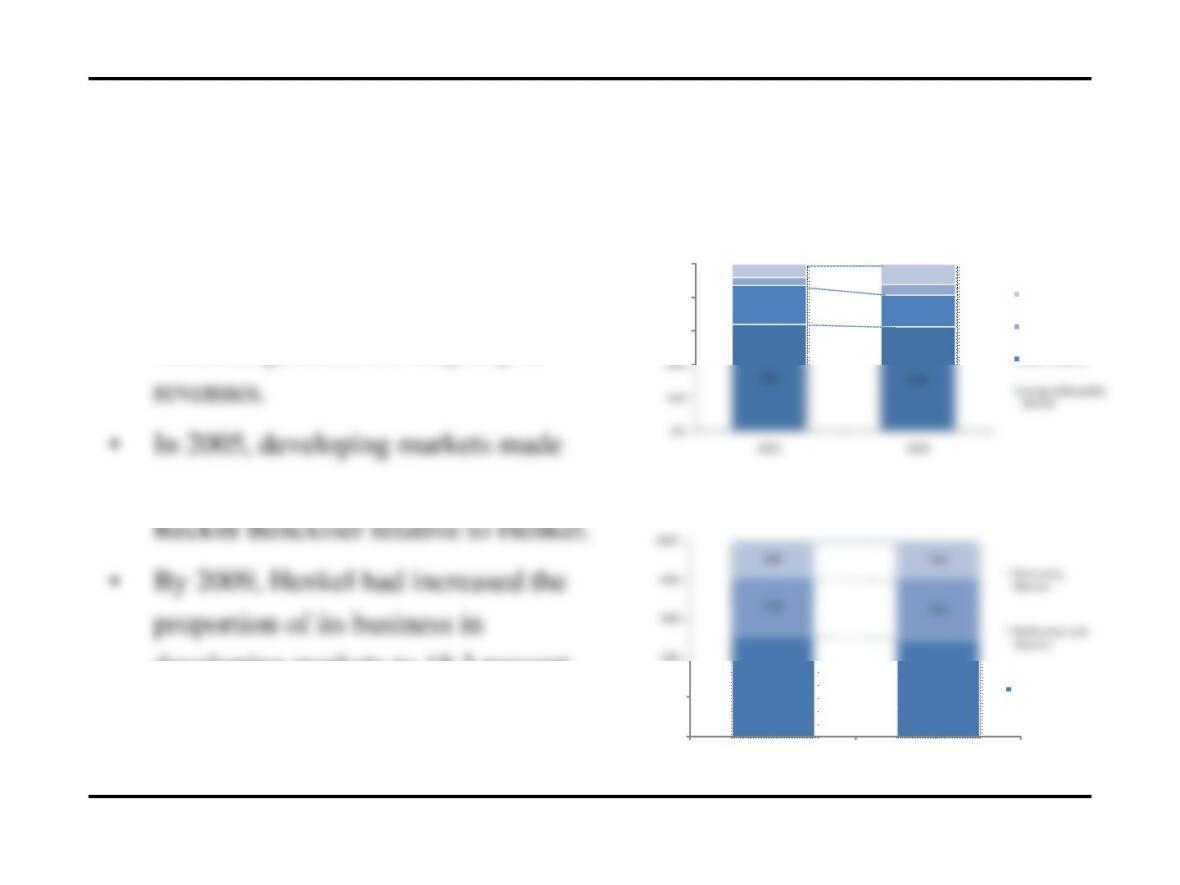
Revenues by Geography
•For both Henkel and Reckitt
Benckiser, Europe and North
America generate the majority of
up a larger portion of revenues for
developing markets to 18.3 percent,
Valuation: Measuring and Managing the Value of Companies 4
64%
62%
23%
19%
40%
60%
80%
100%
Henkel Revenue by Geography
Asia-Pacific
Latin America
North America
Europe/Africa/Mid
51%
49%
20%
40%
Reckitt Benckiser Revenue by Segment
Australia
Europe
Integrative Case: Henkel AG Competitive Benchmarking of Henkel AG
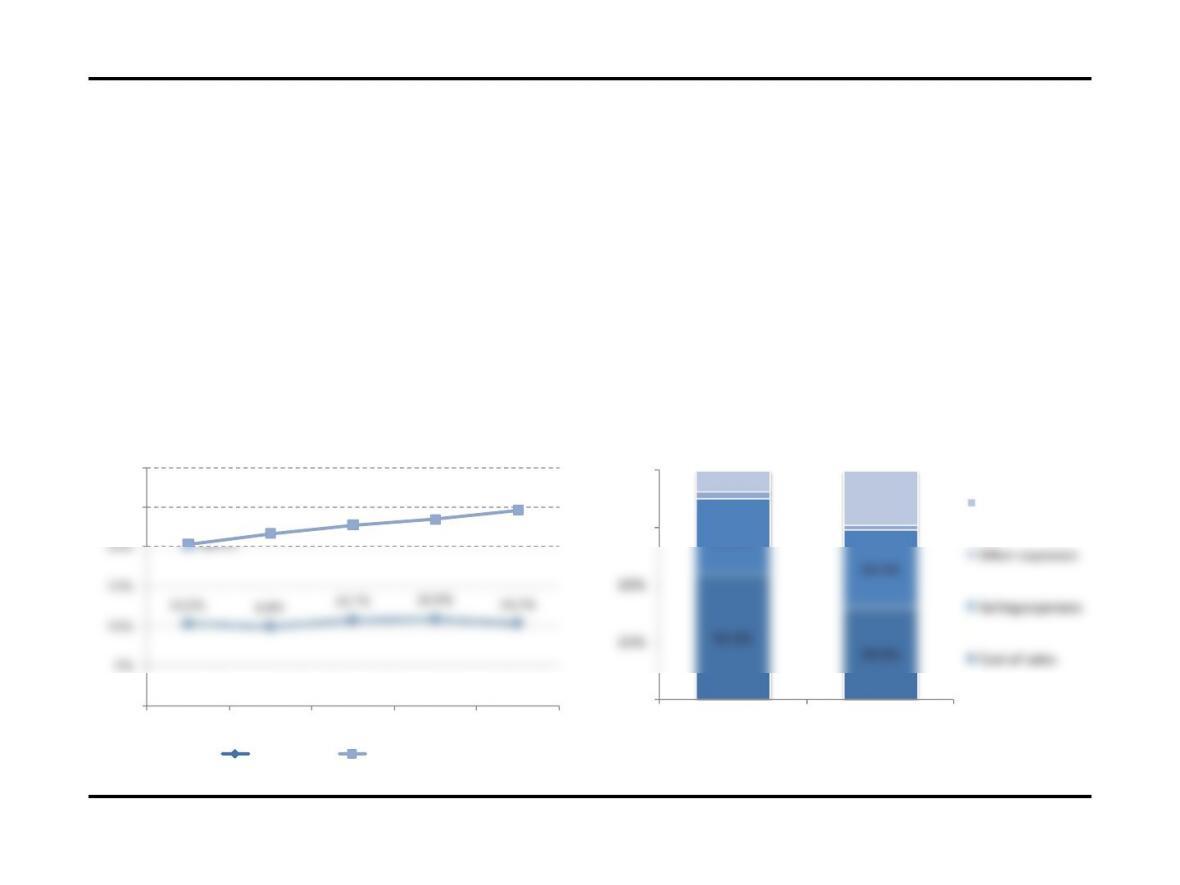
Operating Margins
•Reckitt Benckiser has consistently generated a higher operating margin than Henkel, and
this difference has expanded over the past five years. The company’s higher margins are a
result of its lower costs of sales, likely caused by higher prices from the company’s
premium products.
Valuation: Measuring and Managing the Value of Companies 5
54.1%
39.8%
33.8%
34.4%
9.3%
24.2%
25%
50%
75%
100%
Henkel AG
Reckitt Benckiser
Henkel AG versus Reckitt Benckiser plc
Breakdown of Revenue, 2009
Operating margin
Other expenses
Selling expenses
Cost of sales
10.2%
9.9%
10.7%
10.9%
10.3%
20.3%
21.7%
22.8%
23.5%
24.7%
5%
10%
15%
20%
25%
30%
2005
2006
2007
2008
2009
Henkel AG versus Reckitt Benckiser plc
EBITA (% of revenues), 2005–2009
Henkel AG
Reckitt Benckiser plc
Integrative Case: Henkel AG Competitive Benchmarking of Henkel AG
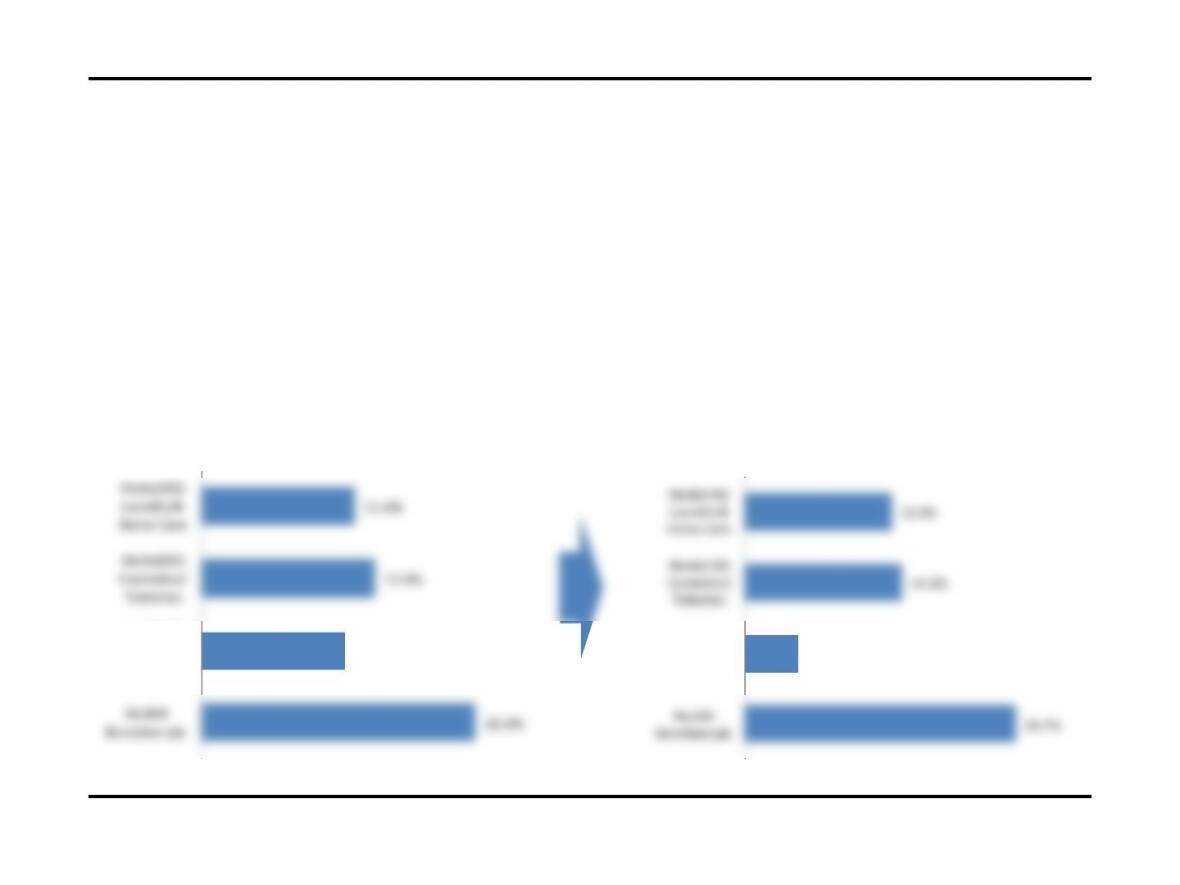
Margins by Segment
• Examining operating margins, and treating Reckitt Benckiser as a “pure play” relative to
Henkel’s individual segments, Reckitt Benckiser is more profitable than each of
Henkel’s segments. Operating margins expanded (somewhat) for Henkel’s
Cosmetics/Toiletries and Laundry/Home Care businesses, but fell for the Industrial
Adhesives business.
11.4%
12.9%
10.6%
20.3%
Henkel AG
Laundry &
Home Care
Henkel AG
Cosmetics/
Toiletries
Henkel AG
Industrial
Adhesives
Benckiser plc
Henkel AG versus Reckitt Benckiser plc
Operating margin (EBITA), 2005
13.4%
14.3%
4.8%
24.7%
Henkel AG
Laundry &
Home Care
Henkel AG
Cosmetics/
Toiletries
Henkel AG
Industrial
Adhesives
Benckiser plc
Henkel AG versus Reckitt Benckiser plc
Operating margin (EBITA,) 2009
Integrative Case: Henkel AG Competitive Benchmarking of Henkel AG
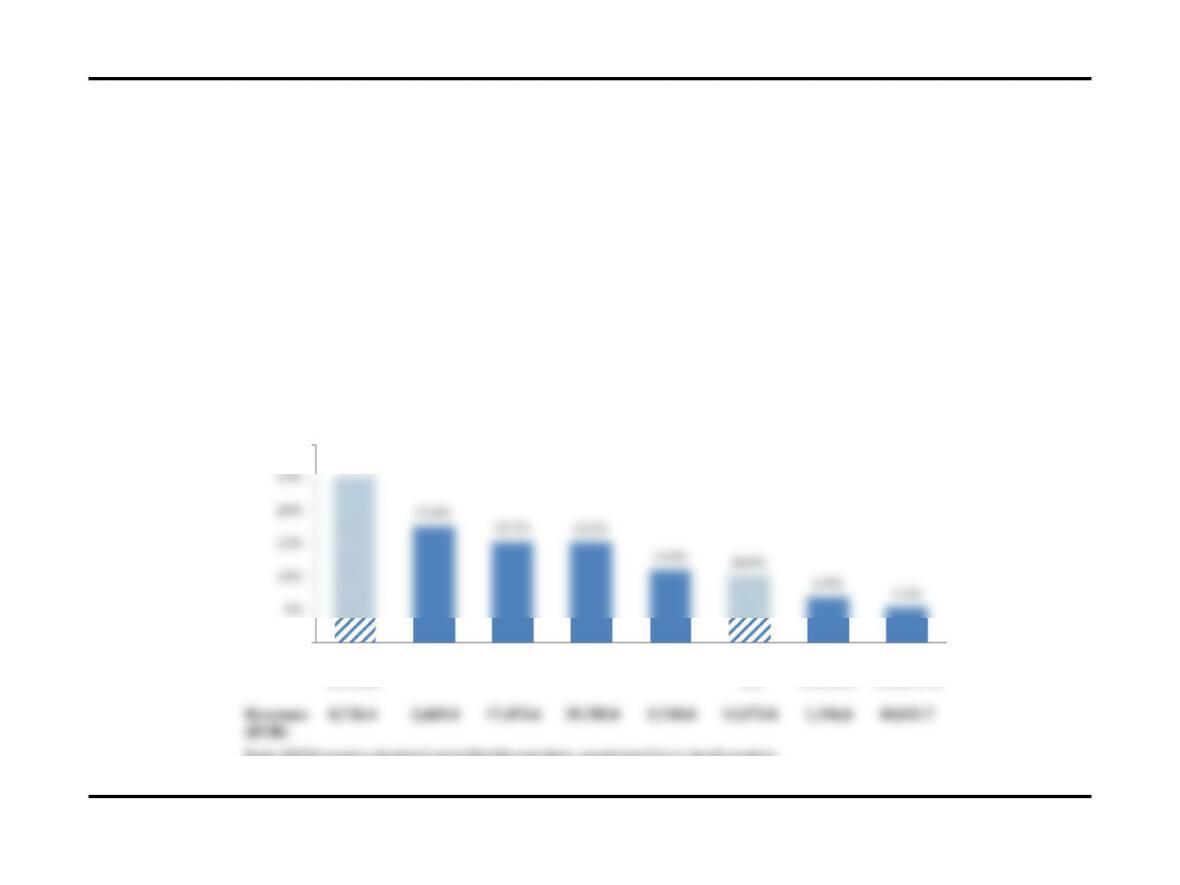
Industry Margins
•Across the European household and personal care industry (European HPC), Reckitt
Benckiser is the clear leader in operating margins. Henkel ranks near the bottom within
the industry, and the company reports slightly lower operating margins than its domestic
competitor, Beiersdorf AG.
Valuation: Measuring and Managing the Value of Companies 7
25.1%
17.6%
15.3%
15.2%
11.0%
10.0%
6.9%
5.4%
0%
5%
10%
15%
20%
25%
30%
Reckitt
Benckiser
Givaudan Sa
L’Oreal Sa
Unilever Plc
Beiersdorf Ag
Henkel Ag
And
Oriflame
Cosmetics
Svenska
Cellulosa Ab
European Household and Personal Care
Operating margin (EBITA), 2009
Revenues 8,726.4 2,669.4 17,472.6 39,785.8 5,748.0 13,573.0 1,316.6 10,821.7
(EUR)
Note: EBITA margin calculated using Worldscope data, unadjusted for in-depth analysis
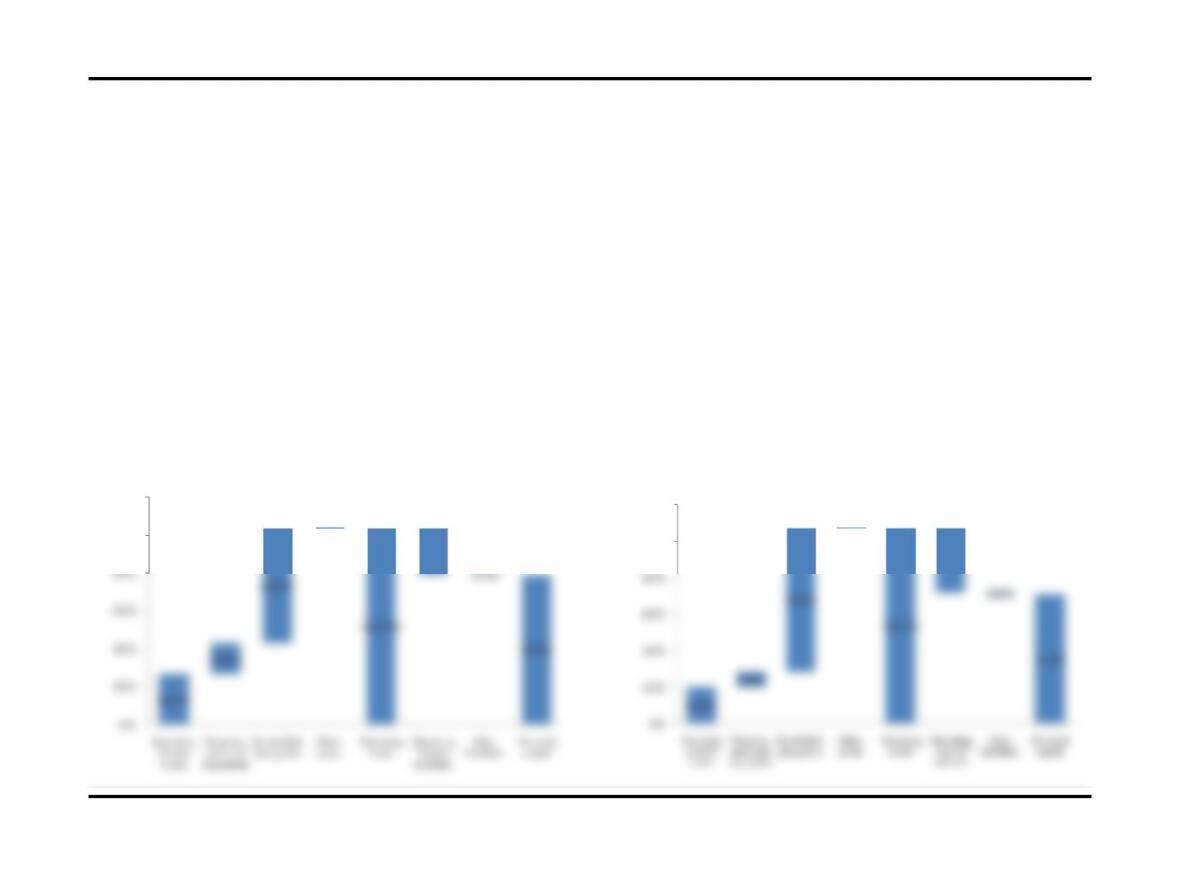
Integrative Case: Henkel AG Competitive Benchmarking of Henkel AG
Invested Capital Breakdown
•As a percentage of sales, Henkel and Reckitt Benckiser have a very similar amount of
operating current assets, operating assets, and invested capital.
•The primary difference in capital occurs because of property, plant, and equipment
(PP&E), acquired intangibles, and operating current liabilities. Henkel carries more
PP&E and Reckitt Benckiser carries more acquired intangibles and operating current
liabilities.
Valuation: Measuring and Managing the Value of Companies 8
26.3%
16.6%
60.5%
0.1%
103.5%
24.4%
0.1%
79.0%
20%
40%
60%
80%
100%
120%
Operating
current
assets
Property,
plant and
equipment
Goodwill &
intangibles
Other
assets
Operating
assets
Operating
current
liabilities
Other
liabilities
Invested
capital
Henkel AG
Percent of sales, 2009
20.2%
8.2%
78.6%
0.3%
107.3%
35.6%
0.8%
71.0%
20%
40%
60%
80%
100%
120%
Operating
current
assets
Property,
plant and
equipment
Goodwill &
intangibles
Other
assets
Operating
assets
Operating
current
liabilities
Other
liabilities
Invested
capital
Reckitt Benckiser plc
Percent of sales, 2009
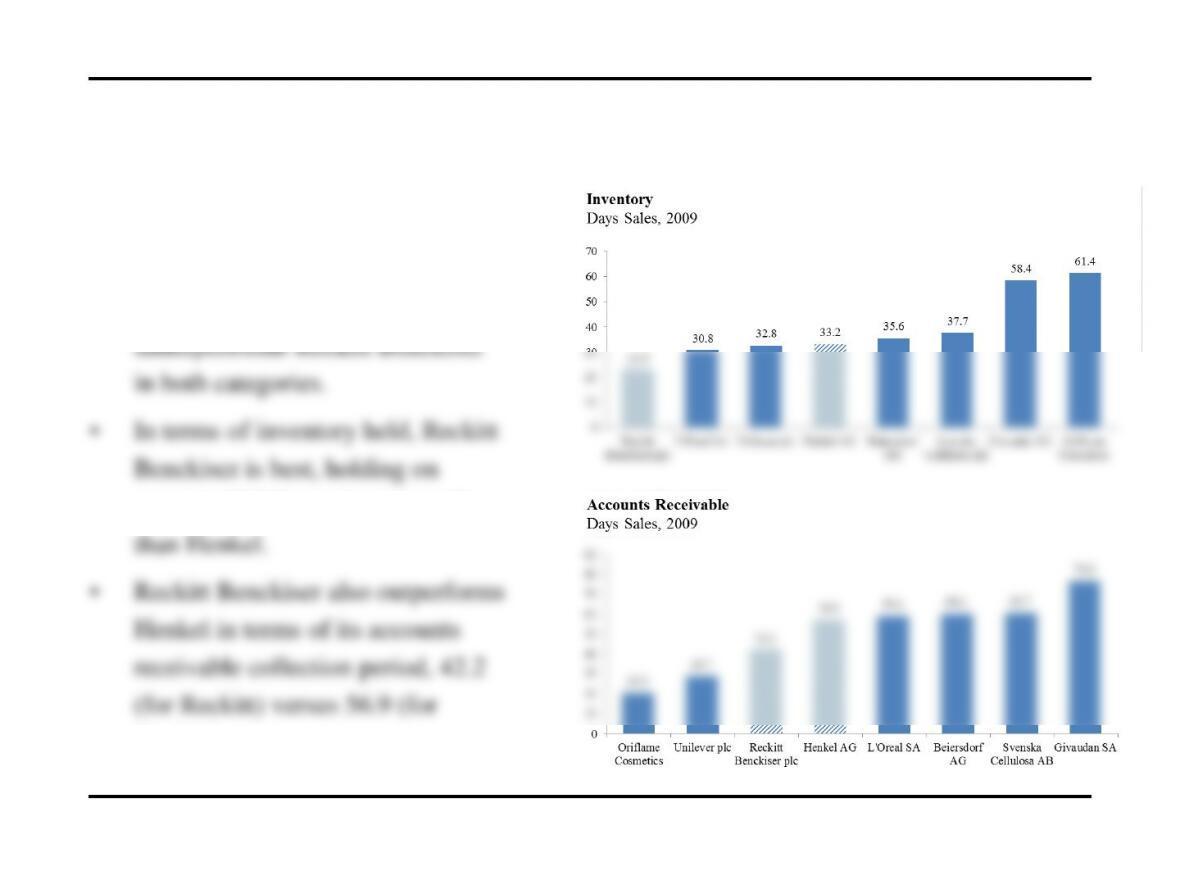
Integrative Case: Henkel AG Competitive Benchmarking of Henkel AG
•Henkel holds inventory and
accounts receivable in line with the
European HPC industry, but
average 10.3 fewer inventory days
Henkel).
Inventory and Accounts Receivable
Valuation: Measuring and Managing the Value of Companies 9
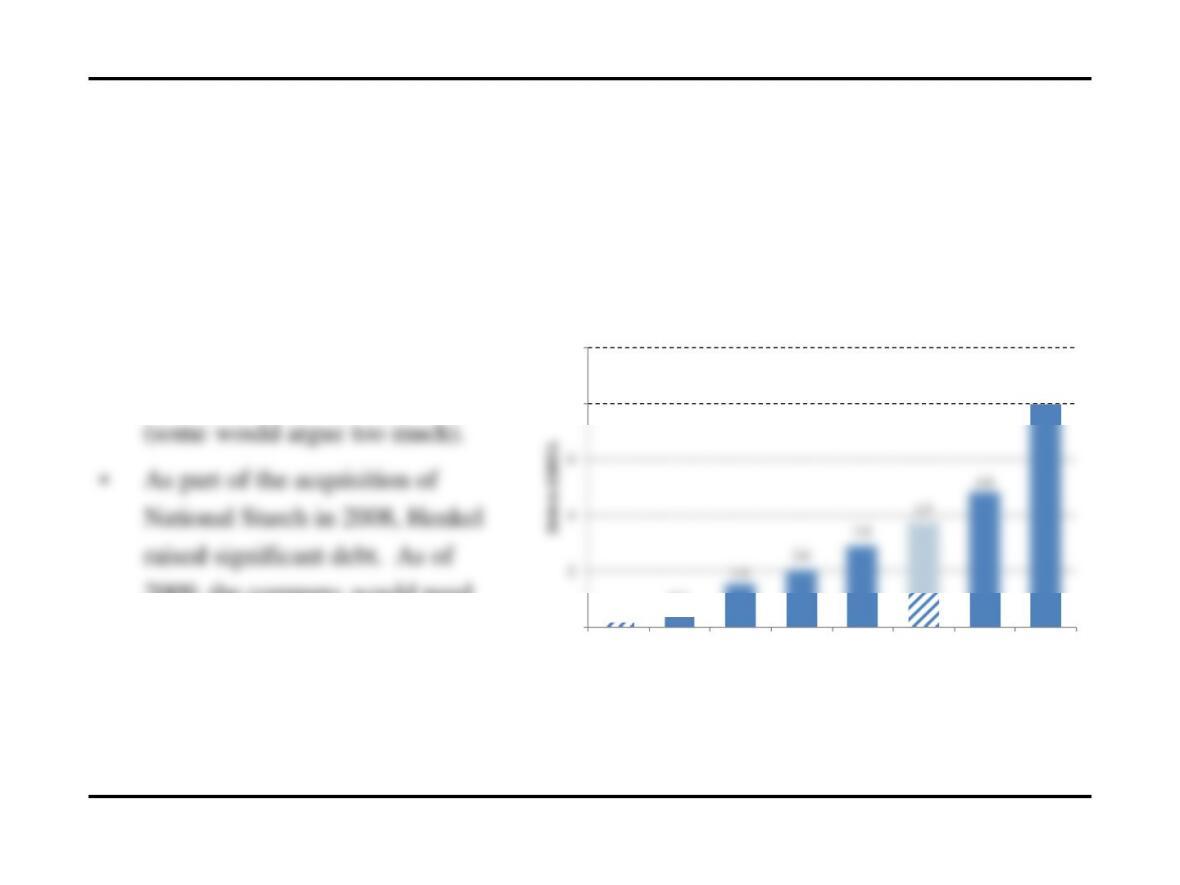
Integrative Case: Henkel AG Competitive Benchmarking of Henkel AG
Financial Health: Debt to EBITA
Valuation: Measuring and Managing the Value of Companies 10
•In addition to generating
industry best operating margins,
Reckitt Benckiser has
tremendous financial flexibility
2009, the company would need
3.7 years of EBITA to pay down
debt.
0.2
0.4
1.6
8.0
0
2
8
10
Reckitt
Benckiser
plc
Beiersdorf
AG
L’Oreal
SA
Unilever
plc
Oriflame
Cosmetics
Henkel
AG
Givaudan
SA
Svenska
Cellulosa
AB
European Household & Personal Care
Debt–to-EBITA, 2009