Valuation
Competitive Benchmarking: Henkel versus Reckitt Benckiser
Support Documents
Competitive Benchmarking: Henkel AG and Reckitt Benckiser plc
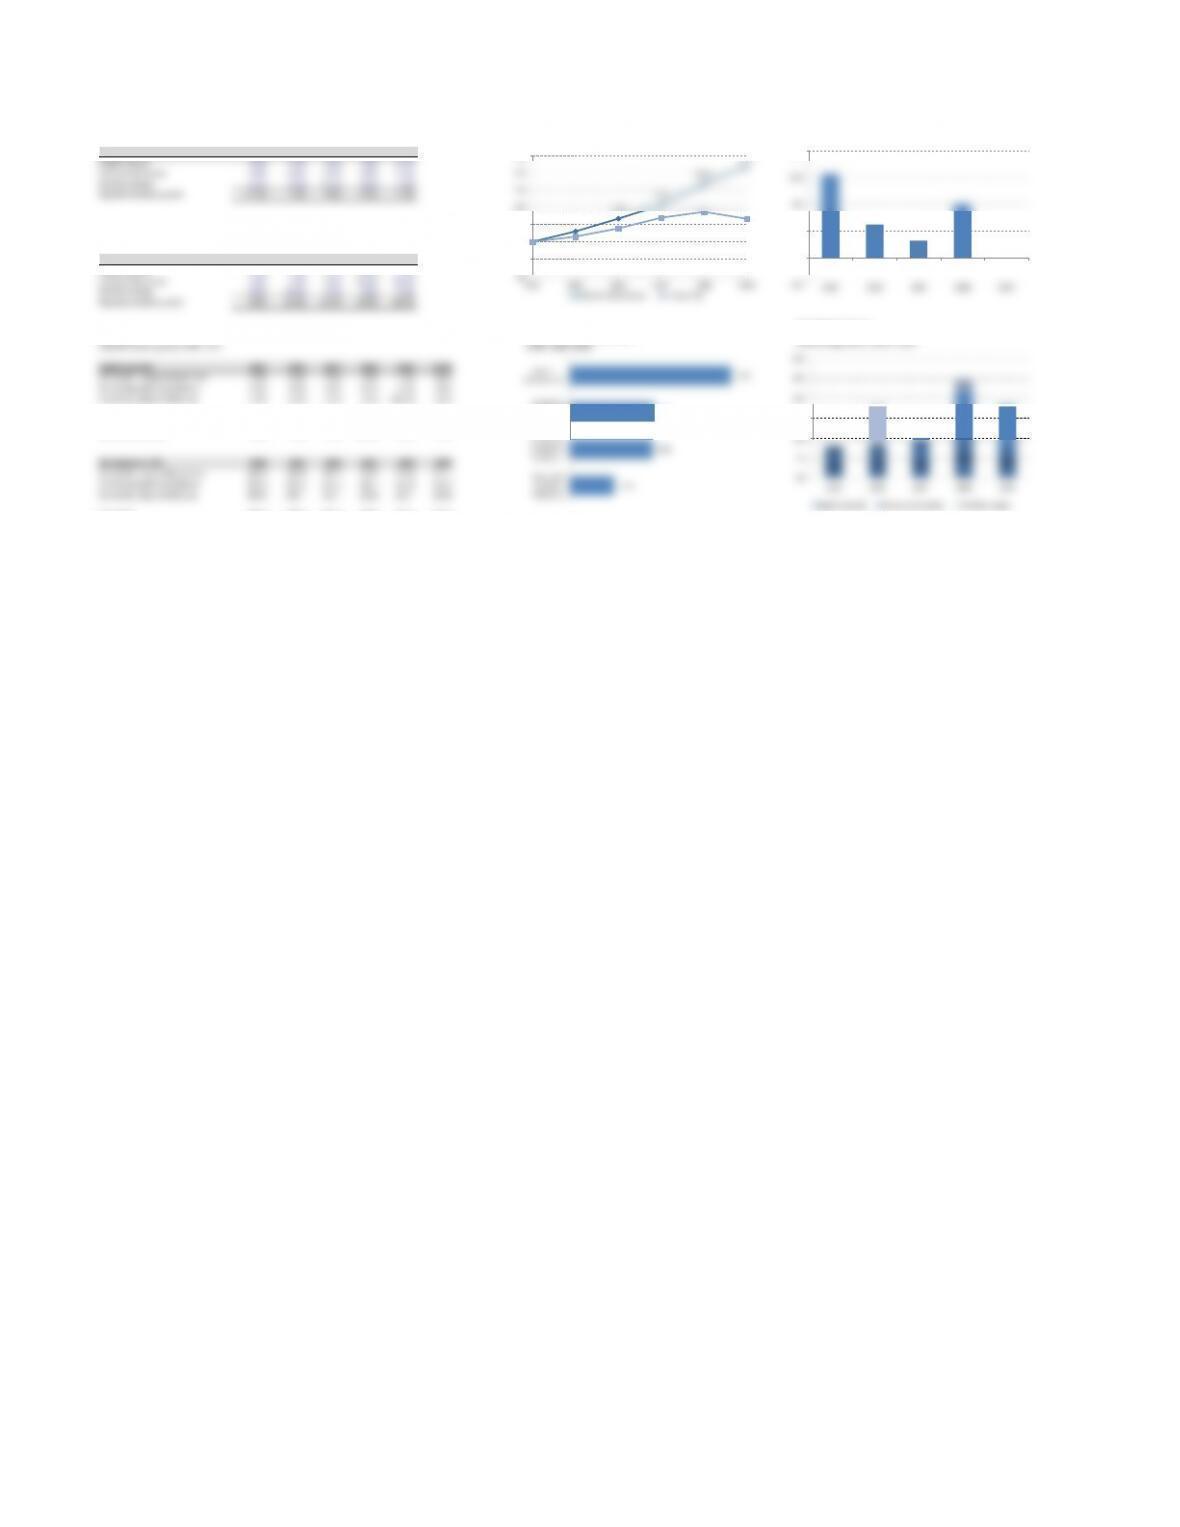
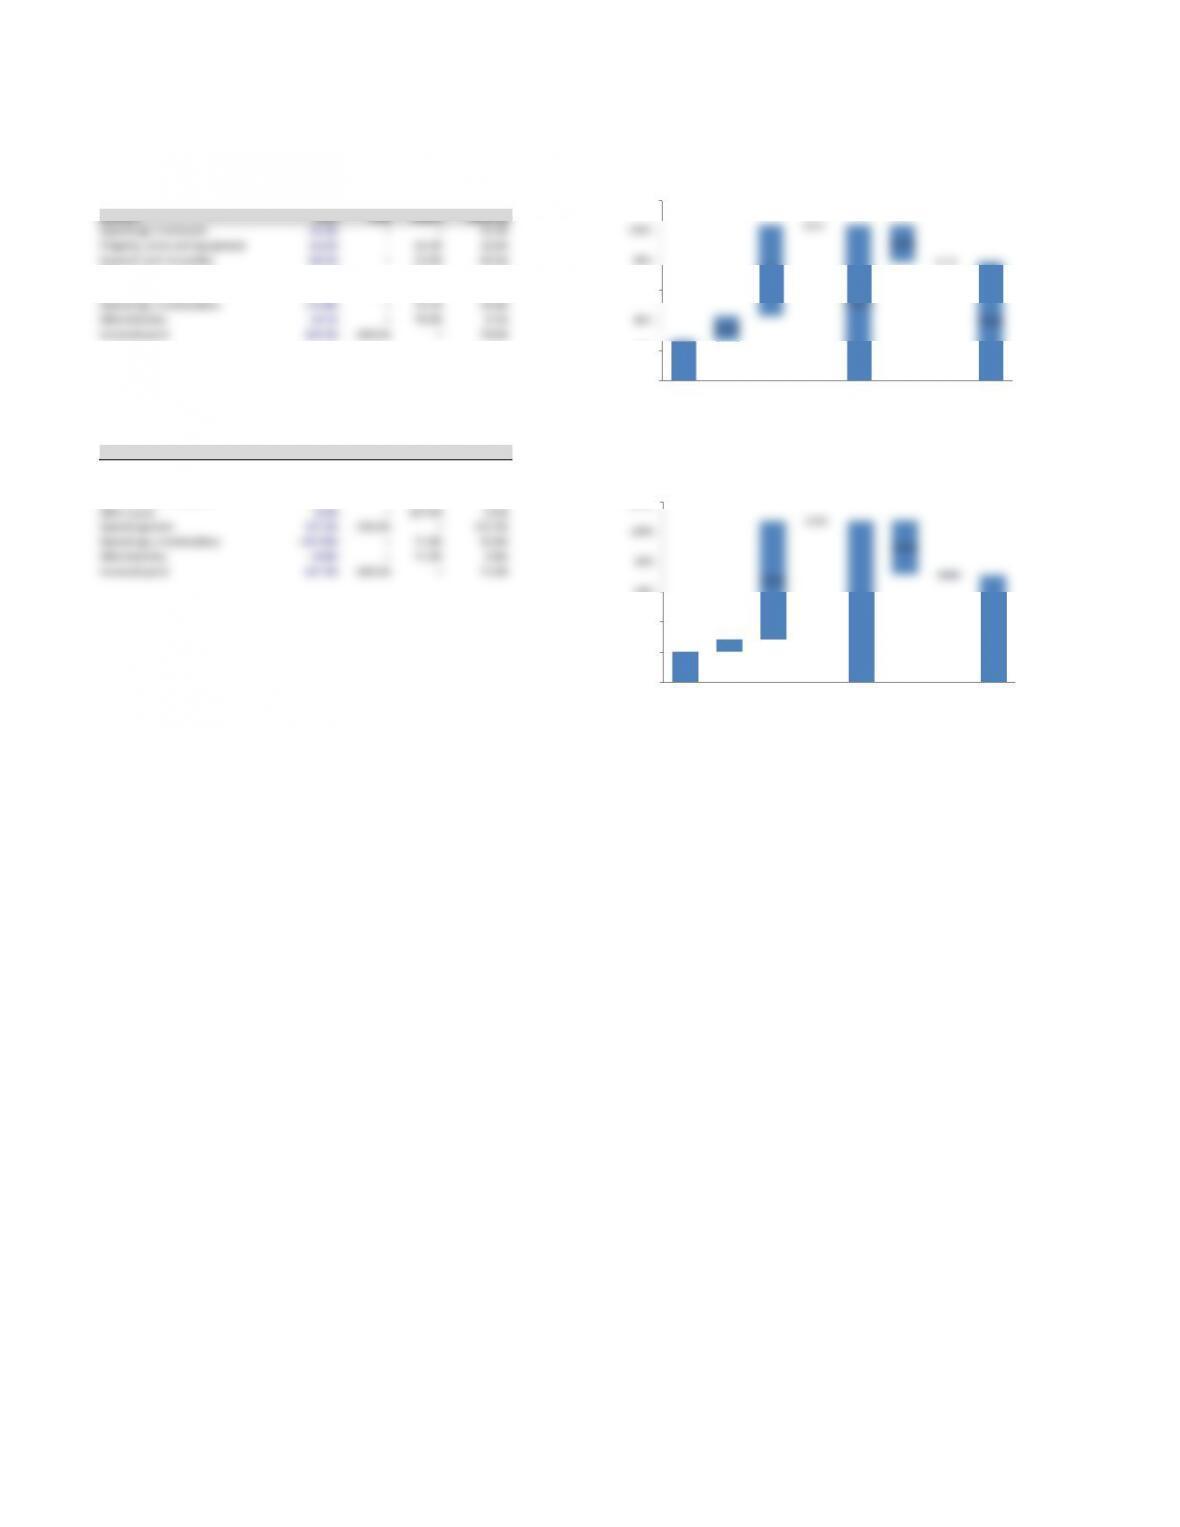
Revenue growth 2005–2009
Henkel AG 2005 2006 2007 2008 2009
Organic growth 3.0% 4.6% 5.8% 3.0% –3.5%
Currency fluctuation 1.0% –0.1% –2.7% –3.5% –2.4%
Portfolio change 8.5% 0.5% –0.5% 8.6% 2.0%
Reported revenue growth 12.5% 5.0% 2.6% 8.1% –3.9%
Reckitt Benckiser plc 2005 2006 2007 2008 2009
Organic growth 6.0% 7.0% 7.0% 10.0% 8.0%
Currency fluctuation 2.0% 1.0% 3.0% 12.0% 10.0%
Portfolio change 0.0% 10.0% 0.0% 3.0% 0.0%
Reported revenue growth 8.0% 18.0% 10.0% 25.0% 18.0%
Henkel AG
Segment revenue growth 2005–2009
Organic growth 2005 2006 2007 2008 2009 CAGR
Henkel AG Laundry & Home Care 3.0% 4.6% 5.5% 3.8% 2.9% 4.0%
Henkel AG Cosmetics/ Toiletries 1.3% 4.1% 5.9% 4.7% 3.5% 3.9%
Henkel AG Industrial Adhesives 5.4% 8.5% 6.5% 1.3% –10.2% 2.1%
Henkel AG 3.0% 4.6% 5.8% 3.0% –3.5% 0.0%
Reckitt Benckiser plc 6.0% 7.0% 7.0% 10.0% 8.0% 7.6%
Normalized to 100 2004 2005 2006 2007 2008 2009
Henkel AG Laundry & Home Care 100.0 103.0 107.7 113.7 118.0 121.4
Henkel AG Cosmetics/ Toiletries 100.0 101.3 105.5 111.7 116.9 121.0
Henkel AG Industrial Adhesives 100.0 105.4 114.4 121.8 123.4 110.8
Henkel AG 100.0 103.0 107.7 114.0 117.4 113.3
Reckitt Benckiser plc 100.0 106.0 113.4 121.4 133.5 144.2
2.1%
3.9%
4.0%
7.6%
Henkel AG
Industrial
Adhesives
Henkel AG
Cosmetics/
Toiletries
Henkel AG
Laundry &
Home Care
Reckitt
Benckiser plc
Organic Revenue Growth
CAGR, 2005–2009
6.0%
7.0%
7.0%
10.0%
8.0%
3.0% 4.6%
5.8% 3.0% –3.5%
80
90
100
110
120
130
140
150
2004 2005 2006 2007 2008 2009
Organic Revenue Growth
Year over year, 2005–2009
Reckitt Benckiser plc Henkel AG
6.0% 7.0% 7.0% 10.0% 8.0%
2.0% 1.0% 3.0%
12.0%
10.0%10.0%
3.0%
0%
5%
10%
15%
20%
25%
30%
2005 2006 2007 2008 2009
Reckitt Benckiser
Revenue growth, 2005–2009
Organic growth Currency fluctuation Portfolio change
12.5%
5.0% 2.6%
8.1%
0.0%
-4%
0%
4%
8%
12%
16%
2005 2006 2007 2008 2009
Henkel AG
Reported revenue growth, 2005–2009
Henkel AG
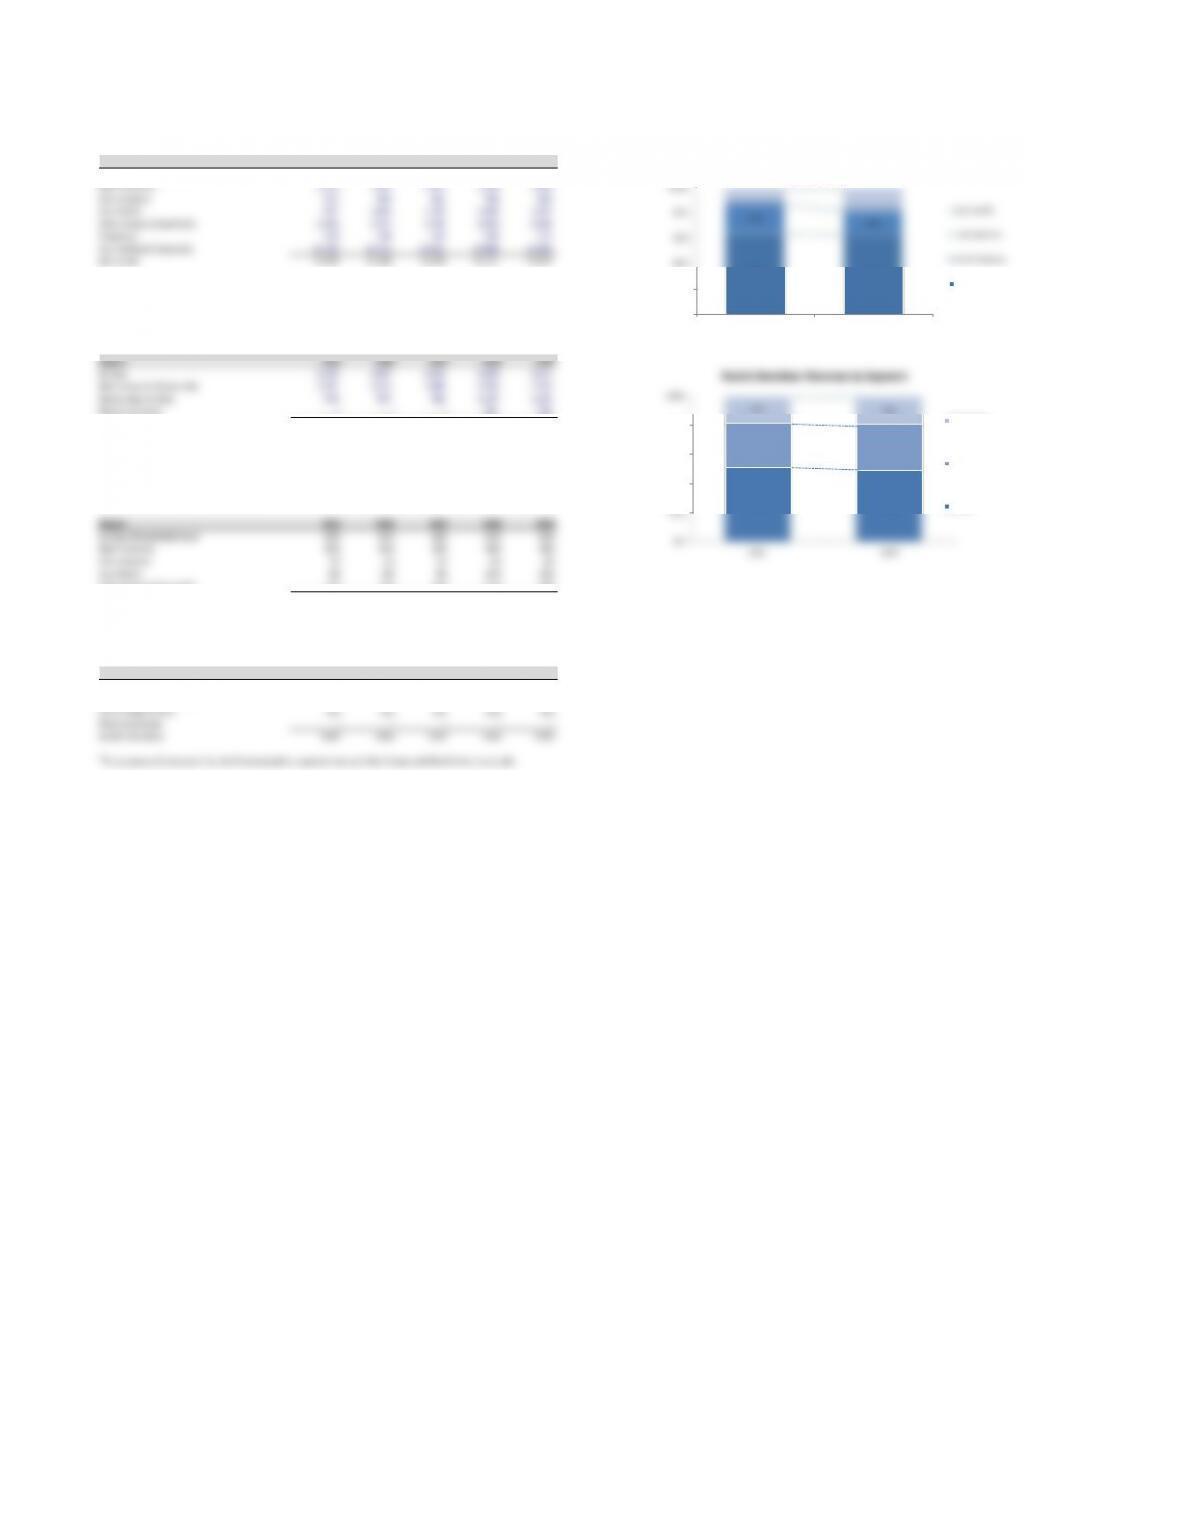
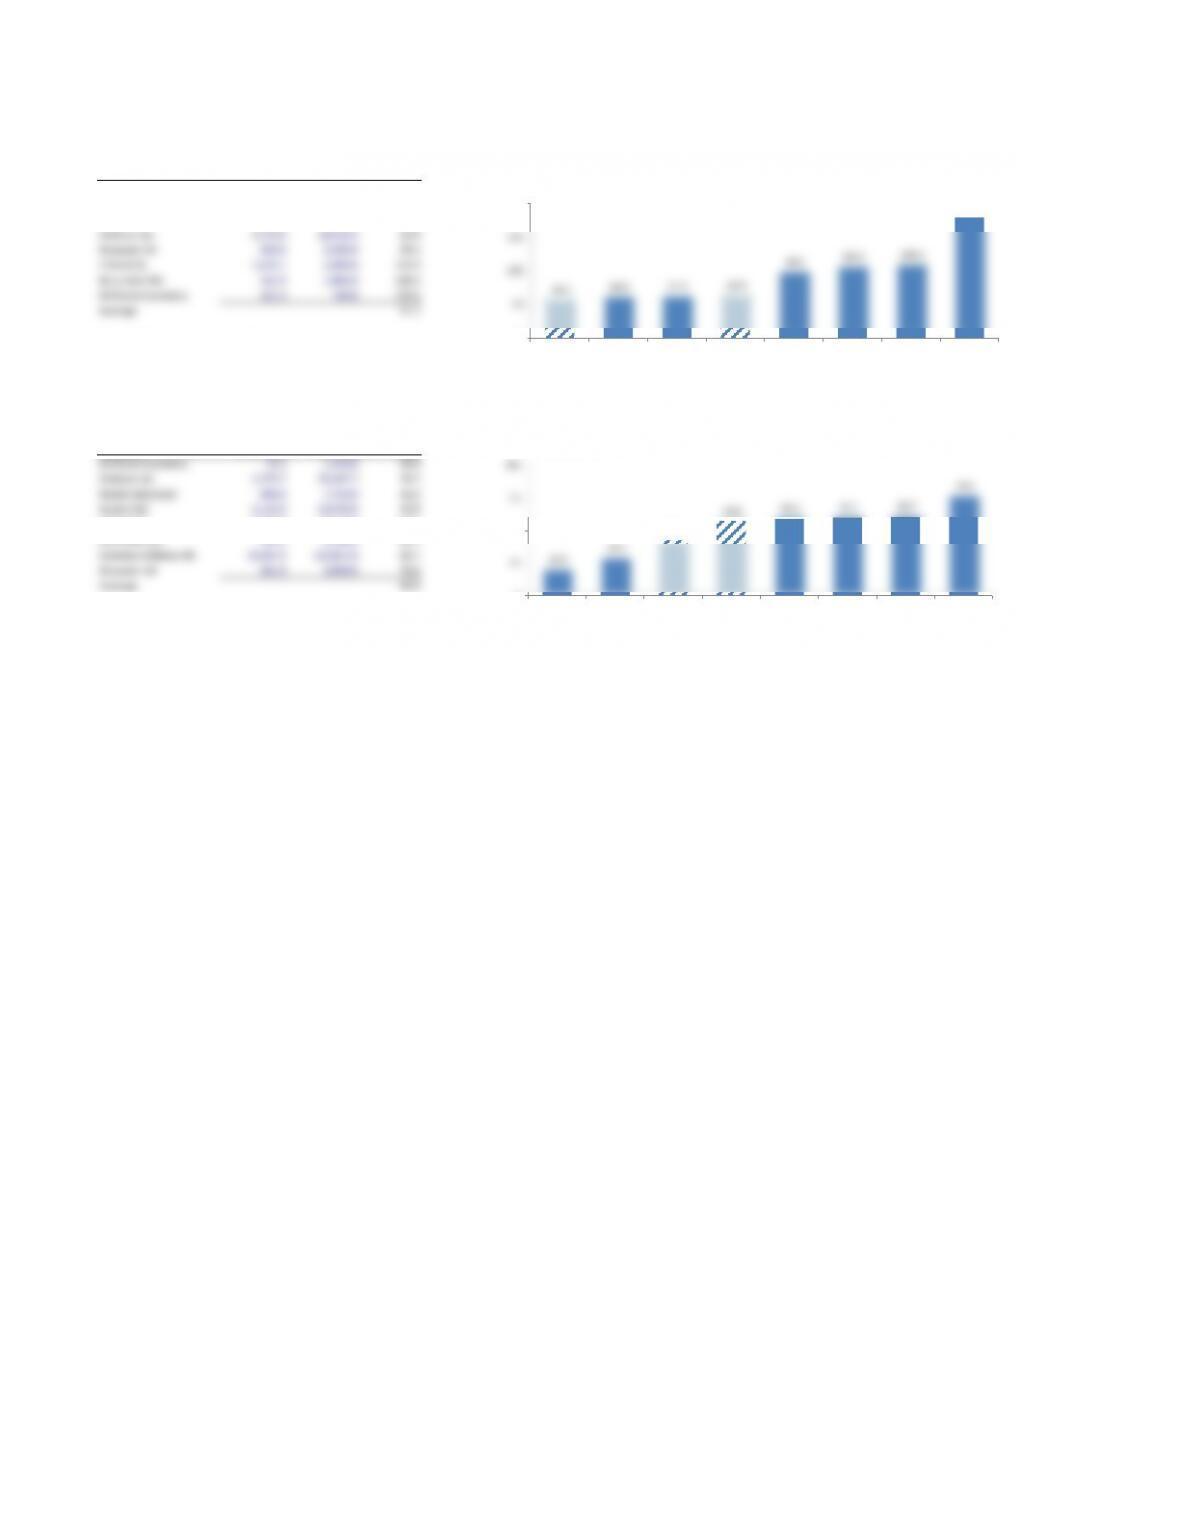
Revenue by geography, 2005–2009
Region12005 2006 2007 2008 2009
Europe/Africa/Middle East 7,490 8,045 8,480 8,863 8,335
North America 2,733 2,742 2,557 2,700 2,546
Latin America 571 663 691 780 825
Asia-Pacific 931 1,041 1,103 1,545 1,657
Latin America/ Asia-Pacific 1,502 1,704 1,794 2,325 2,482
Corporate 249 249 243 243 210
Sum (without Corporate) 11,725 12,491 12,831 13,888 13,363
Henkel AG 11,974 12,740 13,074 14,131 13,573
1Source: Henkel 2005–2009 Annual Reports.
Reckitt Benckiser
Revenue by geography, 2005–2009
Region12005 2006 2007 2008 2009
Europe 2,135 2,624 2,813 3,269 3,511
North America & Australia 1,281 1,421 1,488 1,766 2,160
Developing markets 763 877 968 1,187 1,494
Pharmaceuticals – – – 341 588
Reckitt Benckiser 4,179 4,922 5,269 6,563 7,753
1Source: Reckitt Benckiser 2005–2009 Annual Reports.
Henkel AG
Revenue percentage by region, 2005–2009
Region 2005 2006 2007 2008 2009
Europe/Africa/Middle East 64% 64% 66% 64% 62%
North America 23% 22% 20% 19% 19%
Latin America 5% 5% 5% 6% 6%
Asia-Pacific 8% 8% 9% 11% 12%
Latin America/ Asia-Pacific 13% 14% 14% 17% 19%
Henkel AG 100% 100% 100% 100% 100%
Reckitt Benckiser
Revenue percentage by segment, 2005–2009
Region 2005 2006 2007 20081 20091
Europe 51% 53% 53% 52% 49%
North America & Australia 31% 29% 28% 30% 32%
Developing markets 18% 18% 18% 18% 19%
Pharmaceuticals –––– –
Reckitt Benckiser 100% 100% 100% 100% 100%
1For purposes of comparability, the Pharmaceuticals segment was split into Europe and North America equally.
64% 62%
23% 19%
0%
20%
40%
60%
80%
100%
2005 2009
Henkel Revenue by Geography
Asia-Pacific
Latin America
North America
Europe/Africa/Mi
ddle East
51% 49%
31% 32%
18% 19%
0%
20%
40%
60%
80%
100%
2005 2009
Reckitt Benckiser Revenue by Segment
Developing
markets
North America &
Australia
Europe
Competitive Benchmarking: Henkel AG and Reckitt Benckiser plc
Percent of sales
Cost of sales 54.1% 39.8%
Selling expenses 33.8% 34.4%
Other expenses 2.8% 1.6%
Operating margin 9.3% 24.2%
Henkel AG versus Reckitt Benckiser
EBITA (% of revenues), 2005–2009
2005 2006 2007 2008 2009
Henkel AG 10.2% 9.9% 10.7% 10.9% 10.3%
Reckitt Benckiser plc 20.3% 21.7% 22.8% 23.5% 24.7%
Source: Henkel and Reckitt Benckiser reorganized financial statements.
Henkel AG versus Reckitt Benckiser
Margins (% of revenue), 2009
Percent of sales Henkel Percent of sales Reckitt
Gross profit 45.9% Gross profit 60.2%
Marketing, selling, and distribution
28.5% Marketing and distribution 27.3%
Operating profit (EBITA) 10.3% General and administrative 7.0%
Operating profit (EBITA) 24.7%
Source: Henkel and Reckitt Benckiser reorganized financial statements.
Operating margins, 2009
Reckitt
Benckiser
Henkel AG
54.1% 39.8%
33.8%
34.4%
9.3% 24.2%
0%
25%
50%
75%
100%
Henkel AG Reckitt Benckiser
Henkel AG versus Reckitt Benckiser plc
Breakdown of revenue, 2009
Operating margin
Other expenses
Selling expenses
Cost of sales
10.2% 9.9% 10.7% 10.9% 10.3%
20.3% 21.7% 22.8% 23.5% 24.7%
0%
5%
10%
15%
20%
25%
30%
2005 2006 2007 2008 2009
Henkel AG versus Reckitt Benckiser plc
EBITA (% of revenues), 2005–2009
Henkel AG Reckitt Benckiser plc
Competitive Benchmarking: Henkel AG and Reckitt Benckiser plc
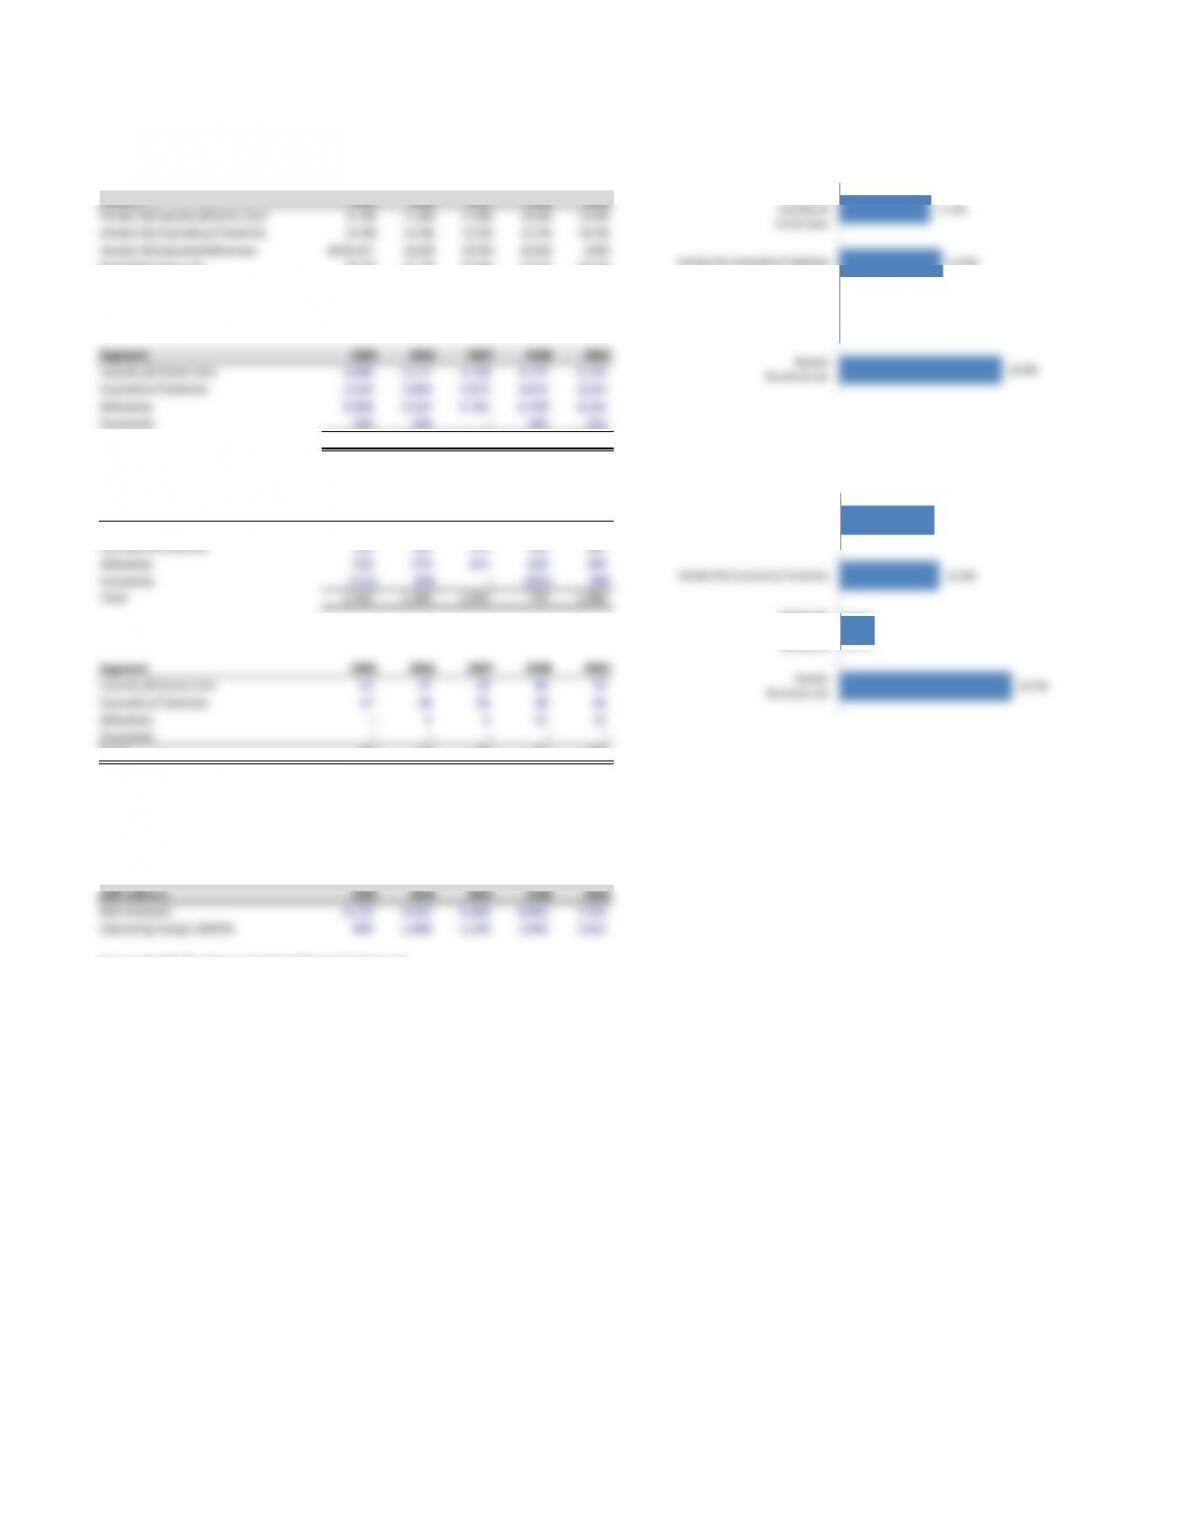
Operating margin (EBITA), 2005–2009
Percent 2005 2006 2007 2008 2009
Henkel AG Laundry & Home Care 11.4% 11.6% 11.8% 11.6% 13.4%
Henkel AG Cosmetics/Toiletries 12.9% 13.4% 13.3% 13.7% 14.3%
Henkel AG Industrial Adhesives #VALUE! 10.6% 10.9% 10.0% 4.8%
Reckitt Benckiser plc 20.3% 21.7% 22.8% 23.5% 24.7%
Revenues1
Segment 2005 2006 2007 2008 2009
Laundry & Home Care 4,088 4,117 4,148 4,172 4,129
Cosmetics/Toiletries 2,629 2,864 2,972 3,016 3,010
Adhesives 5,008 5,510 5,711 6,700 6,224
Corporate 249 249 –243 210
Total 11,974 12,740 12,831 14,131 13,573
Operating profit (EBITA)1
Segment 2005 2006 2007 2008 2009
Laundry & Home Care 433 449 459 439 501
Cosmetics/Toiletries 321 359 372 376 387
Adhesives 530 579 621 658 290
Corporate (122) (89) –(694) (98)
Total 1,162 1,298 1,452 779 1,080
Amortization (estimated)
Segment 2005 2006 2007 2008 2009
Laundry & Home Care 32 27 29 46 53
Cosmetics/Toiletries 17 24 24 38 44
Adhesives –2 2 11 12
Corporate –––––
Total 49 53 56 95 108
1Reorganized financial statements and Henkel 2009 Annual Report, page 84.
Reckitt Benckiser plc
Operating profit (EBITA)
GBP millions 2005 2006 2007 2008 2009
Net revenues 4,179 4,922 5,269 6,563 7,753
Operating margin (EBITA) 849 1,068 1,199 1,543 1,912
Source: Reckitt Benckiser reorganized financial statements.
11.4%
12.9%
0.0%
20.3%
Henkel AG
Laundry &
Home Care
Henkel AG Cosmetics/Toiletries
Henkel AG
Industrial
Adhesives
Reckitt
Benckiser plc
Henkel AG versus Reckitt Benckiser plc
Operating margin (EBITA), 2005
13.4%
14.3%
4.8%
24.7%
Henkel AG
Laundry &
Home Care
Henkel AG Cosmetics/Toiletries
Henkel AG
Industrial
Adhesives
Reckitt
Benckiser plc
Henkel AG versus Reckitt Benckiser plc
Operating margin (EBITA), 2009

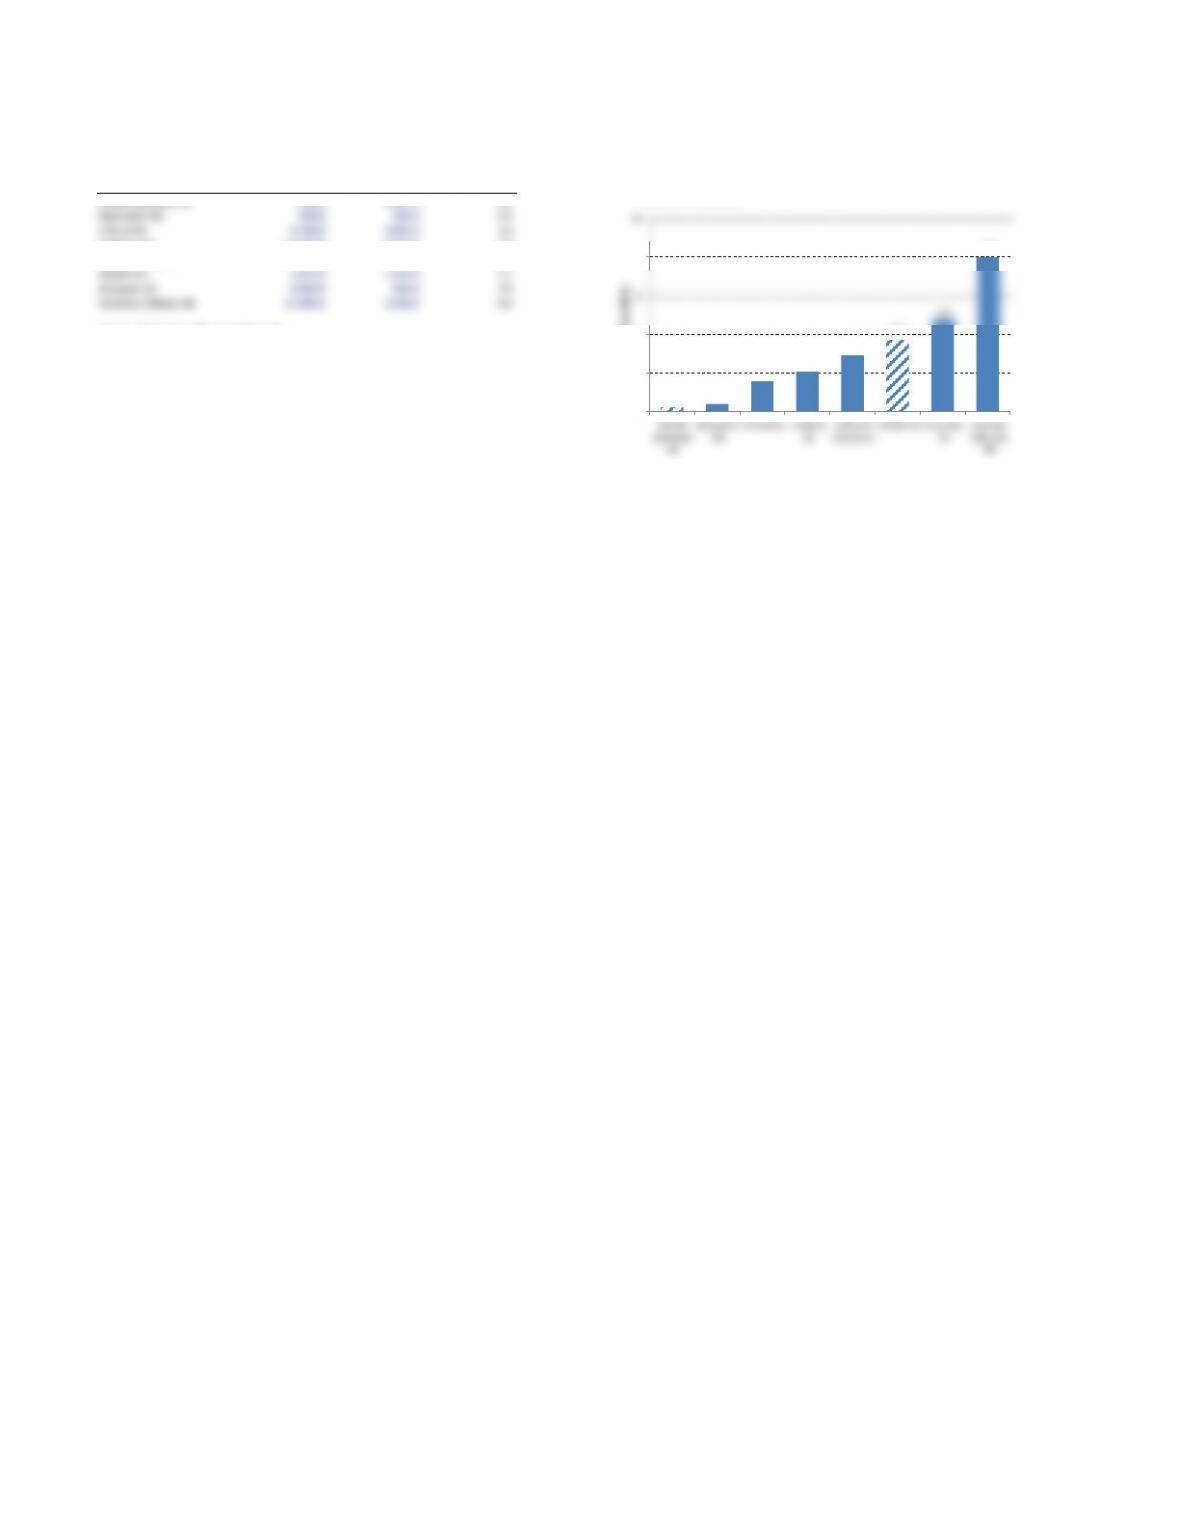
European Household and Personal Care
Operating margins (EBITA), 2009
Company EUR Native EBITA
Reckitt Benckiser 8,726.4 7,753.0 1,947.0 25.1%
Givaudan SA 2,669.4 3,959.0 696.0 17.6%
L’Oreal SA 17,472.6 17,472.6 2,665.6 15.3%
Unilever plc 39,785.8 35,347.7 5,375.4 15.2%
Beiersdorf AG 5,748.0 5,748.0 630.0 11.0%
Henkel AG 13,573.0 13,573.0 1,363.0 10.0%
Oriflame Cosmetics 1,316.6 1,316.6 90.4 6.9%
Svenska Cellulosa AB 10,821.7 110,857.0 5,938.0 5.4%
Source: JPMorgan, Worldscope, Thomson Financial.
Operating
margin
(EBITA)
Revenues
25.1%
17.6% 15.3% 15.2%
11.0% 10.0%
6.9% 5.4%
0%
5%
10%
15%
20%
25%
30%
Reckitt
Benckiser
Givaudan SA L’Oreal SA Unilever plc Beiersdorf AG Henkel AG Oriflame
Cosmetics
Svenska
Cellulosa AB
European Household and Personal Care
Operating margins (EBITA), 2009
Revenues 8,726.4 2,669.4 17,472.6 39,785.8 5,748.0 13,573.0 1,316.6 10,821.7
(EUR)
Note: EBITA margins calculated using Worldscope data, unadjusted for in-depth analysis.
Competitive Benchmarking: Henkel AG and Reckitt Benckiser plc
Invested capital
Henkel AG
Percent of sales, 2009
Account Data Total Hidden Showing
Operating current assets 26.3% – – 26.3%
Property, plant, and equipment 16.6% –26.3% 16.6%
Goodwill and intangibles 60.5% –42.9% 60.5%
Other assets 0.1% –103.4% 0.1%
Operating assets 103.5% 100.0% –103.5%
Operating current liabilities –24.4% –79.1% 24.4%
Other liabilities –0.1% –79.0% 0.1%
Invested capital 103.5% 100.0% –79.0%
Reckitt Benckiser
Percent of sales, 2009
Account Data Total Hidden Showing
Operating current assets 20.2% – – 20.2%
Property, plant, and equipment 8.2% –20.2% 8.2%
Goodwill and intangibles 78.6% –28.4% 78.6%
Other assets 0.3% –107.0% 0.3%
Operating assets 107.3% 100.0% –107.3%
Operating current liabilities –35.59% –71.8% 35.6%
Other liabilities –0.8% –71.0% 0.8%
Invested capital 107.3% 100.0% –71.0%
26.3%
16.6%
60.5%
0.1%
103.5%
24.4%
0.1%
79.0%
0%
20%
40%
60%
80%
100%
120%
Operating
current
assets
Property,
plant, and
equipment
Goodwill and
intangibles
Other
assets
Operating
assets
Operating
current
liabilities
Other
liabilities
Invested
capital
Henkel AG
Percent of sales, 2009
20.2%
8.2%
78.6%
0.3%
107.3%
35.6%
0.8%
71.0%
0%
20%
40%
60%
80%
100%
120%
Operating
current
assets
Property,
plant, and
equipment
Goodwill and
intangibles
Other
assets
Operating
assets
Operating
current
liabilities
Other
liabilities
Invested
capital
Reckitt Benckiser plc
Percent of sales, 2009
European HPC
Inventory days’ sales, 2009
Company Inventory COGS Days
Reckitt Benckiser 486.0 3,115.0 56.9
Svenska Cellulosa AB 11,459.0 68,844.0 60.8
Henkel AG 1,236.0 7,293.0 61.9
Unilever plc 3,173.0 18,416.3 62.9
Givaudan SA 633.0 2,355.0 98.1
L’Oreal SA 1,476.7 5,090.8 105.9
Beiersdorf AG 561.0 1,892.0 108.2
Oriflame Cosmetics 221.3 450.8 179.2
Average 91.7
Source: JPMorgan, Worldscope, Thomson Financial.
European HPC
Accounts receivable days’ sales, 2009
Company Receivables Revenues Days
Oriflame Cosmetics 72.1 1,316.6 20.0
Unilever plc 2,775.7 35,347.7 28.7
Reckitt Benckiser 896.0 7,753.0 42.2
Henkel AG 2,115.0 13,573.0 56.9
L’Oreal SA 2,826.8 17,472.6 59.1
Beiersdorf AG 947.0 5,748.0 60.1
Svenska Cellulosa AB 18,447.0 110,857.0 60.7
Givaudan SA 831.0 3,959.0 76.6
Average 50.5
Source: JPMorgan, Worldscope, Thomson Financial.
56.9 60.8 61.9 62.9
98.1 105.9 108.2
179.2
0
50
100
150
200
Reckitt
Benckiser
Svenska
Cellulosa AB
Henkel AG Unilever plc Givaudan SA L’Oreal SA Beiersdorf AG Oriflame
Cosmetics
Inventory
Days’ cost of sales, 2009
20.0 28.7
42.2
56.9 59.1 60.1 60.7
76.6
0
25
50
75
100
Oriflame
Cosmetics
Unilever plc Reckitt
Benckiser
Henkel AG L’Oreal SA Beiersdorf AG Svenska
Cellulosa AB
Givaudan SA
Accounts Receivable
Days’ sales, 2009
Competitive Benchmarking: Henkel AG and Reckitt Benckiser plc
Capital structure, 2009
Company name
Reckitt Benckiser plc 336.0 1,947.0 0.2
Beiersdorf AG 236.0 630.0 0.4
L’Oreal SA 4,146.8 2,665.6 1.6
Unilever plc 11,010.8 5,375.4 2.0
Oriflame Cosmetics 262.3 90.4 2.9
Henkel AG 5,023.0 1,363.0 3.7
Givaudan SA 3,355.0 696.0 4.8
Svenska Cellulosa AB 47,390.0 5,938.0 8.0
Source: Worldscope, Thomson Financial.
Debt and
equivalents
EBITA
Debt-to-EBITA
0.2 0.4
1.6 2.0
2.9
3.7
4.8
8.0
0
2
4
6
8
10
Reckitt
Benckiser
plc
Beiersdorf
AG
L’Oreal SA Unilever
plc
Oriflame
Cosmetics
Henkel AG Givaudan
SA
Svenska
Cellulosa
AB
Debt-to-EBITA
European Household and Personal Care
Debt-to-EBITA, 2009