Valuation
Measuring and Managing the Value of Companies
5th Edition
Chapter 9 Solutions
Forecasting Performance
Version 1.0
April 1, 2010
Chapter 9
Question 1
Procter & Gamble
Annual report, 2009
Note 3
Supplemental financial information
Selected components of current and noncurrent liabilities were as
follows:
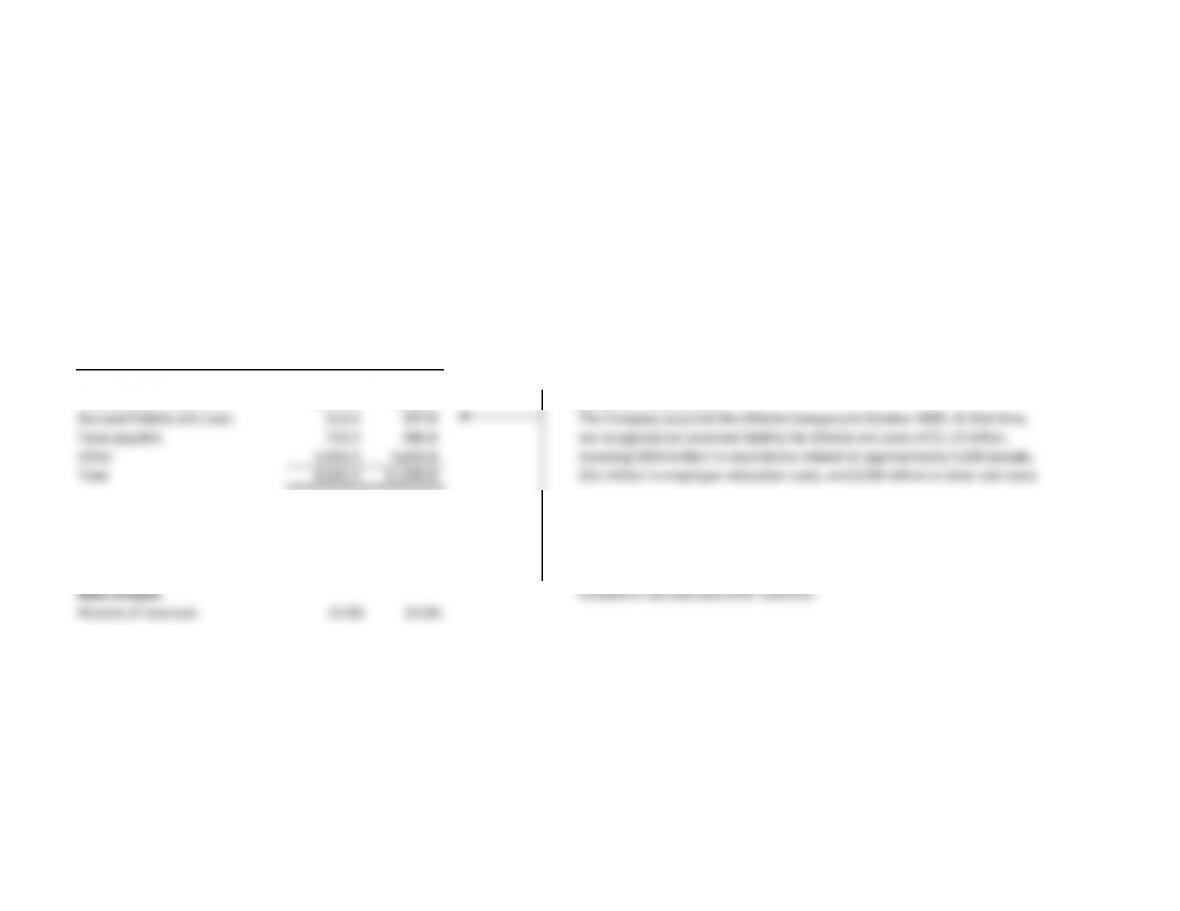
Accrued and other liabilities—current
2009 2008
Marketing and promotion 2,378.0 2,760.0
Compensation expenses 1,464.0 1,527.0 Based on a Web search:
Accrued Gillette exit costs 111.0 257.0
The Company acquired the Gillette Company in October 2005. At that time,
Taxes payable 722.0 945.0 we recognized an assumed liability for Gillette exit costs of $1.23 billion,
Other 3,926.0 5,610.0 including $854 million in separations related to approximately 5,500 people,
Total 8,601.0 11,099.0 $55 million in employee relocation costs, and $320 million in other exit costs.
Consolidated statements of earnings Gillette exit costs (primarily severance costs) are a restructuring charge and
Revenues 79,029.0 81,748.0 therefore should be treated as a debt equivalent. Debt equivalents should
not be forecasted within free cash flow, and therefore should not be
Ratio analysis included in accrued and other liabilities.
Percent of revenues 10.9% 13.6%
Chapter 9
Questions 2–4
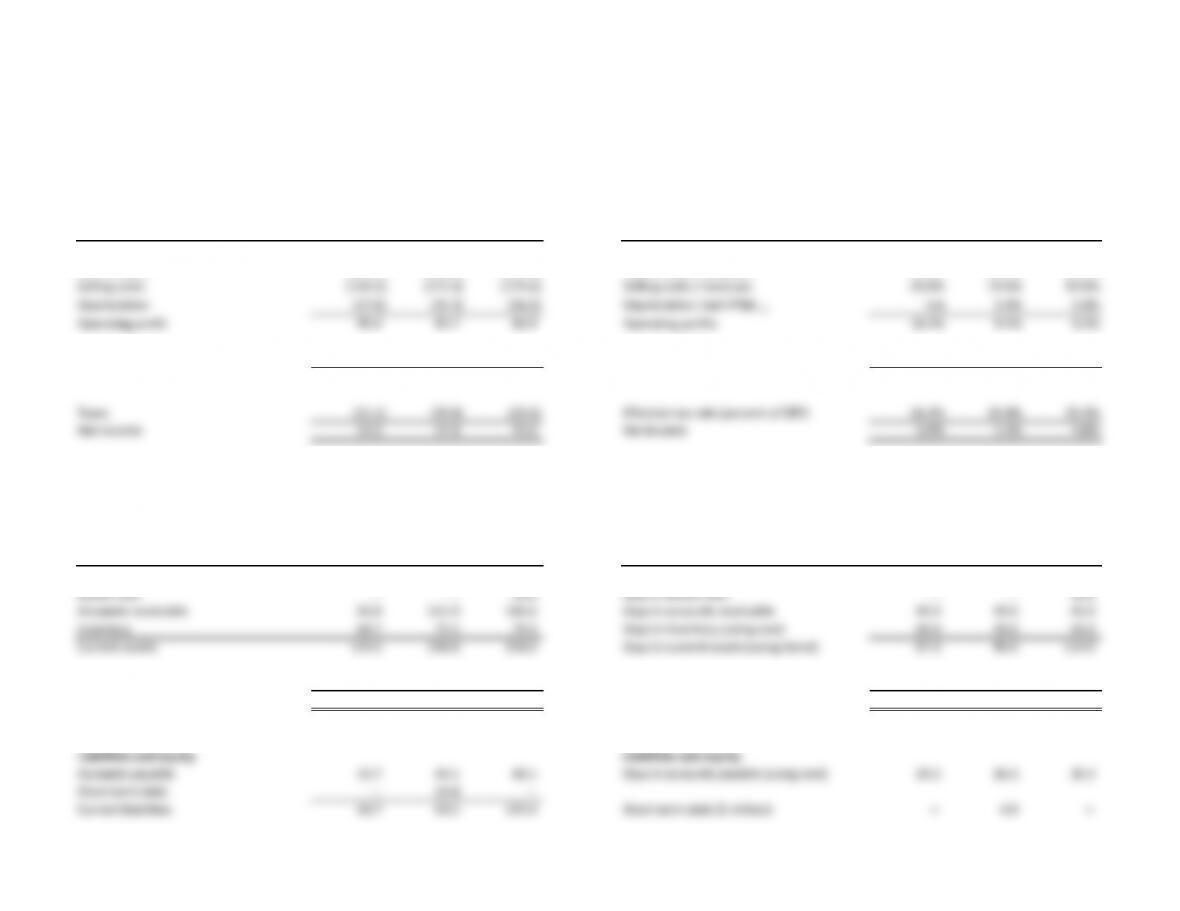
PartsCo PartsCo
Income statement Financial ratio analysis
Prior Current Forecast Prior Current Forecast
$ million year year year Percent of sales year year year
Revenues 782.6 900.0 945.0 Revenues n/a 15.0% 5.0%
Cost of sales (508.7) (612.0) (642.6) Cost of sales /revenues 65.0% 68.0% 68.0%
Selling costs (156.5) (171.0) (179.6) Selling costs / revenues 20.0% 19.0% 19.0%
Depreciation (27.0) (31.3) (36.0)
Depreciation / net PP&Et-1 n/a 5.0% 5.0%
Operating profit 90.4 85.7 86.9 Operating profits 11.5% 9.5% 9.2%
Interest (5.0) (7.5) (11.7) Interest (percent of prior debt) n/a 4.4% 4.4%
Earnings before taxes (EBT) 85.4 78.2 75.2 Earnings before taxes 10.9% 8.7% 8.0%
Taxes (31.1) (30.8) (29.6) Effective tax rate (percent of EBT) 36.4% 39.4% 39.4%
PartsCo PartsCo
Balance sheet Financial ratio analysis
Prior Current Forecast Prior Current Forecast
$ million year year year Days in revenue (or cost of sales) year year year
Working cash 15.0 12.3 12.9 Days in working cash 7.0 5.0 5.0
Excess cash – – 49.2 Days in excess cash – – 19.0
Accounts receivable 85.8 111.0 116.6 Days in accounts receivable 40.0 45.0 45.0
Inventory 69.7 75.5 79.3 Days in inventory (using cost) 50.0 45.0 45.0
Current assets 170.5 198.8 258.0 Days in current assets (using blend) 97.0 95.0 114.0
Property and equipment, net 626.1 720.0 756.0 Property and equipment / revenues 80.0% 80.0% 80.0%
Accounts payable 33.7 44.1 68.1 Days in accounts payable (using cost) 24.2 26.3 26.3
Short-term debt – 19.4 –
Current liabilities 33.7 63.5 147.4 Short-term debt ($ million) – 4.9 –
Long-term debt ($ million) 170.0 260.0 260.0
Long-term debt 170.0 215.0 260.0 Total debt 170.0 264.9 260.0
Shareholders’ equity 592.9 640.3 685.9
Liabilities and equity 796.6 918.8 1,093.2 Debt to equity (book) 28.7% 41.4% 37.9%
Chapter 9
Questions 2-4
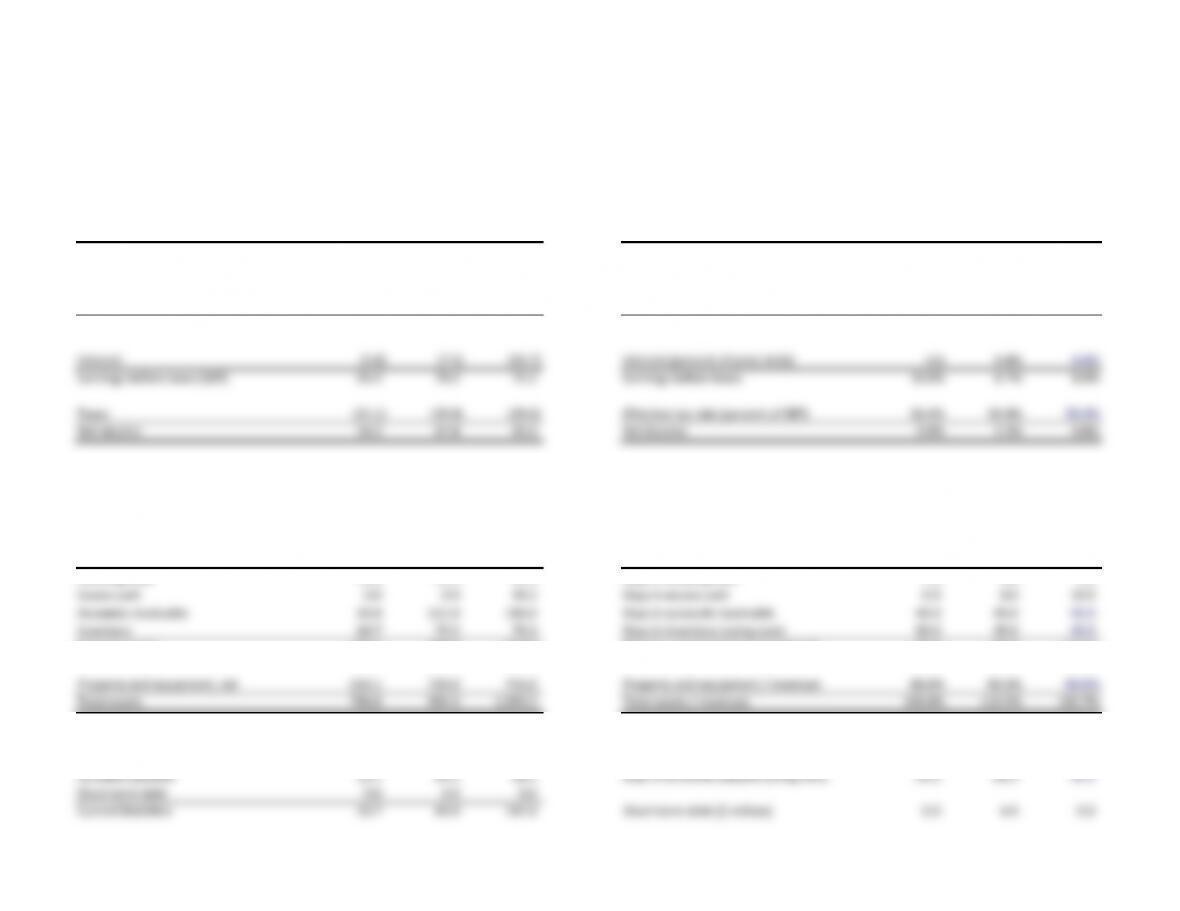
PartsCo PartsCo
Income statement Financial ratio analysis
Prior Current Forecast Prior Current Forecast
$ million Year Year Year Percent of sales Year Year Year
Revenues 782.6 900.0 945.0 Revenues n/a 15.0% 5.0%
Cost of sales (508.7) (612.0) (642.6) Cost of sales /revenues 65.0% 68.0% 68.0%
Selling costs (156.5) (171.0) (179.6) Selling costs / revenues 20.0% 19.0% 19.0%
Depreciation (27.0) (31.3) (36.0)
Depreciation / net PP&Et-1 n/a 5.0% 5.0%
Operating profits 90.4 85.7 86.9 Operating profits 11.5% 9.5% 9.2%
Interest (5.0) (7.5) (11.7) Interest (percent of prior debt) n/a 4.4% 4.4%
Earnings before taxes (EBT) 85.4 78.2 75.2 Earnings before taxes 10.9% 8.7% 8.0%
Taxes (31.1) (30.8) (29.6) Effective tax rate (percent of EBT) 36.4% 39.4% 39.4%
Net Income 54.3 47.4 45.6 Net Income 6.9% 5.3% 4.8%
PartsCo PartsCo
Balance sheet Financial ratio analysis
Prior Current Forecast Prior Current Forecast
$ million Year Year Year Days in revenue (or cost of sales) Year Year Year
Working cash 15.0 12.3 12.9 Days in working cash 7.0 5.0 5.0
Excess cash 0.0 0.0 49.2 Days in excess cash 0.0 0.0 19.0
Accounts receivable 85.8 111.0 116.6 Days in accounts receivable 40.0 45.0 45.0
Inventory 69.7 75.5 79.3 Days in inventory (using cost) 50.0 45.0 45.0
Current assets 170.5 198.8 258.0 Days in current assets (using blend) 97.0 95.0 114.0
Property and equipment, net 626.1 720.0 756.0 Property and equipment / revenues 80.0% 80.0% 80.0%
Total assets 796.6 994.3 1,093.2 Total assets / revenues 101.8% 110.5% 115.7%
Liabilities and equity Liabilities and equity
Accounts payable 33.7 44.1 68.1 Days in accounts payable (using cost) 24.2 26.3 26.3
Short-term debt 0.0 4.9 0.0
Current liabilities 33.7 49.0 147.4 Short-term debt ($ million) 0.0 4.9 0.0
Long-term debt ($ million) 170.0 260.0 260.0
Short-term debt 170.0 260.0 260.0 Total-debt 170.0 264.9 260.0
Shareholders’ equity 592.9 640.3 685.9
Liabilities and equity 796.6 949.3 1,093.2 Debt to equity (book) 28.7% 41.4% 37.9%
Chapter 9
Question 6
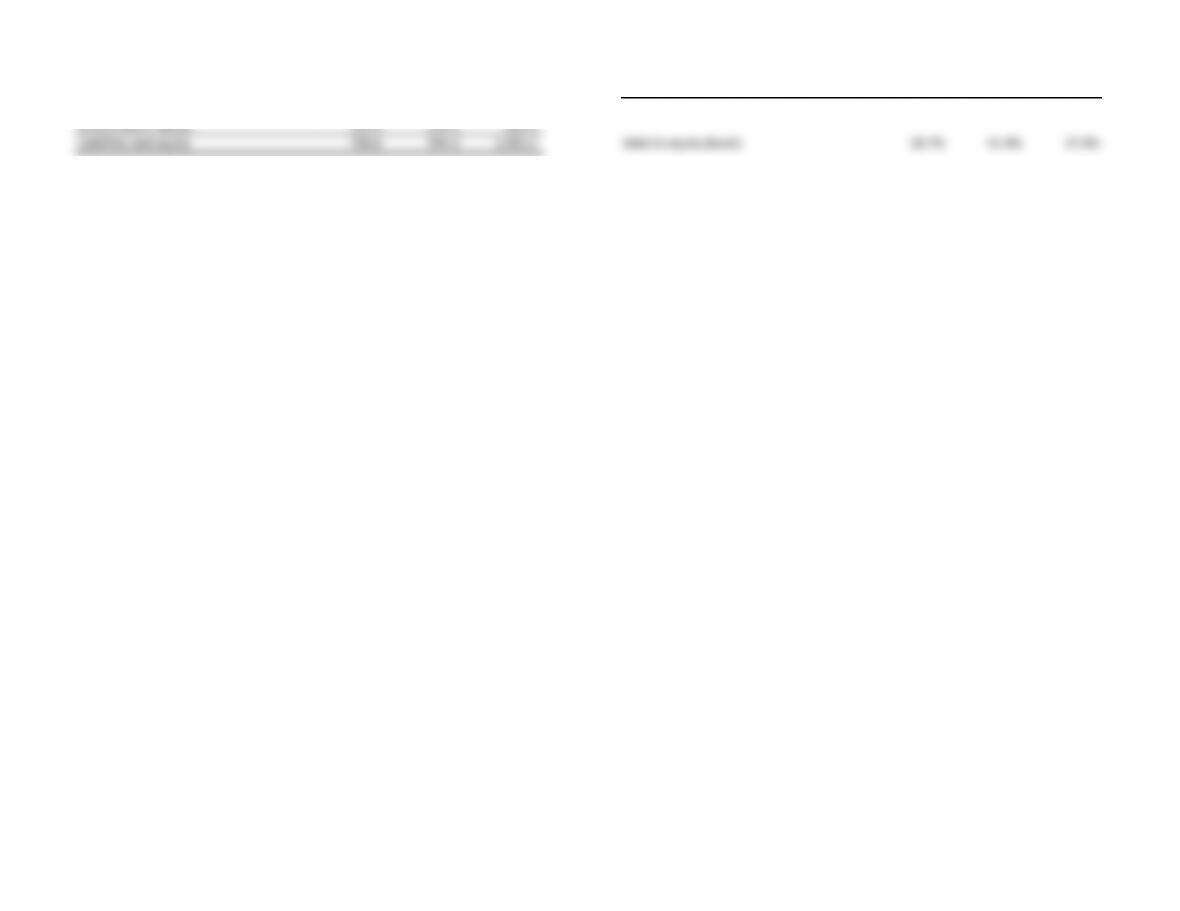
10-Year Treasury inflation-indexed security, constant maturity Implied inflation rate
Series ID: FII10 10-Year TIPS 1.4%
Source: Board of Governors of the Federal Reserve System 10-Year Treasury 3.7%
Release: H.15 Selected Interest Rates
Seasonal: Not applicable Implied inflation 2.3%
Frequency: Monthly
Units: Percent
Date range: 2003-01-01 to 2010-02-01
Last updated: 2010-03-02 9:31 AM CST
Notes: For further information regarding Treasury constant maturity data,
please refer to
www.federalreserve.gov/releases/h15/current/h15.pdf and
www.treas.gov/offices/domestic-finance/debt-management/interest-rate/index.html.
Date Value
2010-01-01 1.37
Source: http://research.stlouisfed.org/fred2/series/FII10/downloaddata?cid=115.
10-Year Treasury constant maturity rate
Series ID: GS10
Source: Board of Governors of the Federal Reserve System
Release: H.15 Selected Interest Rates
Seasonal Adjustment:
Not applicable
Frequency: Monthly
Units: Percent
Date Range: 1953-04-01 to 2010-02-01
Last Updated: 2010-03-02 9:31 AM CST
Notes: Averages of business days. For further information regarding Treasury
constant maturity data, please refer to
www.federalreserve.gov/releases/h15/current/h15.pdf and
www.treas.gov/offices/domestic-finance/debt-management/interest-rate/index.html.
Date Value
2010-01-01 3.73
Source: http://research.stlouisfed.org/fred2/series/GS10/downloaddata?cid=115.
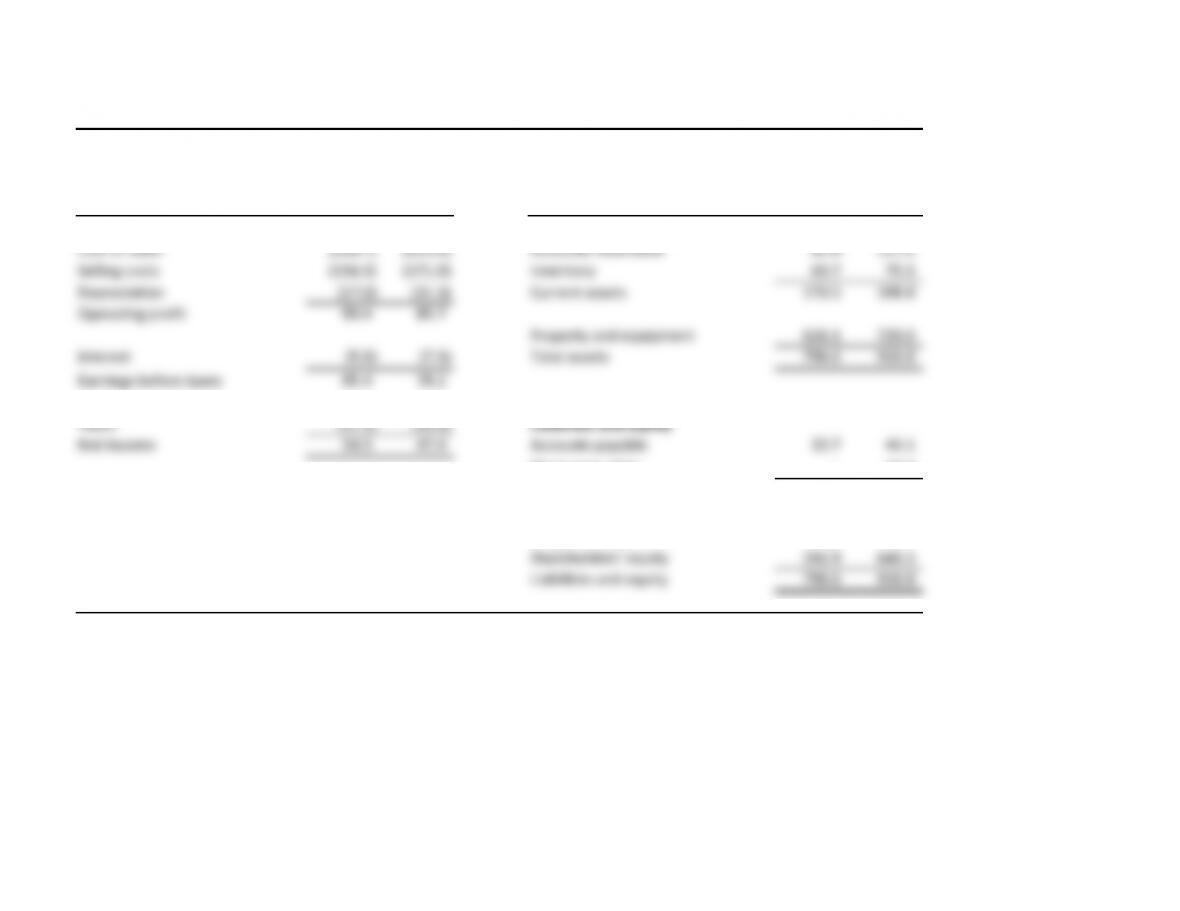
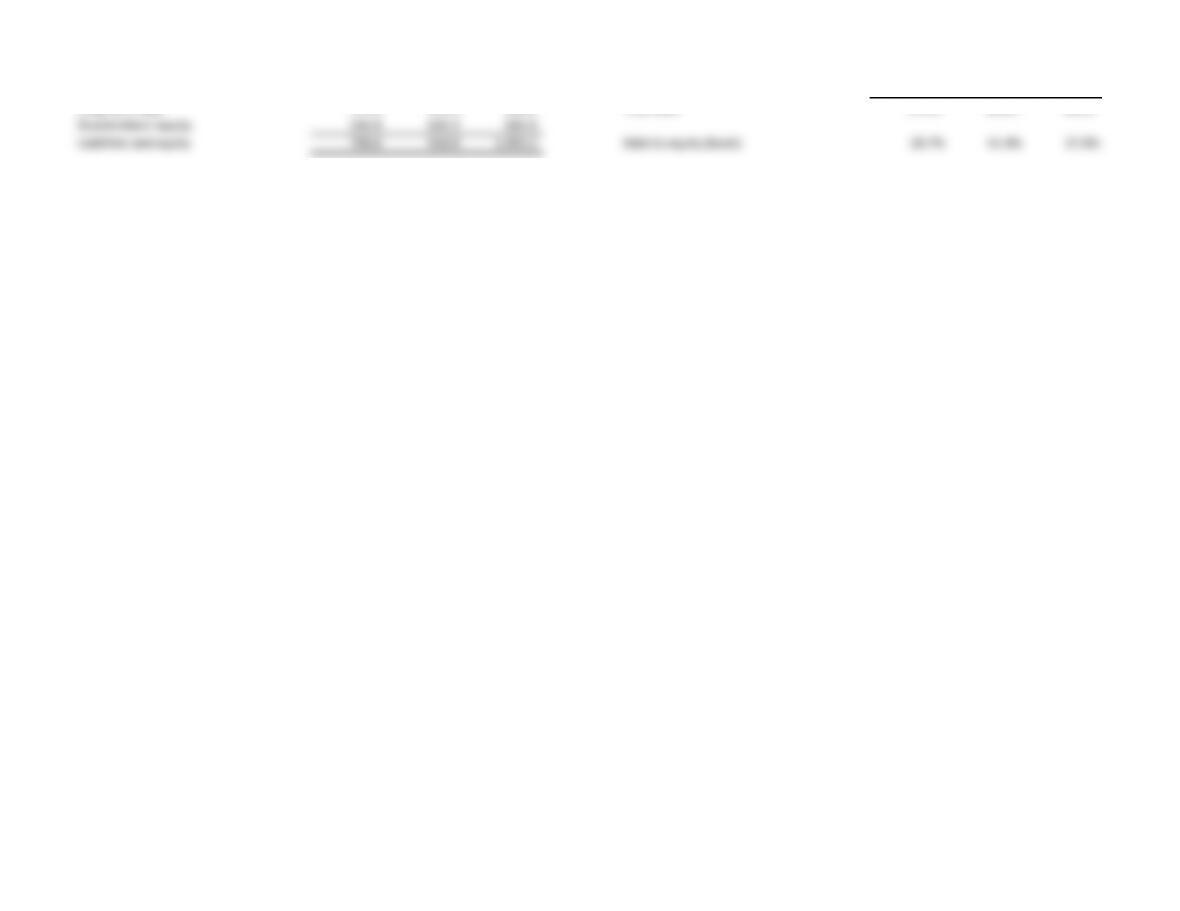
EXHIBIT 9.14 PartsCo: Consolidated Financial Statements
$ million
Prior Current Prior Current
Income statement year year Balance sheet year year
Revenues 782.6 900.0 Working cash 15.0 12.3
Cost of sales (508.7) (612.0) Accounts receivable 85.8 111.0
Selling costs (156.5) (171.0) Inventory 69.7 75.5
Depreciation (27.0) (31.3) Current assets 170.5 198.8
Operating profit 90.4 85.7
Property and equipment 626.1 720.0
Interest (5.0) (7.5) Total assets 796.6 918.8
Earnings before taxes 85.4 78.2
Taxes (31.1) (30.8) Liabilities and equity
Net income 54.3 47.4 Accounts payable 33.7 44.1
Short-term debt – 19.4
Current liabilities 33.7 63.5
Long-term debt 170.0 215.0
Shareholders’ equity 592.9 640.3
Liabilities and equity 796.6 918.8