Unlock document.
This document is partially blurred.
Unlock all pages and 1 million more documents.
Get Access
Valuation
Measuring and Managing the Value of Companies
5th Edition
Chapter 8 Solutions
Analyzing Performance and Competitive Position
Version 1.0
April 1, 2010
Chapter 8
Questions 1–3
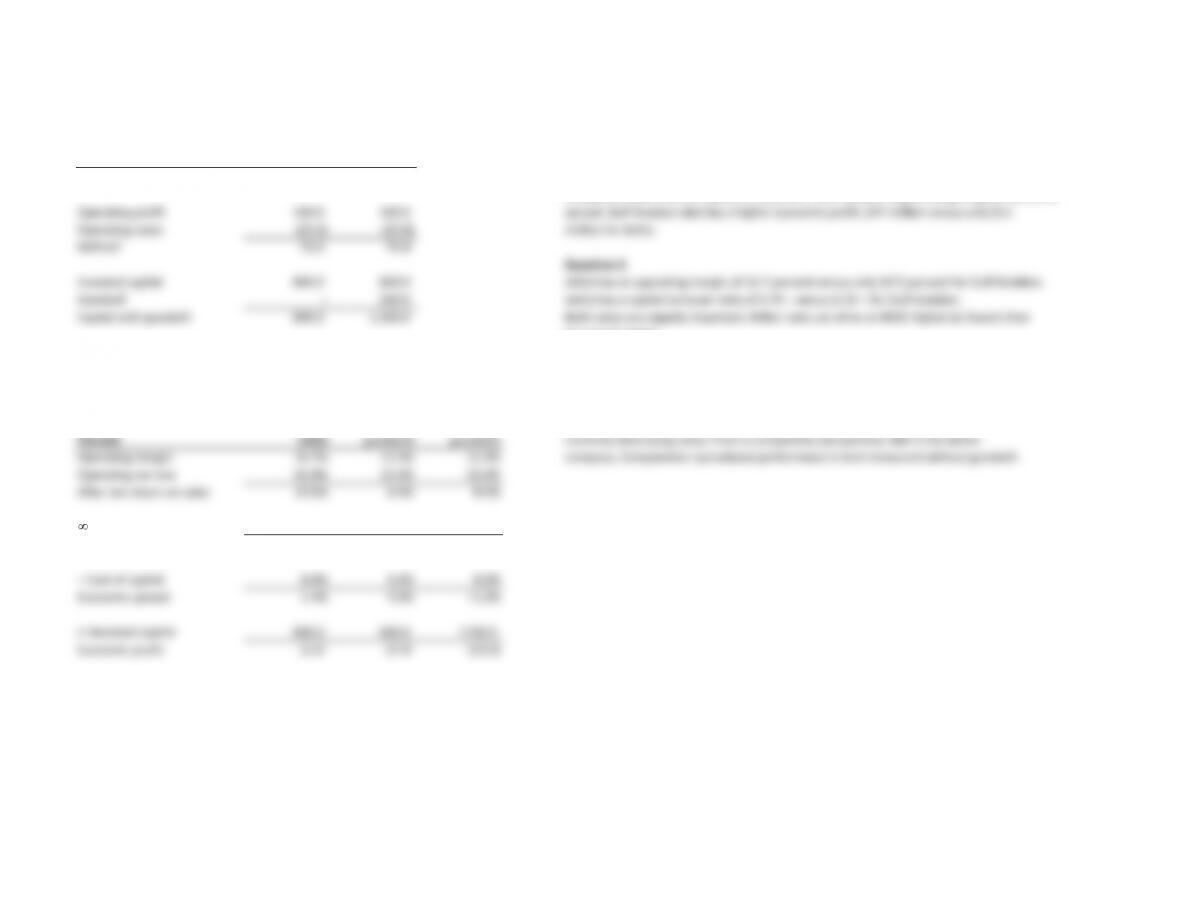
JetCo Gulf Question 1
Revenues 600.0 800.0 The ROIC of Gulf Aviation is 12.5 percent versus only 9.4 percent for JetCo. Since both
companies have a cost of capital of 8 percent, Gulf Aviation is generating a higher economic
Operating profit 100.0 100.0 spread. Gulf Aviation also has a higher economic profit, $27 million versus only $11
Operating taxes (25.0) (25.0) million for JetCo.
NOPLAT 75.0 75.0
Question 2
Invested capital 800.0 600.0 JetCo has an operating margin of 16.7 percent versus only 12.5 percent for Gulf Aviation.
Goodwill –500.0 JetCo has a capital turnover ratio of 0.75 – versus 1.33 – for Gulf Aviation.
Capital with goodwill 800.0 1,100.0 Both ratios are equally important. Either ratio can drive an ROIC higher (or lower) than
its cost of capital.
Competitive benchmarking Question 3
Key ratios To measure value creation post-acquisition, ROIC must be measured with goodwill.
Gulf Gulf With $500 million in new goodwill, ROIC drops from 12.5 percent to 6.8 percent.
(without (with Since this is below the company's 8 percent cost of capital, the acquisition is
Percent JetCo goodwill) goodwill)
currently destroying value. From a competitive perspective, Gulf is the better
Operating margin 16.7% 12.5% 12.5% company. Comparative operational performance is best measured without goodwill.
Operating tax rate 25.0% 25.0% 25.0%
After-tax return on sales 12.5% 9.4% 9.4%
Capital turnover 0.75 1.33 0.73
Return on capital 9.4% 12.5% 6.8%
– Cost of capital 8.0% 8.0% 8.0%
Economic spread 1.4% 4.5% –1.2%
Invested capital 800.0 600.0 1100.0
Economic profit 11.0 27.0 (13.0)
Key data
Tax rate 25%
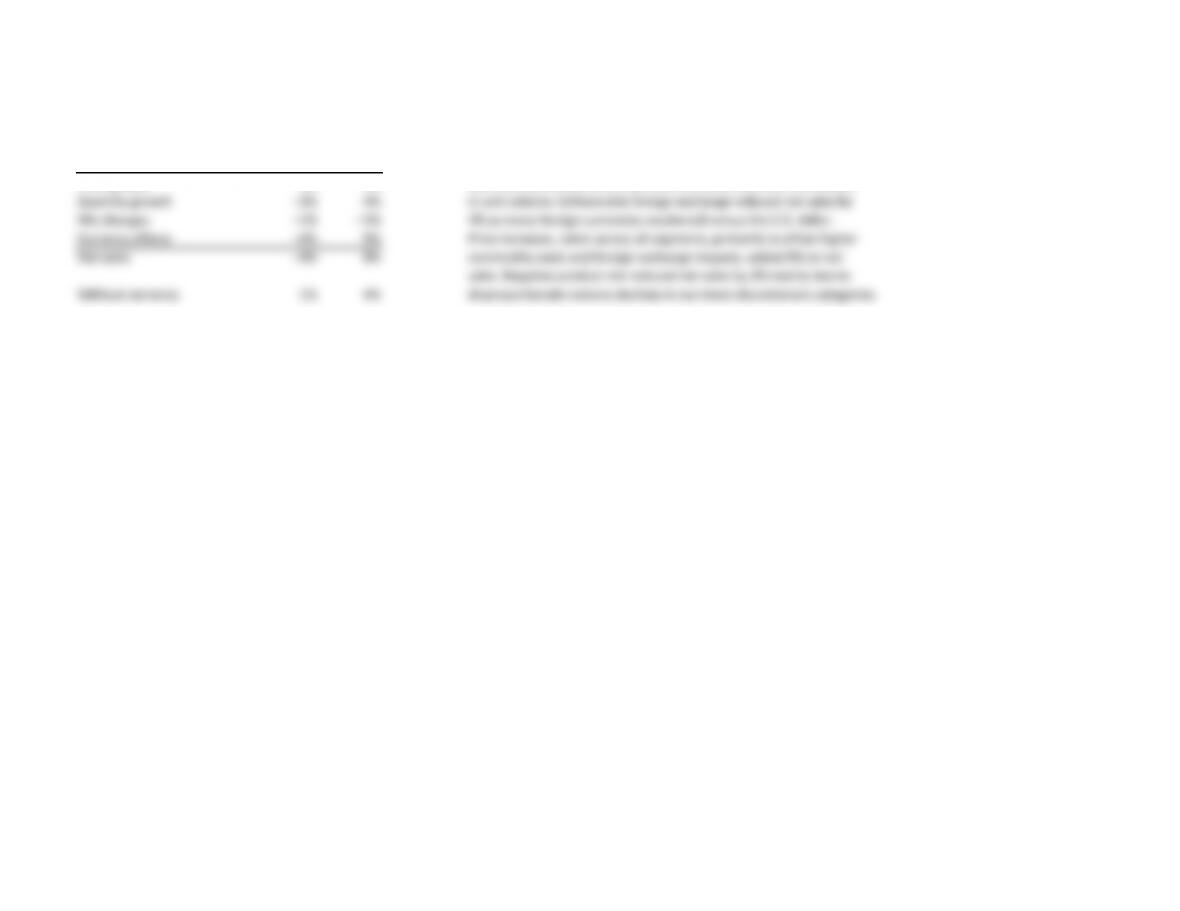
Chapter 8 Procter & Gamble
Question 5 Annual report, 2009
2008 2009 Procter & Gamble 2009
Price growth 5% 1% Net sales decreased 3% in 2009 to $79.0 billion behind a 3% decline
Quantity growth –3% 4% in unit volume. Unfavorable foreign exchange reduced net sales by
Mix changes –1% –1% 4% as many foreign currencies weakened versus the U.S. dollar.
Currency effects –4% 5% Price increases, taken across all segments, primarily to offset higher
Net sales –3% 9% commodity costs and foreign exchange impacts, added 5% to net
sales. Negative product mix reduced net sales by 1% mainly due to
Without currency 1% 4% disproportionate volume declines in our more discretionary categories.
Procter & Gamble 2008
Net sales increased 9% in 2008 to $81.7 billion behind 4% unit volume
growth, a favorable 5% foreign exchange impact and a positive 1%
pricing impact. Favorable foreign exchange resulted primarily from the
strengthening of European and other currencies relative to the U.S.
dollar. Price increases were taken across a number of our businesses
primarily to offset higher commodity costs. Mix had a negative 1%
impact on net sales primarily due to disproportionate growth in
developing regions, where selling prices are below the Company
average.
Source: www.pg.com/en_US/downloads/investors/annual_reports/2009/PG_2009_AnnualReport.pdf.
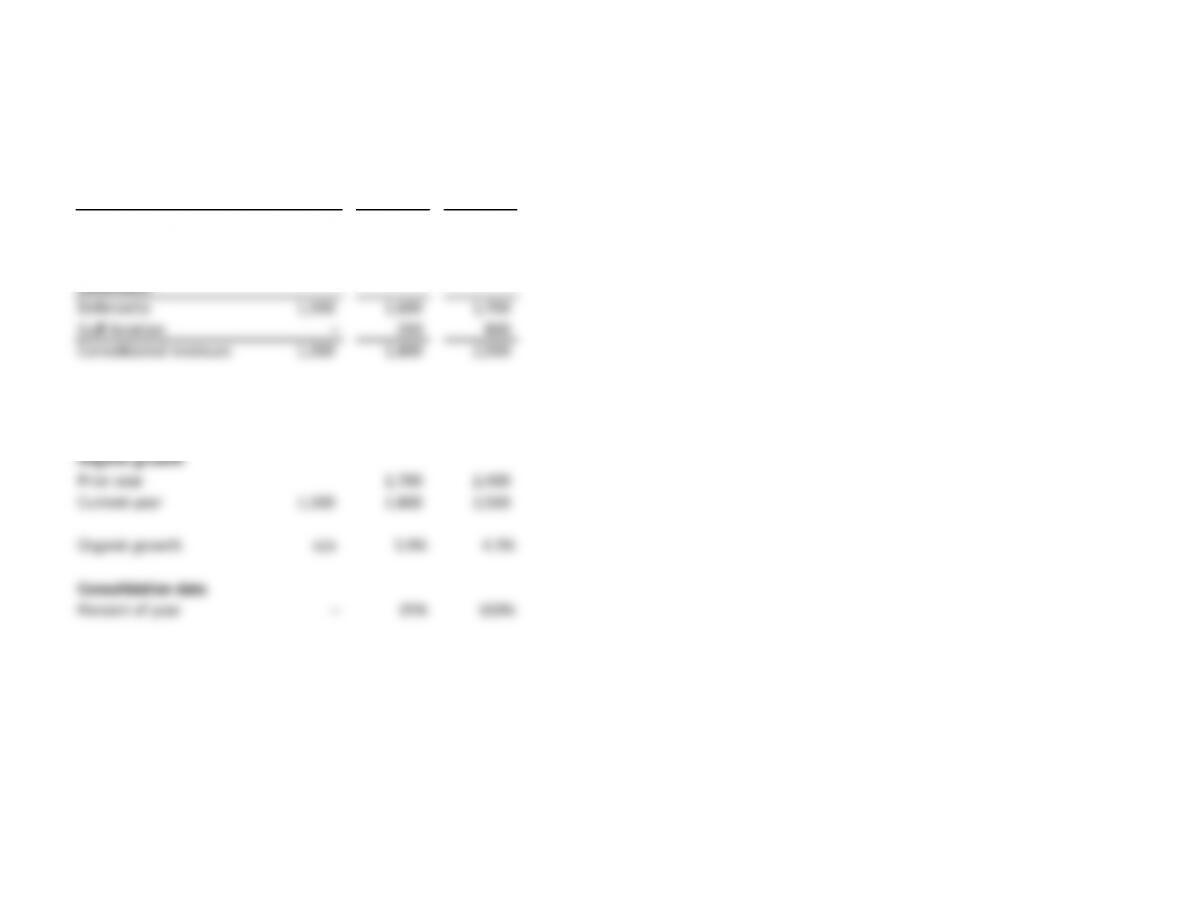
Chapter 8
Question 4
Gulf Aviation Year 1 Year 2 Year 3
Revenues 800 800 800
DefenseCo
DefenseCo 1,500 1,600 1,700
Gulf Aviation –200 800
Consolidated revenues 1,500 1,800 2,500
Consolidated growth n/a 20.0% 38.9%
Organic growth
Prior year 1,700 2,400
Current year 1,500 1,800 2,500
Organic growth n/a 5.9% 4.2%
Consolidation data
Percent of year –25% 100%
Chapter 8
Question 6
Since EBITA is less than EBITDA (EBITA = EBITDA – Depreciation), EBITA to interest will be less than EBITDA to interest.
If near-term bankruptcy is an issue, EBITDA can be used to meet interest obligations, and maintenance capital will
consequently fall to zero. Unless the company plans to wind down operations (such as an LBO of a faltering industry),
depreciation must eventually be reinvested to maintain operations. Therefore, EBITDA can be used to measure
survival only over the short term. Over the long term, EBITA is a better ratio.


