Valuation
Measuring and Managing the Value of Companies
5th Edition
Chapter 28 Solutions
Capitalized Expenses
Version 1.0
April 1, 2010
Chapter 28
Question 1
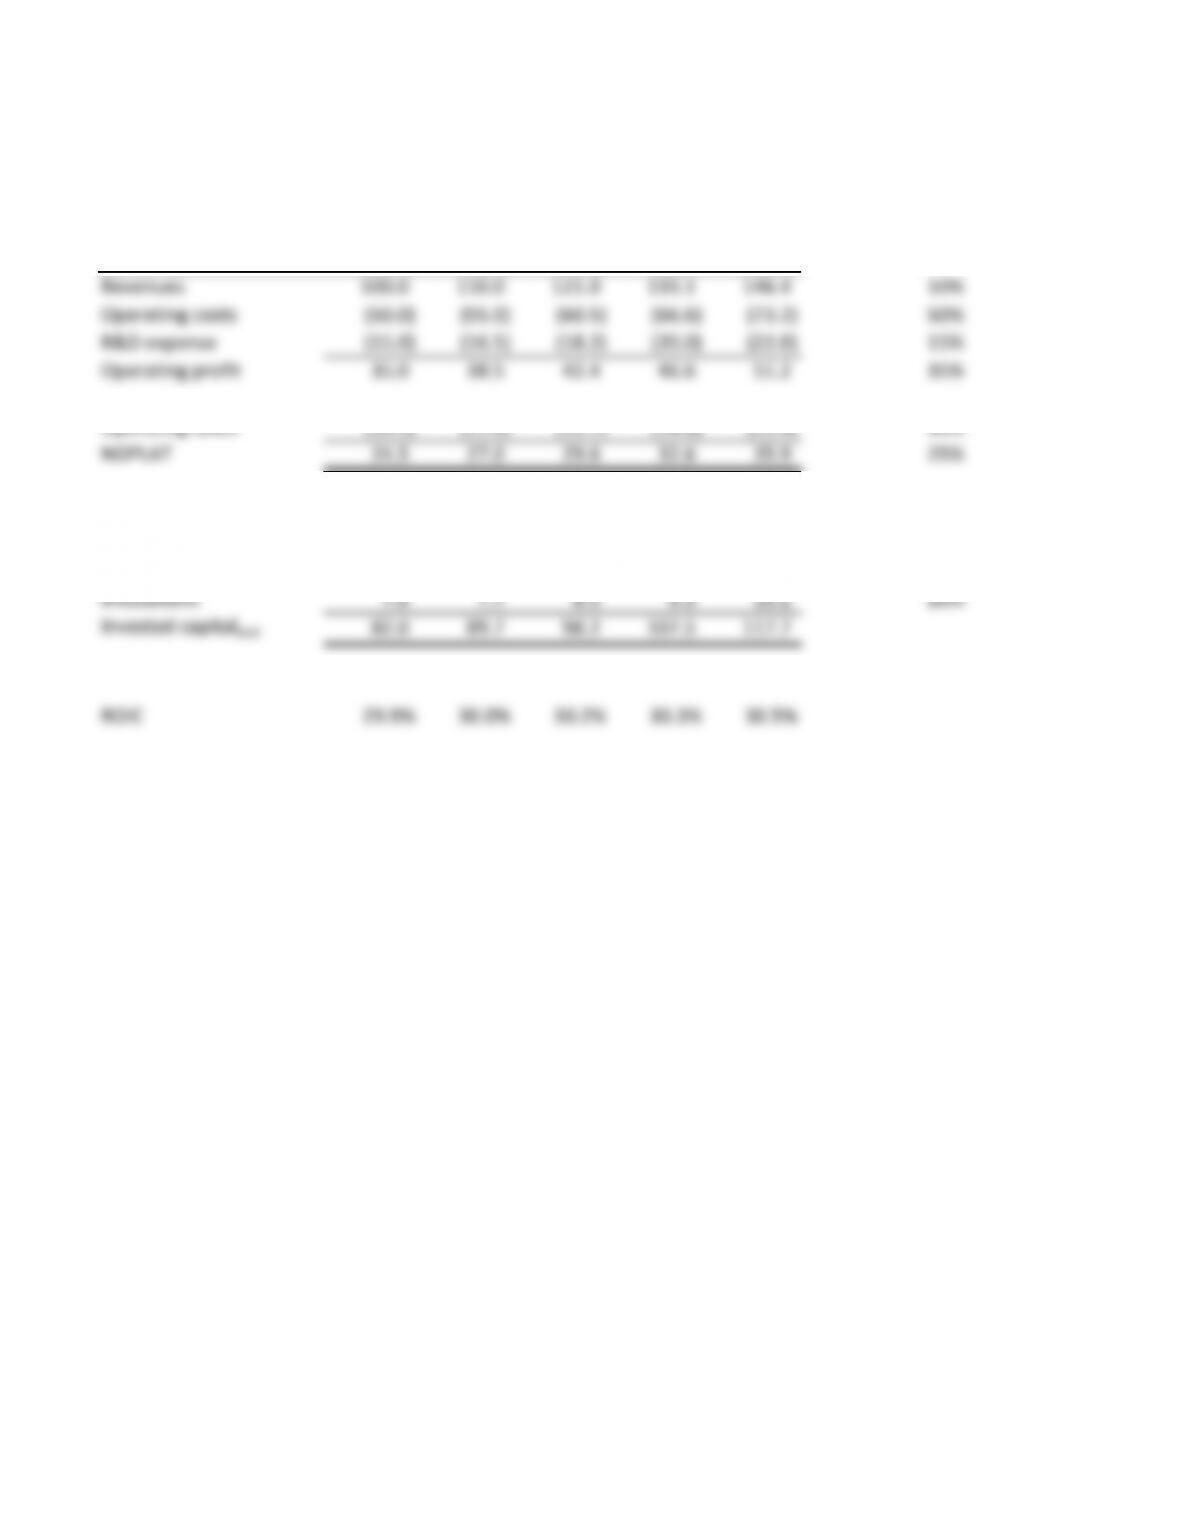
$ million Forecast
Year 1 Year 2 Year 3 Year 4 Year 5 Ratio
Revenues 100.0 110.0 121.0 133.1 146.4 10%
Operating costs (50.0) (55.0) (60.5) (66.6) (73.2) 50%
R&D expense (15.0) (16.5) (18.2) (20.0) (22.0) 15%
Operating profit 35.0 38.5 42.4 46.6 51.2 35%
Operating taxes (10.5) (11.6) (12.7) (14.0) (15.4) 30%
NOPLAT 24.5 27.0 29.6 32.6 35.9 25%
Invested capital
Invested capitalbeg 75.0 82.0 89.7 98.2 107.5
Investment 7.0 7.7 8.5 9.3 10.2 20%
Invested capitalend 82.0 89.7 98.2 107.5 117.7
ROIC 29.9% 30.0% 30.2% 30.3% 30.5%
Chapter 28
Question 2
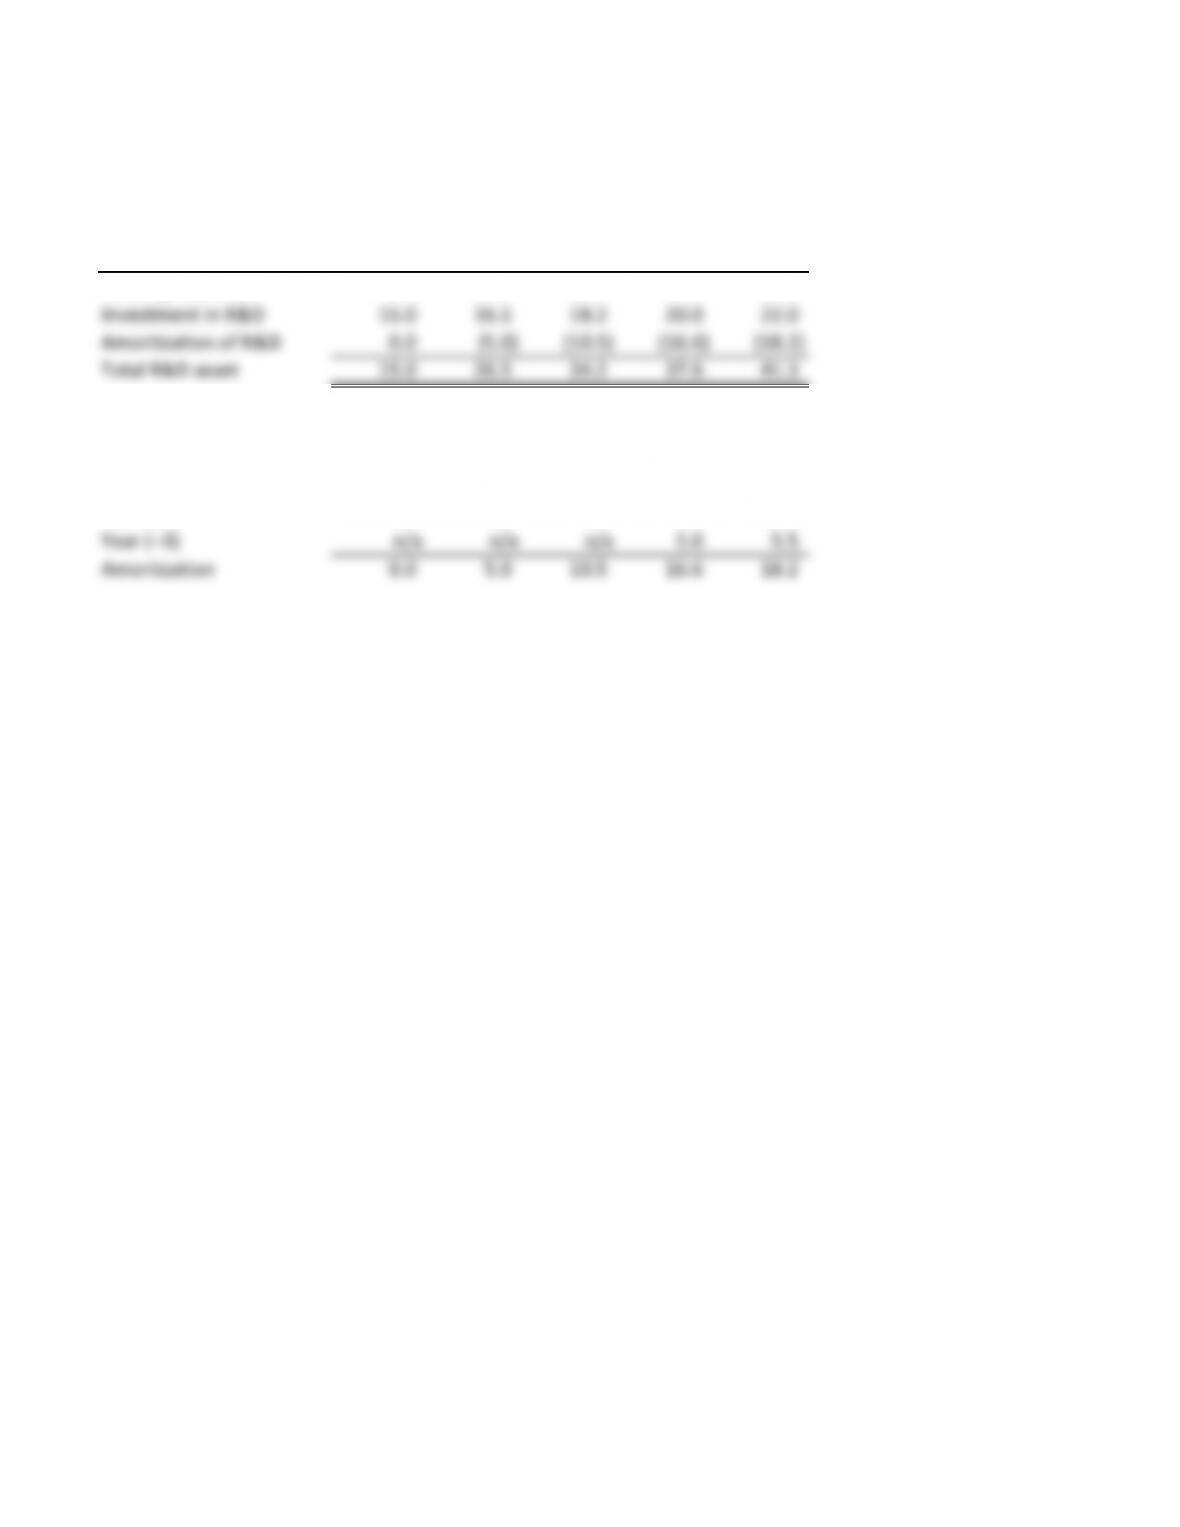
$ million
Year 1 Year 2 Year 3 Year 4 Year 5
Starting R&D asset 0.0 15.0 26.5 34.2 37.6
Investment in R&D 15.0 16.5 18.2 20.0 22.0
Amortization of R&D 0.0 (5.0) (10.5) (16.6) (18.2)
Total R&D asset 15.0 26.5 34.2 37.6 41.3
Amortization table
Year (–1) n/a 5.0 5.5 6.1 6.7
Year (–2) n/a n/a 5.0 5.5 6.1
Year (–3) n/a n/a n/a 5.0 5.5
Amortization 0.0 5.0 10.5 16.6 18.2
Chapter 28
Question 3
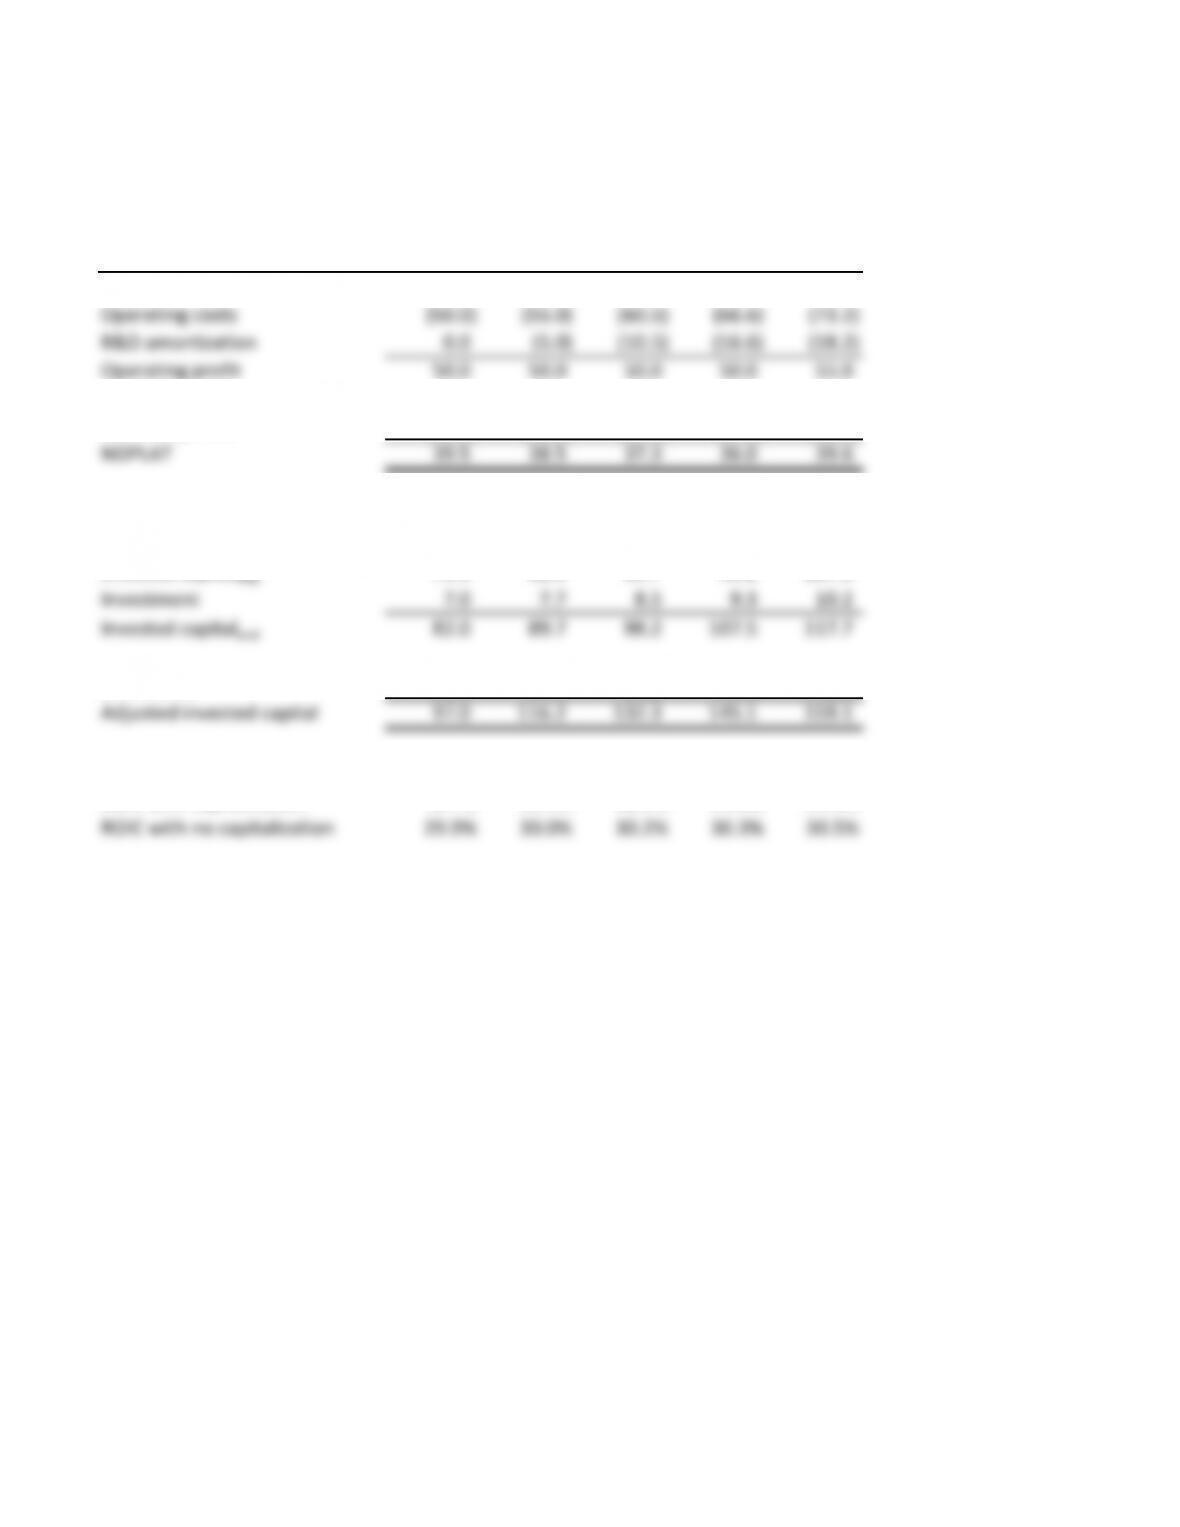
$ million
Year 1 Year 2 Year 3 Year 4 Year 5
Revenues 100.0 110.0 121.0 133.1 146.4
Operating costs (50.0) (55.0) (60.5) (66.6) (73.2)
R&D amortization 0.0 (5.0) (10.5) (16.6) (18.2)
Operating profit 50.0 50.0 50.0 50.0 55.0
Operating taxes (10.5) (11.6) (12.7) (14.0) (15.4)
NOPLAT 39.5 38.5 37.3 36.0 39.6
Invested capital
Invested capitalbeg 75.0 82.0 89.7 98.2 107.5
Investment 7.0 7.7 8.5 9.3 10.2
Invested capitalend 82.0 89.7 98.2 107.5 117.7
R&D assets 15.0 26.5 34.2 37.6 41.3
Adjusted invested capital 97.0 116.2 132.3 145.1 159.1
ROIC with capitalization 40.7% 33.1% 28.2% 24.8% 24.9%
ROIC with no capitalization 29.9% 30.0% 30.2% 30.3% 30.5%
Chapter 28
Question 4
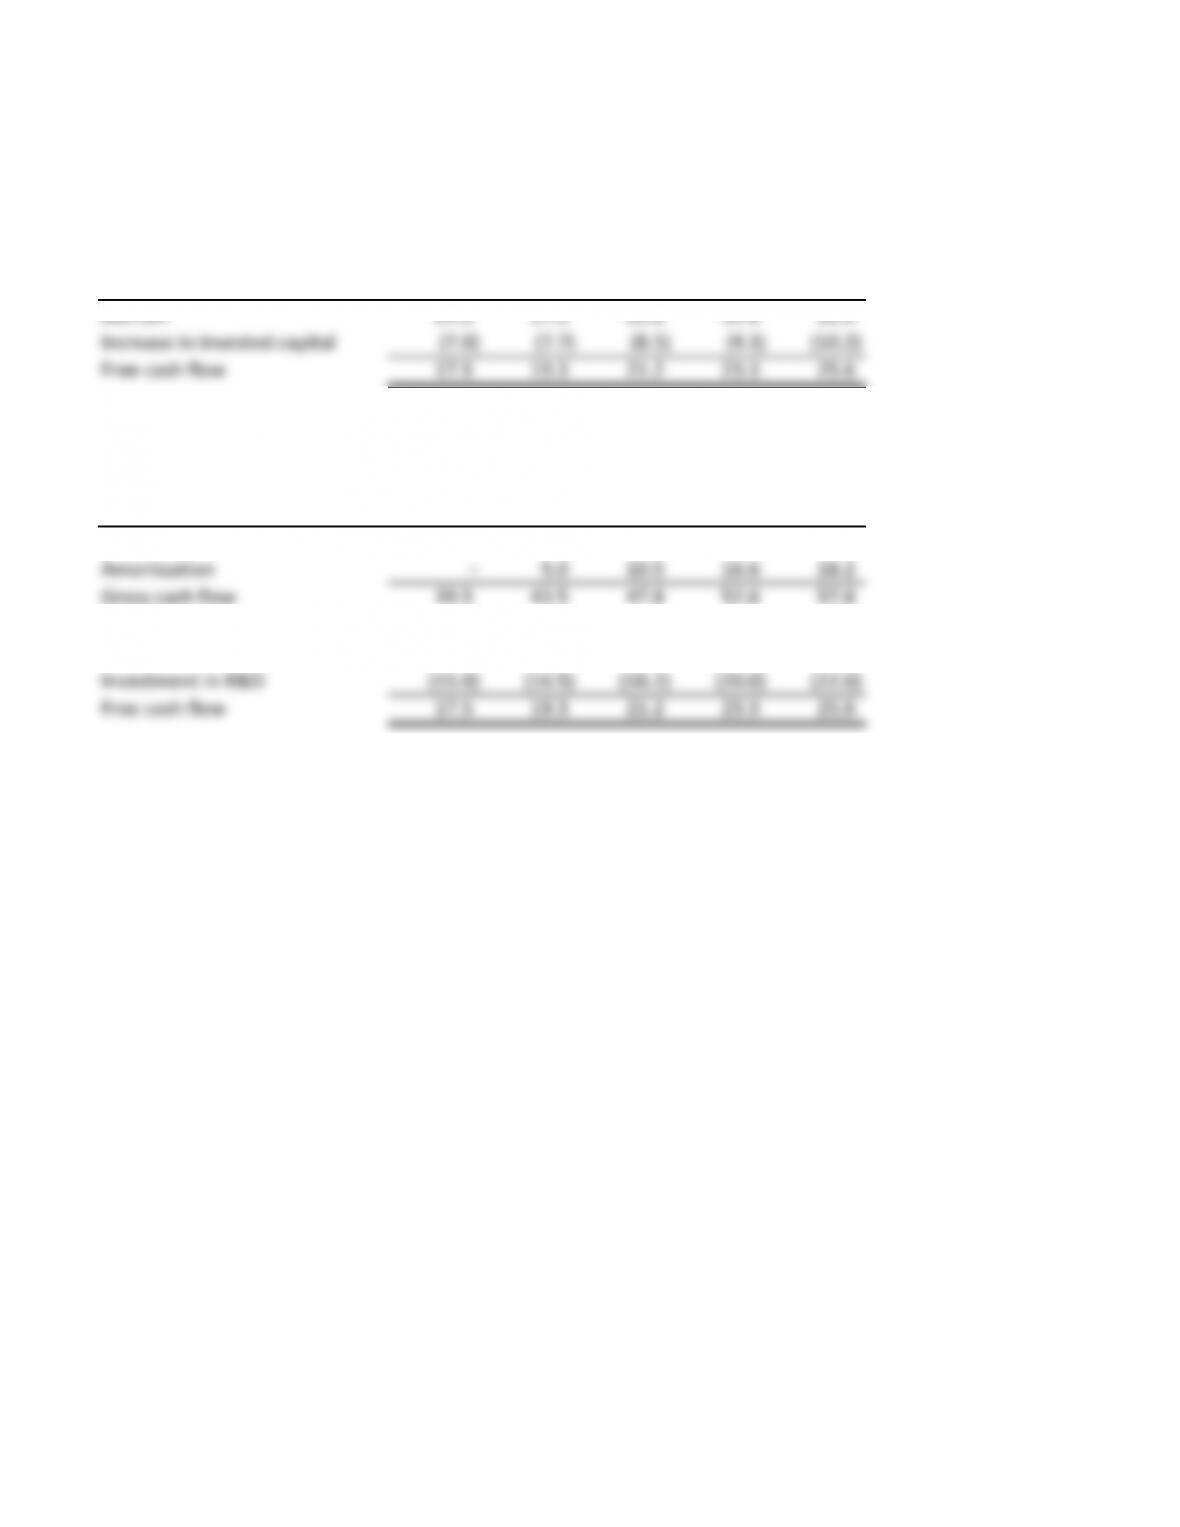
Free cash flow with R&D expense
Year 1 Year 2 Year 3 Year 4 Year 5
NOPLAT 24.5 27.0 29.6 32.6 35.9
Increase in invested capital (7.0) (7.7) (8.5) (9.3) (10.2)
Free cash flow 17.5 19.3 21.2 23.3 25.6
Free cash flow with R&D capitalized
Year 1 Year 2 Year 3 Year 4 Year 5
NOPLAT 39.5 38.5 37.3 36.0 39.6
Amortization –5.0 10.5 16.6 18.2
Gross cash flow 39.5 43.5 47.8 52.6 57.8
Increase in invested capital (7.0) (7.7) (8.5) (9.3) (10.2)
Investment in R&D (15.0) (16.5) (18.2) (20.0) (22.0)
Free cash flow 17.5 19.3 21.2 23.3 25.6