Valuation
Measuring and Managing the Value of Companies
5th Edition
Chapter 27 Solutions
Leases, Pensions, and Other Obligations
Version 1.0
April 1, 2010
Chapter 27
Questions 1 & 2
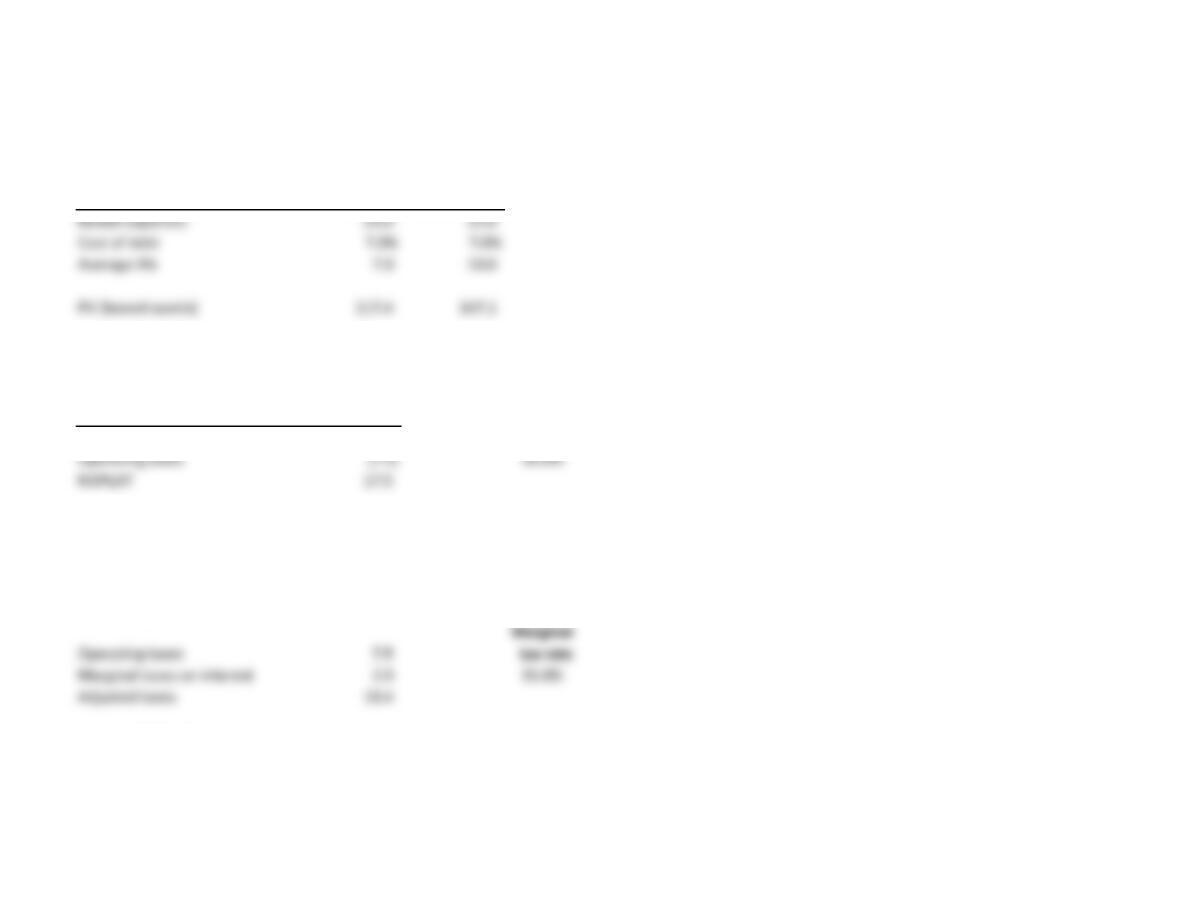
PV (leased assets) Correct Misestimation
Rental expenses 25.0 25.0
Cost of debt 7.0% 7.0%
Average life 7.0 10.0
PV (leased assets) 117.4 147.1
Question 2
NOPLAT Operating
Operating profit 25.0 tax rate
Operating taxes (7.5) 30.0%
NOPLAT 17.5
Adjusted profit
Operating profit 25.0
Lease interest 8.2
Adjusted profit 33.2
Marginal
Operating taxes 7.5 tax rate
Marginal taxes on interest 2.9 35.0%
Adjusted taxes 10.4
Adjusted NOPLAT 22.8
Chapter 27
Question 3
Commentary
Using the present value of reported rental expenses systematically undervalues the asset, since it ignores the residual value returned at
the end of the lease contract. As stated in the text, most would agree that a $1 million asset leased for two years is worth more than the
present value of two payments of $100,000 per year.
Chapter 27
Question 4
Commentary
The cost for securitizing receivables is included in either SG&A expense or interest expense. If the cost is included in interest expense,
then receivables must be securitized; otherwise the cost of securitization will not be captured in the valuation. If the cost is included
in SG&A, then the cost must be removed from SG&A for valuation purposes, if (and only if) receivables are securitized.
Chapter 27
Question 5
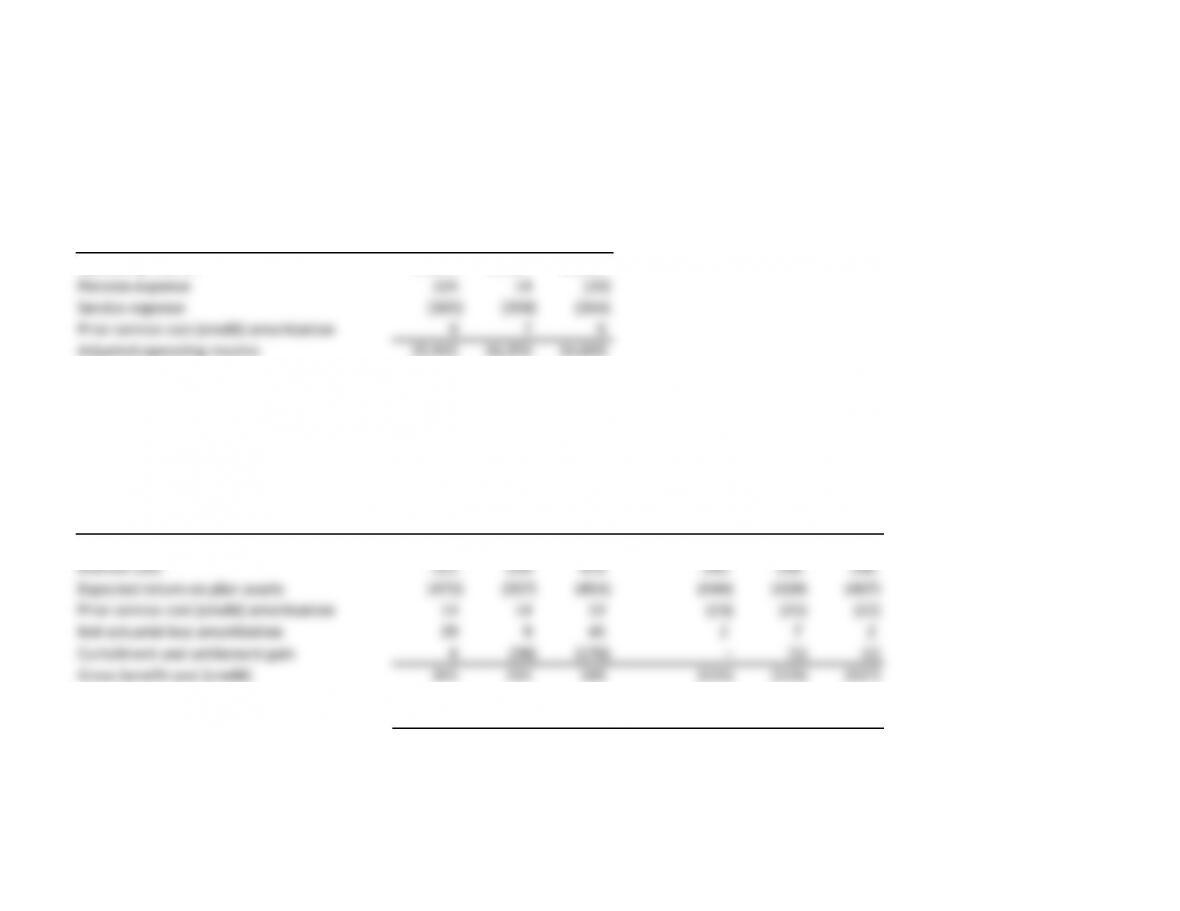
Procter & Gamble
Income statement
2009 2008 2007
Operating income 16,123 16,637 15,003
Pension expense 124 14 (39)
Service expense (305) (358) (364)
Prior service cost (credit) amortization 9 7 9
Adjusted operating income 15,942 16,293 14,600
Procter & Gamble, annual report, Note 8
Postretirement benefits and employee stock ownership plan
2009 2008 2007 2009 2008 2007
Service cost 214 263 279 91 95 85
Interest cost 551 539 476 243 226 206
Expected return on plan assets (473) (557) (454) (444) (429) (407)
Prior service cost (credit) amortization 14 14 13 (23) (21) (22)
Net actuarial loss amortization 29 945 2 7 2
Curtailment and settlement gain 6 (36) (176) –(1) (1)
Gross benefit cost (credit) 341 232 183 (131) (123) (137)
Dividends on ESOP preferred stock ––– (86) (95) (85)
Net periodic benefit cost (credit) 341 232 183 (217) (218) (222)
Other retiree benefits
Pension benefits
Source: www.pg.com/en_US/downloads/investors/annual_reports/2009/PG_2009_AnnualReport.pdf.
Chapter 27
Question 6
Commentary
P&G had more than $3.7 billion in unfunded pension benefits and $1.5 billion in unfunded other benefits in 2009.
Procter & Gamble
Annual report, 2009
Classification of net amount recognized
Other retiree benefits
Years ended June 30 2009 2008 2009 2008
Noncurrent assets 133.0 321.0 –200.0
Current liability (41.0) (45.0) (18.0) (16.0)
Noncurrent liability (3,798.0) (3,146.0) (1,516.0) (512.0)
Net amount recognized (3,706.0) (2,870.0) (1,534.0) (328.0)
For instance:
Other noncurrent liabilities, which totaled $9,249 million in 2009, included $3,798 million in unfunded pension liabilities and $1,516 million in unfunded other retiree benefits.
Source: www.pg.com/en_US/downloads/investors/annual_reports/2009/PG_2009_AnnualReport.pdf.
Pension benefits