Valuation
Measuring and Managing the Value of Companies
5th Edition
Chapter 14 Solutions
Using Multiples to Triangulate Results
Version 1.0
April 1, 2010
Chapter 14
Questions 1 & 2
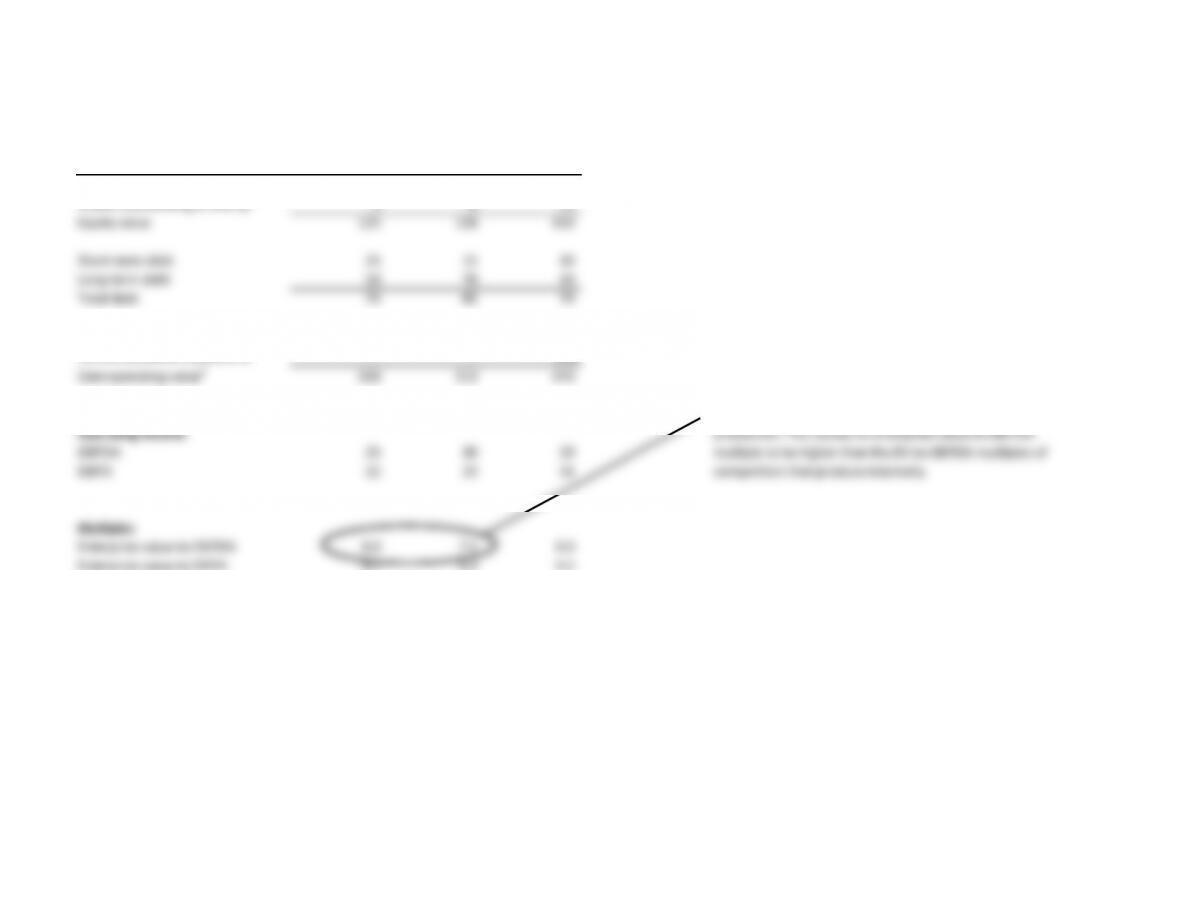
$ million Company 1 Company 2 Company 3
Share price ($) 25 16 30
Shares outstanding (millions) 5 8 15
Equity value 125 128 450
Short-term debt 25 15 30
Long-term debt 50 70 40
Total debt 75 85 70
Gross enterprise value 200 213 520
Nonconsolidated subsidiaries – – (50)
Core operating value1200 213 470
EBITDA will be lower for Company 1 if the company outsources
Operating income production. This causes its enterprise-value-to-EBITDA
EBITDA 25 30 59 multiple to be higher than the EV-to-EBITDA multiples of
EBITA 22 23 51 competitors that produce internally.
Multiples
Enterprise value to EBITDA 8.0 7.1 8.0
Enterprise value to EBITA 9.1 9.3 9.2
1 Also known as net enterprise value
Chapter 14
Questions 3 & 4
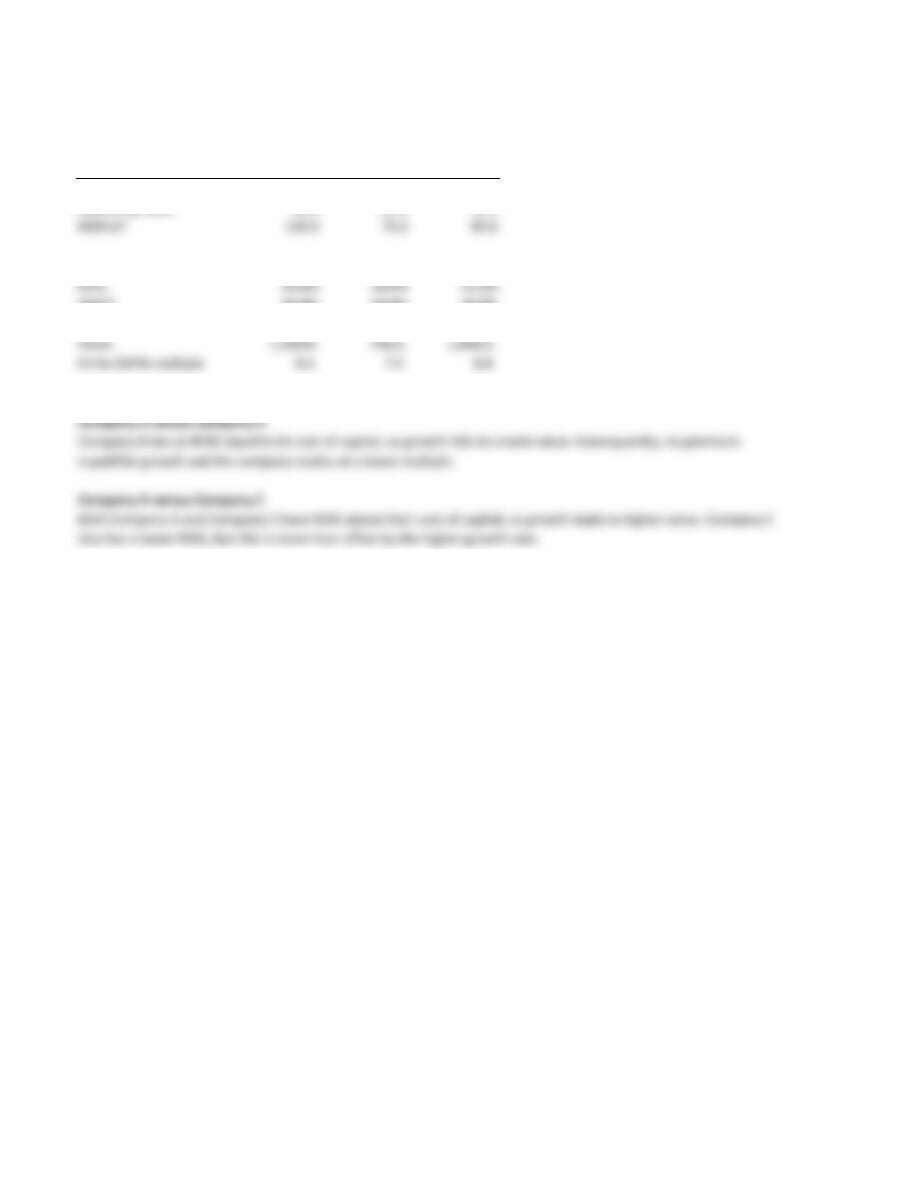
Driver Company A Company B Company C Other input
Operating profit 160.0 100.0 120.0 Tax rate 25%
Operating taxes 40.0 25.0 30.0
NOPLAT 120.0 75.0 90.0
Growth 2.0% 6.0% 5.0%
ROIC 15.0% 10.0% 12.0%
WACC 10.0% 10.0% 10.0%
Value 1,300.0 750.0 1,050.0
EV-to-EBITA multiple 8.1 7.5 8.8
Company A versus Company B
Company B has an ROIC equal to its cost of capital, so growth fails to create value. Consequently, no premium
is paid for growth and the company trades at a lower multiple.
Company A versus Company C
Both Company A and Company C have ROIC above their cost of capital, so growth leads to higher value. Company C
also has a lower ROIC, but this is more than offset by the higher growth rate.

Chapter 14
Question 5
If future cash flows (and the cost of capital) are the same for two companies, their valuations will be the same. If one
company has lower short-term earnings, then enterprise value to EBITA will be higher for that company since value
remains the same but earnings drop. This can make multiples analysis confusing. A higher multiple doesn’t always
mean better long-term prospects. It could just represent a short-term depression in earnings.

Chapter 14
Question 6
All
Income statement equity Levered Other inputs
Operating profit 80.0 80.0 Interest rate 5%
Interest expense – (20.0) Tax rate 25%
Earnings before taxes 80.0 60.0
Taxes (20.0) (15.0)
Net income 60.0 45.0
Enterprise value
Debt – 400.0
Market value of equity 900.0 500.0
Enterprise value 900.0 900.0
Price to earnings 15.0 11.1
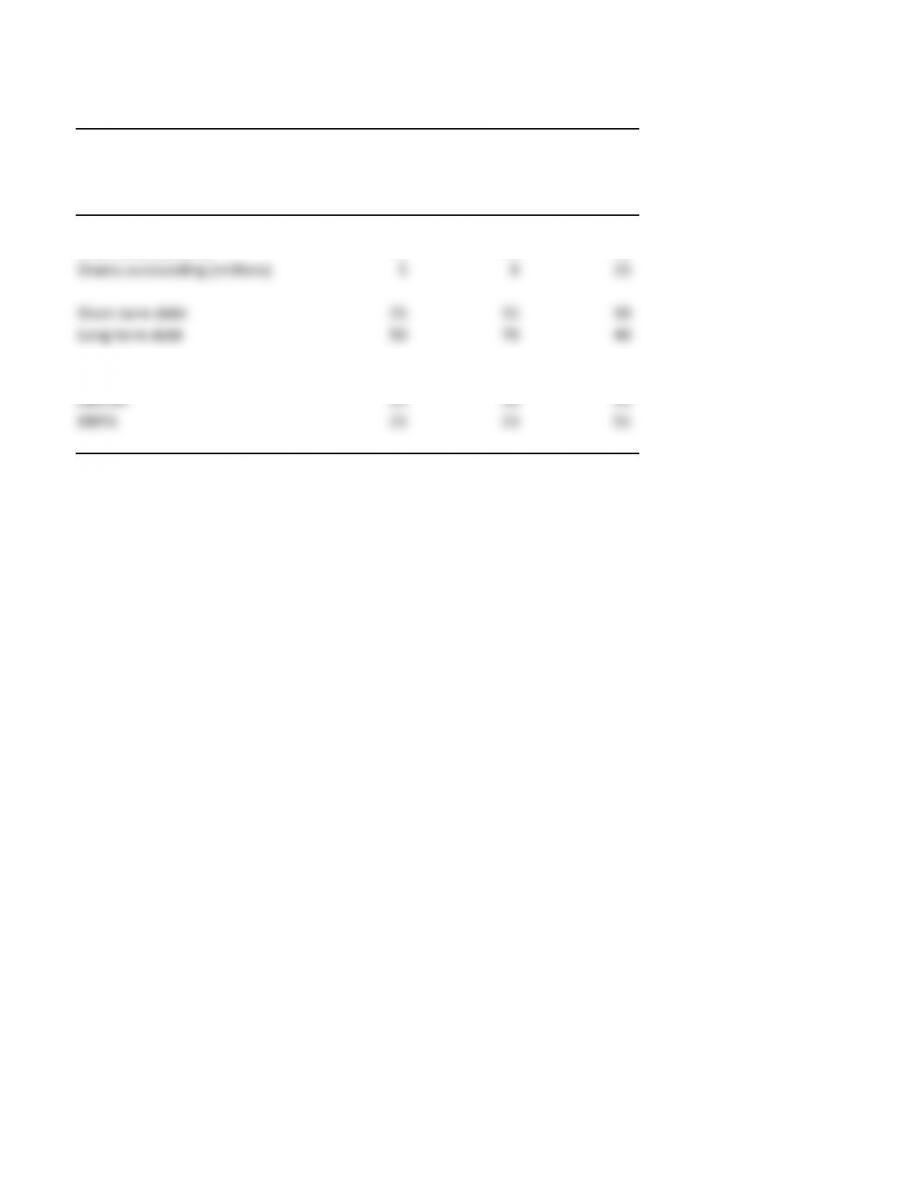
Exhibit 14.12 Multiples Analysis: Market and Profit Data
$ million
Company 1 Company 2 Company 3
Market data
Share price (dollars) 25 16 30
Shares outstanding (millions) 5 8 15
Short-term debt 25 15 30
Long-term debt 50 70 40
Operating profit
EBITDA 25 30 59
EBITA 22 23 51