Valuation
Measuring and Managing the Value of Companies
5th Edition
Chapter 13 Solutions
Calculating and Interpreting Results
Version 1.0
April 1, 2010
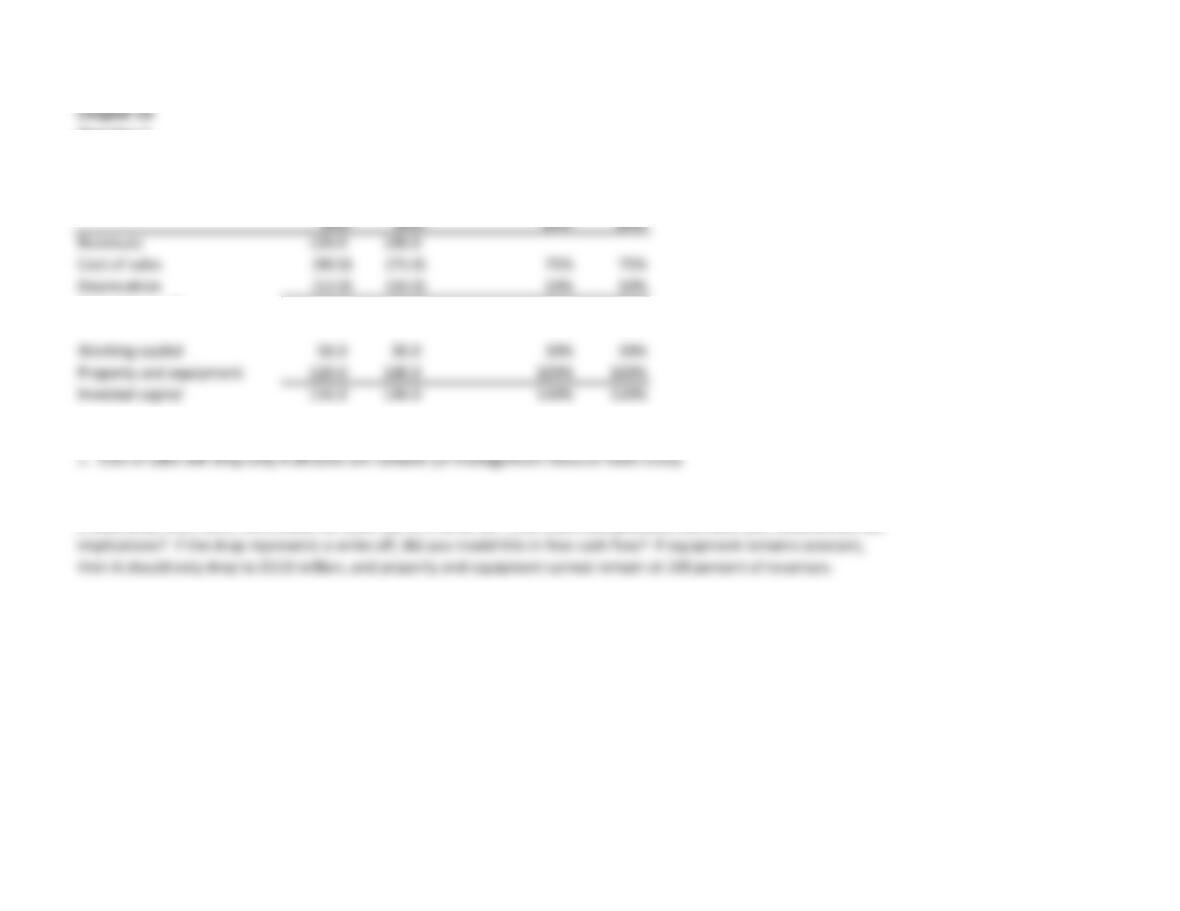
Chapter 13
Question 1
Percent of sales
Current Forecast Current Forecast
year year year year
Revenues 120.0 100.0
Cost of sales (90.0) (75.0) 75% 75%
Deprecation (12.0) (10.0) 10% 10%
Operating profit 18.0 15.0 15% 15%
Working capital 36.0 30.0 30% 30%
Property and equipment 120.0 100.0 100% 100%
Invested capital 156.0 130.0 130% 130%
1. Cost of sales will drop only if all costs are variable (or management reduces fixed costs).
2. The value of property and equipment drops $20 million. Since depreciation equals $10 million, the remaining $10
million drop must come from either an asset sale or a write-off. Is an asset sale plausible, and have you modeled the tax
implications? If the drop represents a write-off, did you model this in free cash flow? If equipment remains constant,
then it should only drop to $110 million, and property and equipment cannot remain at 100 percent of revenues.
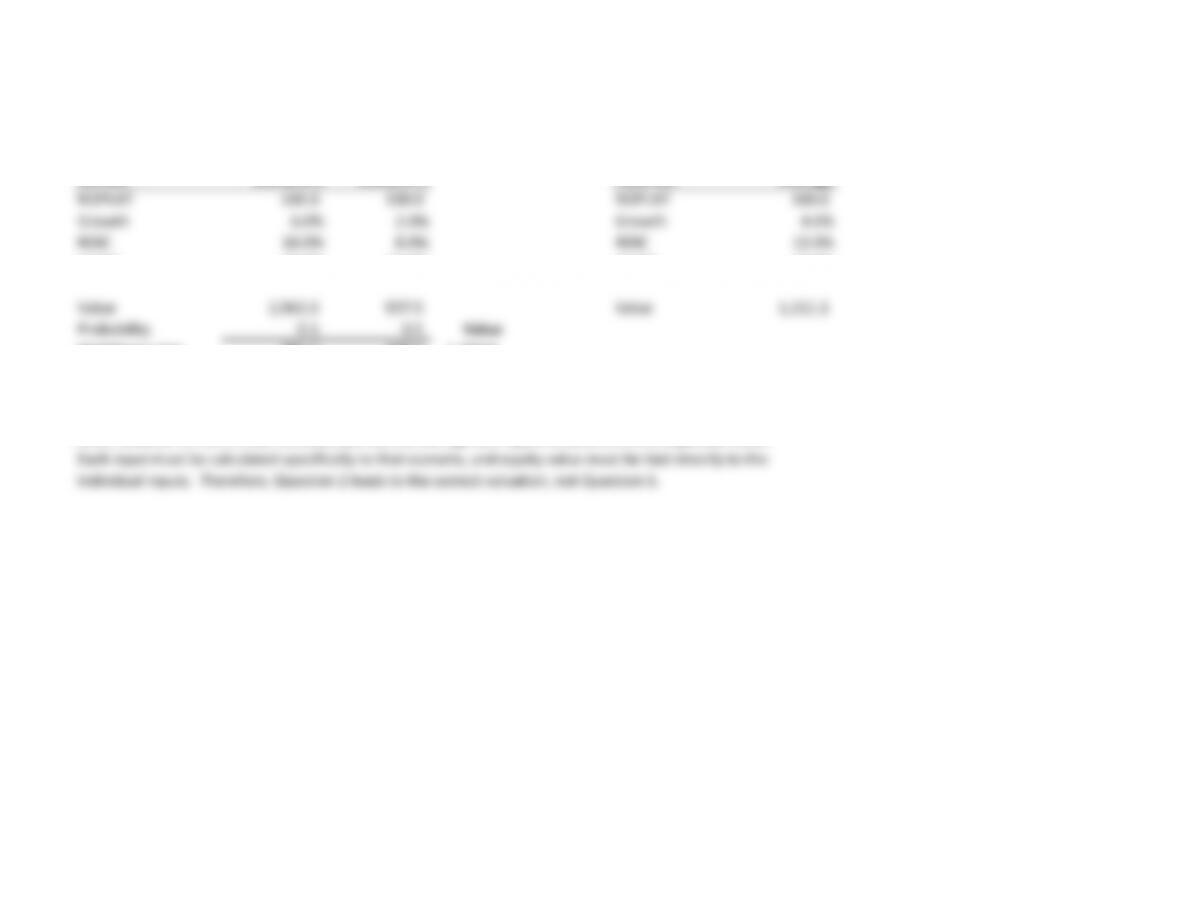
Chapter 13
Questions 2 & 3
Correct Scenario 1 Scenario 2 Incorrect Average
NOPLAT 100.0 100.0 NOPLAT 100.0
Growth 6.0% 2.0% Growth 4.0%
ROIC 16.0% 8.0% ROIC 12.0%
WACC 10.0% 10.0% WACC 10.0%
Value 1,562.5 937.5 Value 1,111.1
Probability 0.5 0.5 Value
Weighted value 781.3 468.8 1,250.0
Which is correct?
Since valuation is not a linear function, you cannot average the inputs to determine the expected value.
Each input must be calculated specifically to that scenario, and equity value must be tied directly to the
individual inputs. Therefore, Question 2 leads to the correct valuation, not Question 3.
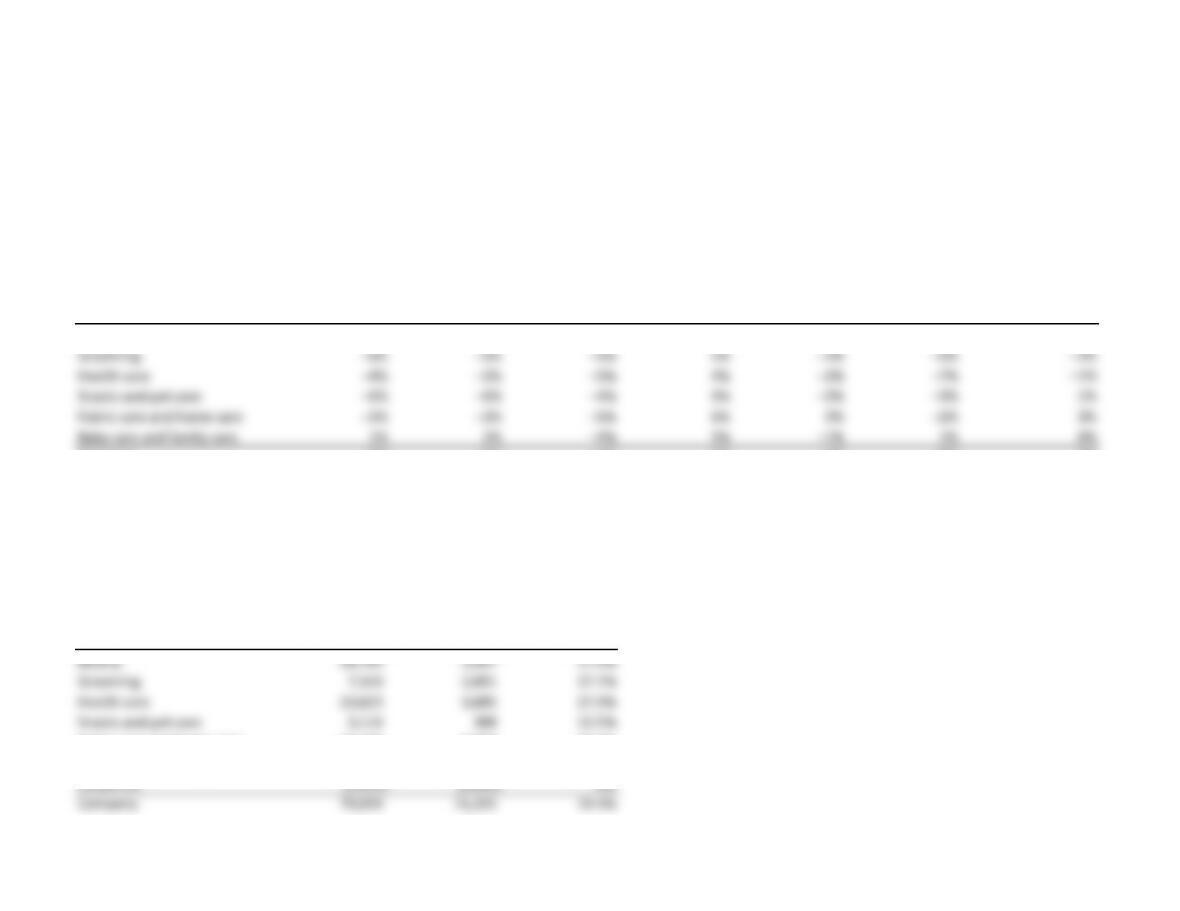
Chapter 13
Questions 4 & 5
Procter & Gamble annual report
Net sales change drivers vs. year ago (2009 vs. 2008)
Volume
Volume with excluding
acquisitions acquisitions Foreign Net sales Organic
Segment & divestitures & divestitures exchange Price Mix/other growth growth
Beauty –2% –1% –4% 2% 0% –4% 1%
Grooming –6% –5% –6% 5% –2% –9% –2%
Health care –4% –3% –5% 4% –2% –7% –1%
Snacks and pet care –6% –6% –4% 9% –2% –3% 1%
Fabric care and home care –3% –3% –5% 6% 0% –2% 3%
Baby care and family care 1% 2% –4% 5% –1% 1% 6%
Company –3% –2% –4% 5% –1% –3% 2%
Commentary
In 2009, baby care is outgrowing grooming. If this trend persists, a valuation based on the aggregate will not capture the different trends across segments.
Procter & Gamble annual report
$ million
Operating Operating
Segment Revenues profit margin
Beauty 18,789 3,367 17.9%
Grooming 7,543 2,091 27.7%
Health care 13,623 3,685 27.0%
Snacks and pet care 3,114 388 12.5%
Fabric care and home care 23,186 4,663 20.1%
Baby care and family care 14,103 2,827 20.0%
Corporate (1,329) (1,696) n/a
Company 79,029 15,325 19.4%
Commentary
Margins range from 12.5 percent to 27.7 percent, so valuations are likely to be quite different. Note how the lowest-growth segments have the highest
margins. Also, given how low the margins are for snacks and pet care, is the segment creating value? Estimates of ROIC are required!