Valuation
Measuring and Managing the Value of Companies
5th Edition
Chapter 12 Solutions
Moving from Enterprise Value to Value per share
Version 1.0
April 1, 2010
Chapter 12
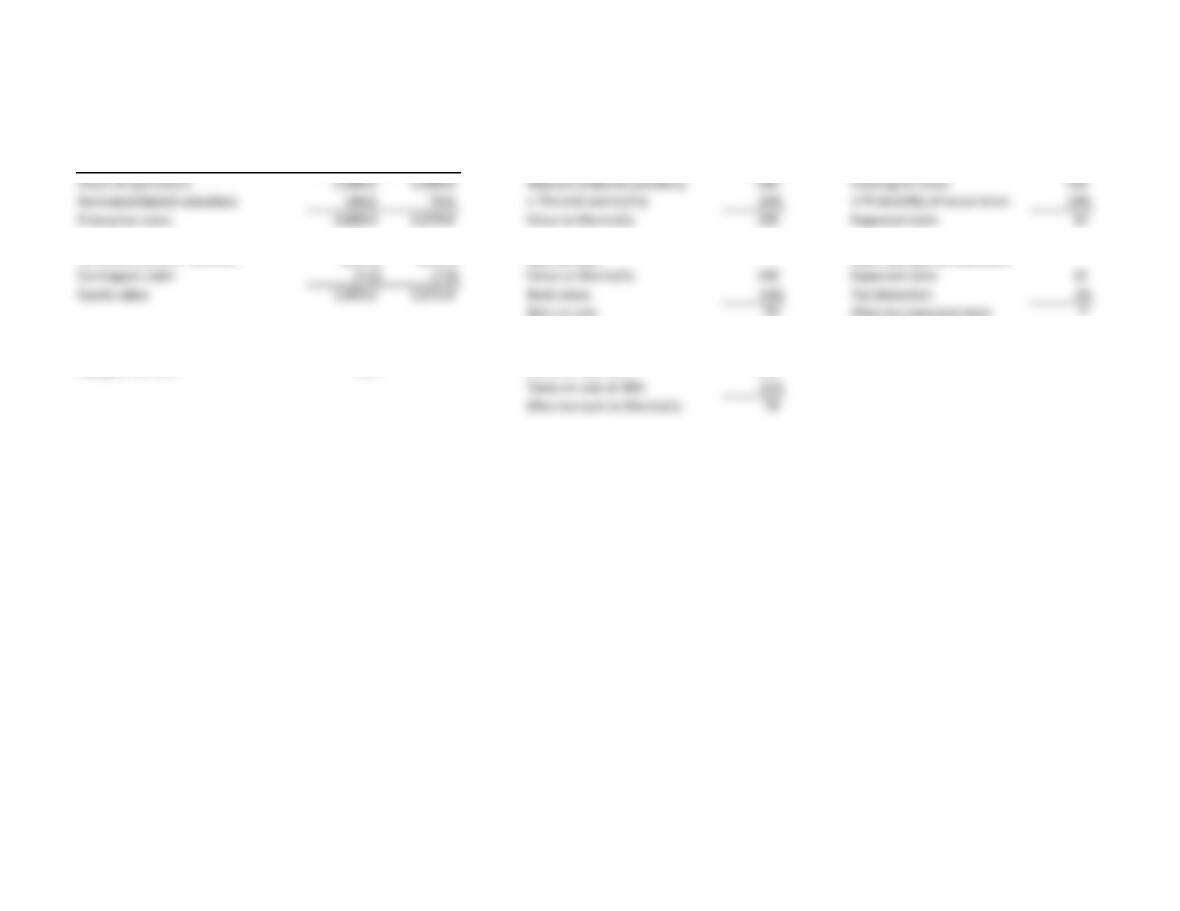
Questions 1 & 2 Question 1 Question 2
Valuation Sale No sale Nonconsolidated subsidiary Contingent claim
Value of operations 2,500.0 2,500.0 Nonconsolidated subsidiary 500 Contingent claim 100
Nonconsolidated subsidiary 100.0 79.0 Percent ownership 20% Probability of occurrence 10%
Enterprise value 2,600.0 2,579.0 Value to MarineCo 100 Expected claim 10
Unfunded pension liabilities (200.0) (200.0) Gain on sale After-tax cash to MarineCo
Contingent claim (7.0) (7.0) Value to MarineCo 100 Expected claim 10
Equity value 2,393.0 2,372.0 Book value (30) Tax deduction (3)
Gain on sale 70 After-tax expected claim 7
Key data After-tax cash to MarineCo
Marginal tax rate 30% Value to MarineCo 100
Taxes on sale at 30% (21)
After-tax cash to MarineCo 79

Chapter 12
Questions 3 & 4
Manufacturing subsidiary
Customer financing subsidiary
Operating profit Net income Key statistics
Sales of machinery 1,500 Revenues of financial products 400 Return on invested capital 9.5%
Cost of goods sold (1,000) Interest expense of financial products (350) Return on invested capital plus ROE 12.5%
Operating profit 500 Net income 50 Return on equity 21.4%
Reorganized balance sheet Reorganized balance sheet Interest rate to company 10.0%
Operating assets 2,200 Financial receivables 4,000 Interest rate on financing debt 9.7%
Operating liabilities (400)
Invested capital 1,800 Debt related to customer financing 3,600 Operating margin—machinery 27.3%
Allocated equity 400 Operating margin—finance 16.7%
General obligation debt – Liabilities and allocated equity 4,000
Allocated equity #VALUE!
Invested capital 1,800
Return on invested capital 27.8% Return on allocated equity 12.5%
Question 4
MarineCo’s financing subsidiary should be evaluated as a stand-alone entity. Since the subsidiary is owned by a company with other assets (the
manufacturing business), MarineCo could use the manufacturing business as collateral for the finance subsidiary’s debt. In the extreme, a lender
could lend 100 percent of financial receivables as long as additional collateral is pledged, causing allocated equity to equal zero. A pure-play bank
could never raise 100 percent debt. In this case, MarineCo’s equity is understated and ROE is too high.
Chapter 12
Question 5
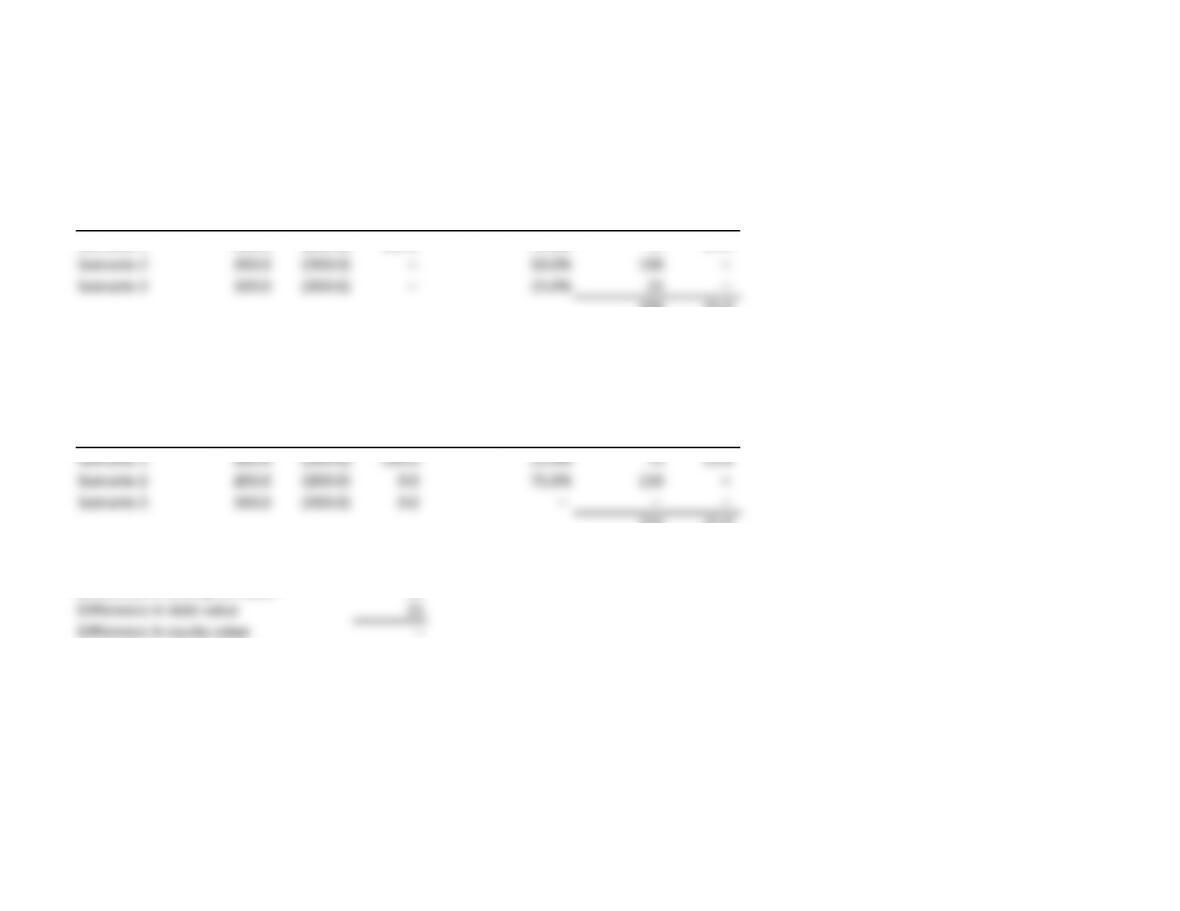
Weighted Weighted
Enterprise Debt Equity enterprise equity
Scenario value value value Probability value value
Scenario 1 300.0 (200.0) 100.0 25.0% 75 25.0
Scenario 2 200.0 (200.0) – 50.0% 100 –
Scenario 3 100.0 (200.0) – 25.0% 25 –
200 25.0
New management plan
Weighted Weighted
Enterprise Debt Equity enterprise equity
Scenario value value value Probability value value
Scenario 1 300.0 (200.0) 100.0 25.0% 75 25.0
Scenario 2 200.0 (200.0) 0.0 75.0% 150 –
Scenario 3 100.0 (200.0) 0.0 – – –
225 25.0
Difference in enterprise value
25
Difference in debt value 25
Difference in equity value –
The entire value increase accrues to the debt holder, a common problem with distressed companies.
Chapter 12
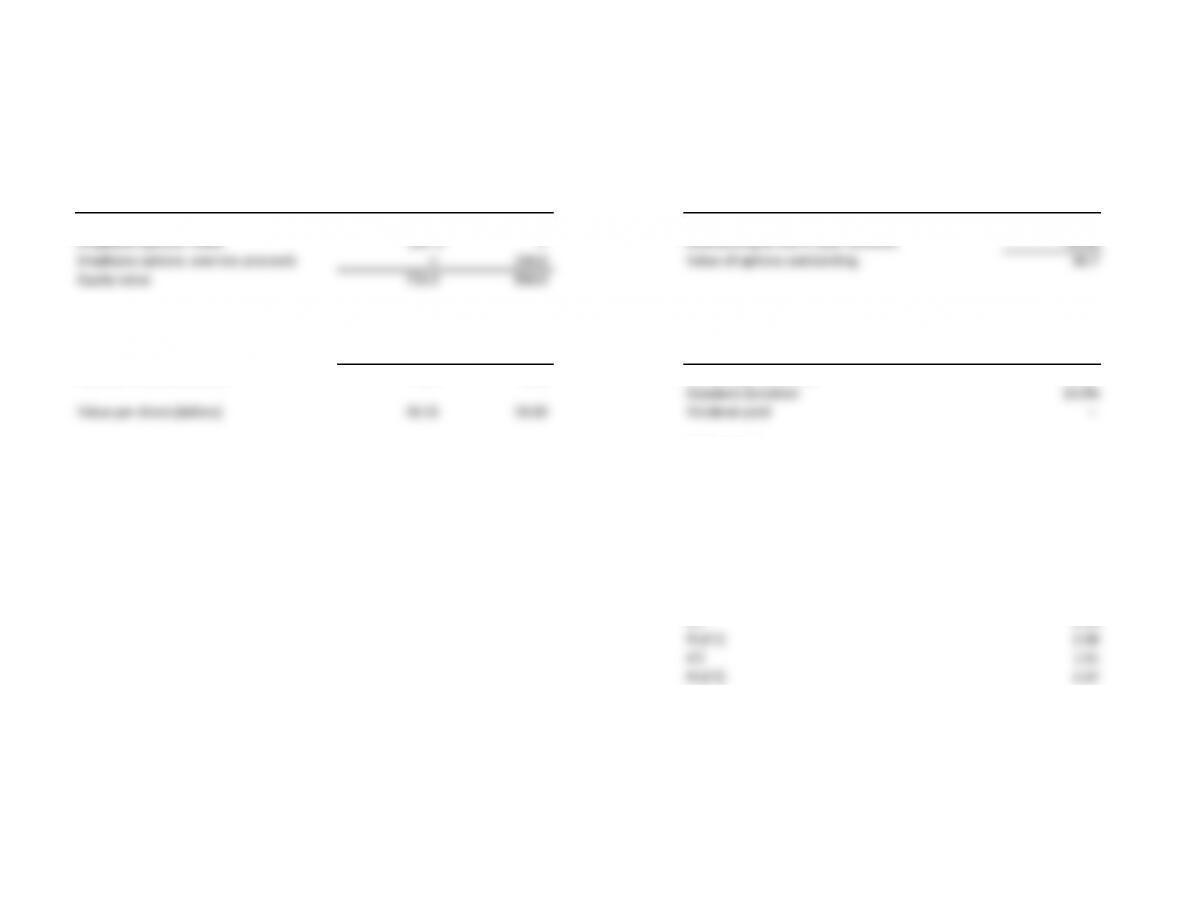
Question 6
Value of Exercise Exhibit data
outstanding value
options approach Option data Outstanding
Enterprise value 800.0 800.0 European call value ($) 6.67
Employee options: value (66.7) – Outstanding at end of year (million) 10.00
Employee options: exercise proceeds – 150.0 Value of options outstanding 66.7
Equity value 733.3 950.0
Number of shares (million) Option pricing
Number of nondiluted shares 40.0 40.0
New shares issued – 10.0 Stock price inputs Outstanding
Number of diluted shares 40.0 50.0 Underlying asset value 18.33
Standard deviation 10.0%
Value per share (dollars) 18.33 19.00 Dividend yield –
Option inputs
Strike price 15.00
Expiration (in years) 5.00
Market inputs
Risk-free rate 5.00%
Option price calculations
Variance 0.01
d12.13
N(d1) 0.98
d21.91
N(d2) 0.97
European call value 6.67
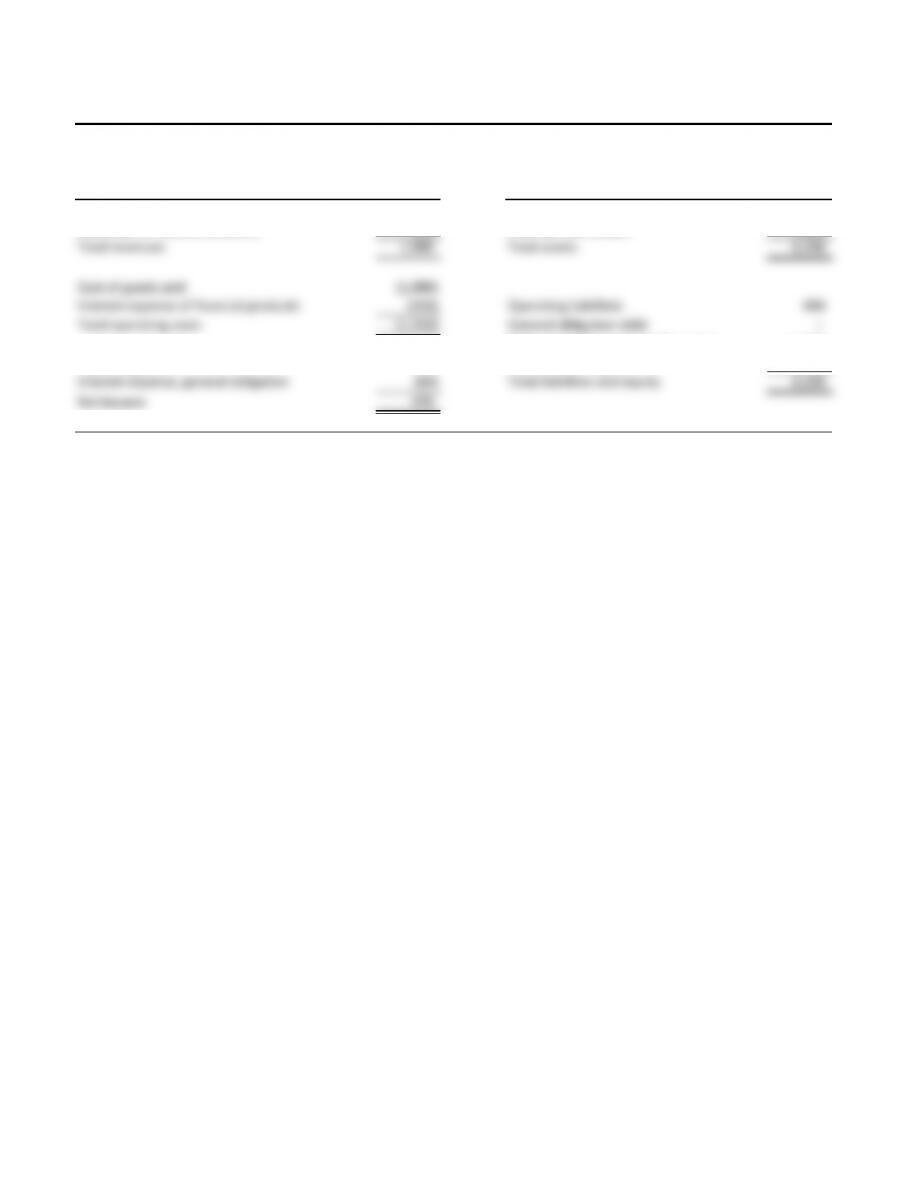
EXHIBIT 12.8 MarineCo: Income Statement and Balance Sheet
$ million
Income statement Balance sheet
Sales of machinery 1,500 Operating assets 2,200
Revenues of financial products 400 Financial receivables 4,000
Total revenues 1,900 Total assets 6,200
Cost of goods sold (1,000)
Interest expense of financial products (350) Operating liabilities 400
Total operating costs (1,350) General obligation debt –
Debt related to customer financing 3,600
Operating profit 550 Stockholders’ equity 2,200
Interest expense, general obligation (80) Total liabilities and equity 6,200
Net income 470